
Houses for sale & to rent in Ledbury, County of Herefordshire
House Prices in Ledbury
Properties in Ledbury have an average house price of £344k and had 569 Property Transactions within the last 3 years.¹
Ledbury is an area in County of Herefordshire with 5,919 households², where the most expensive property was sold for £1.16M.
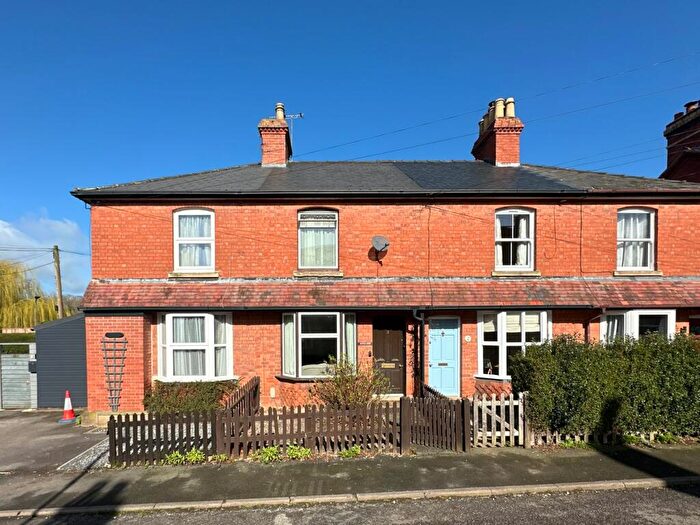
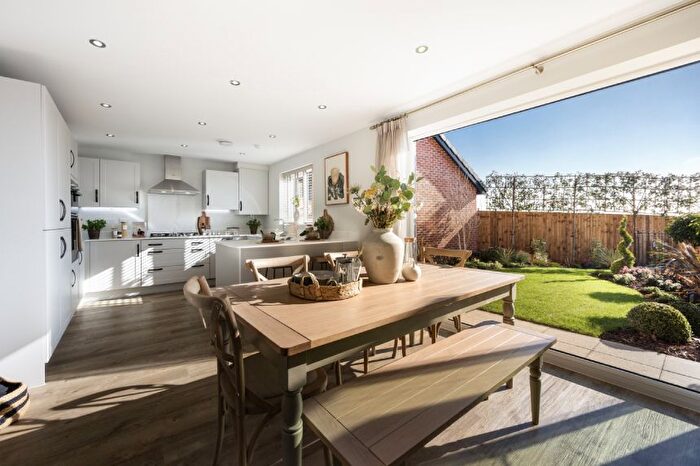
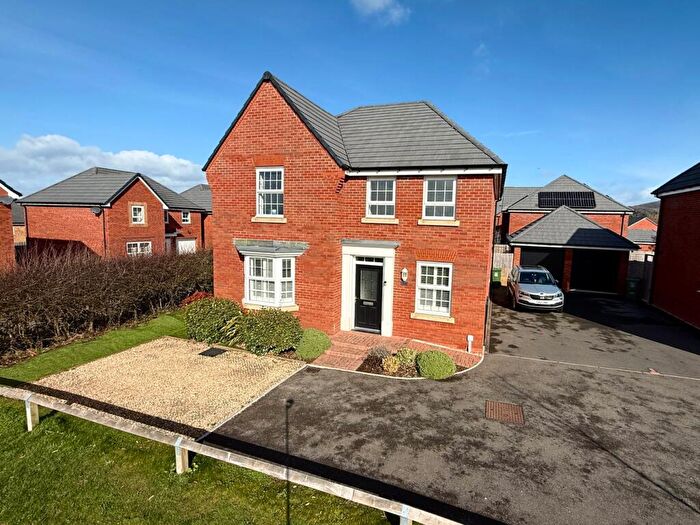
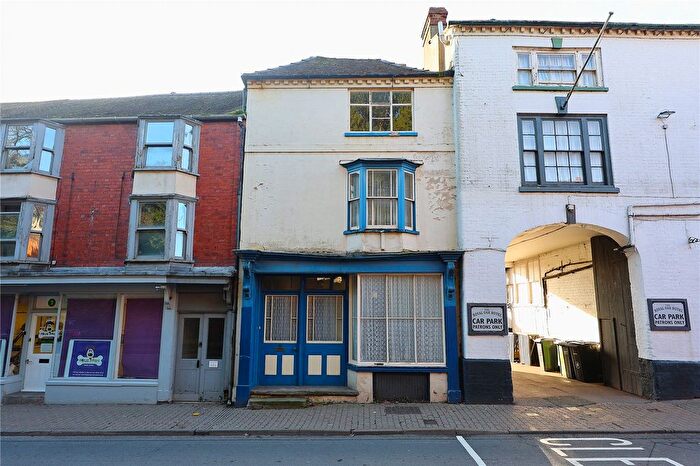
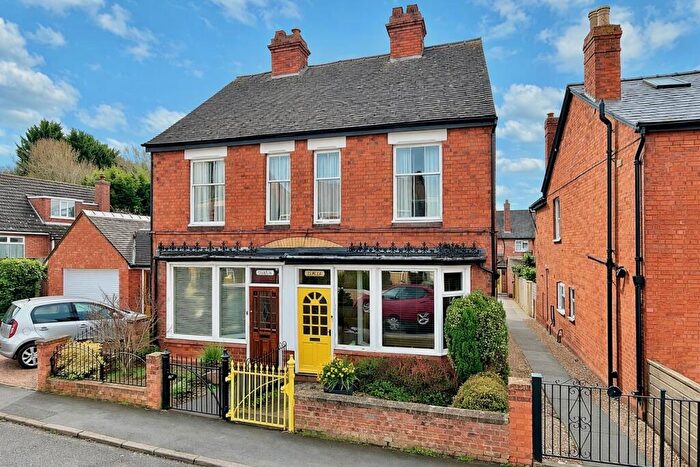
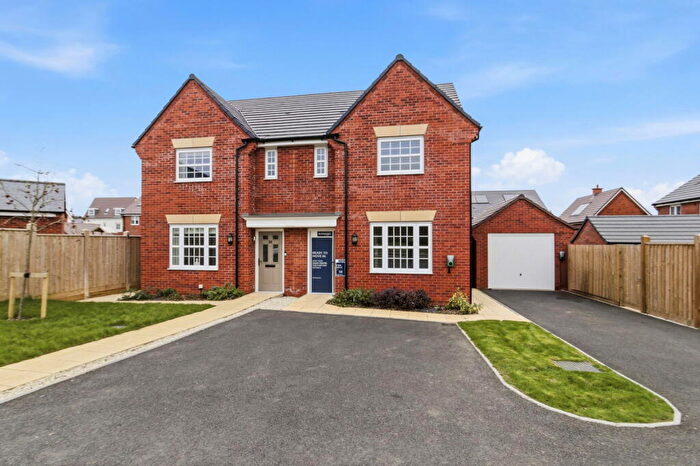
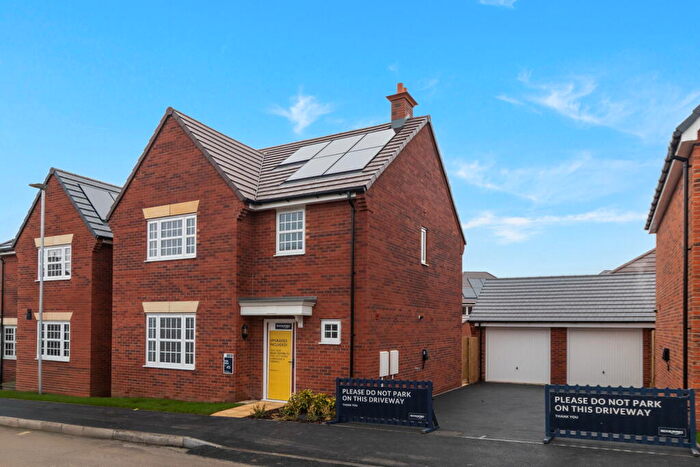
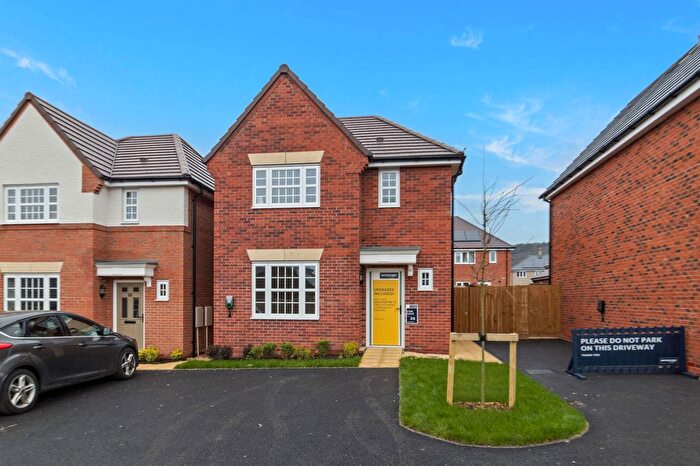
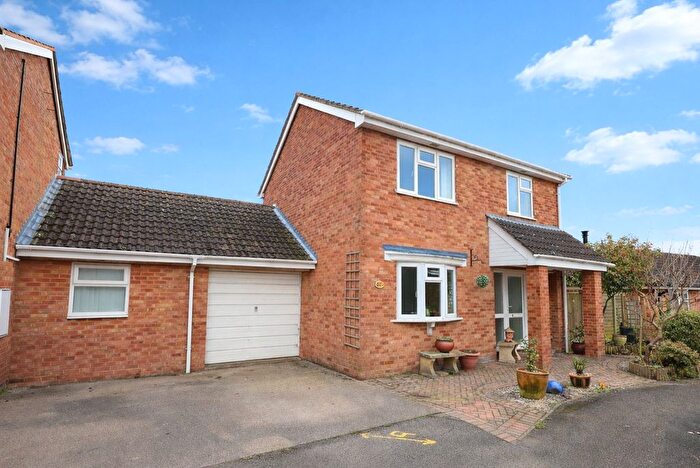
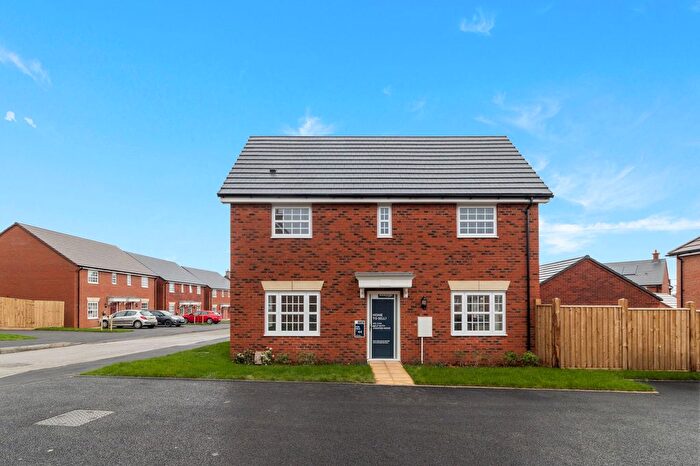
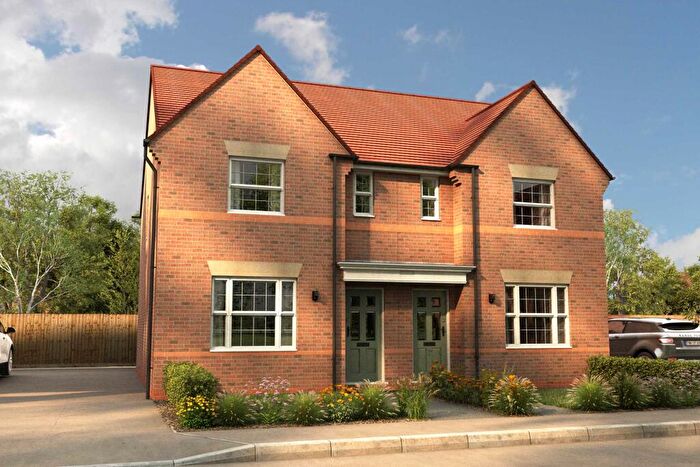
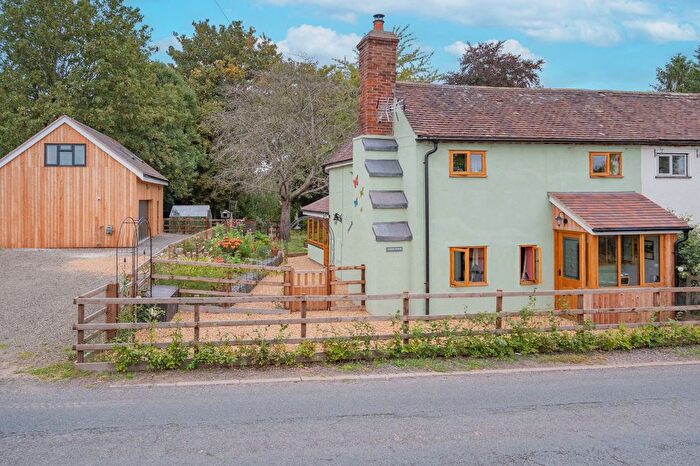
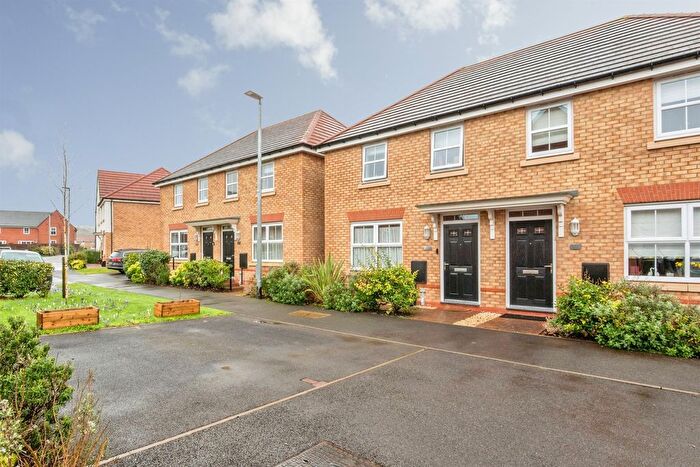
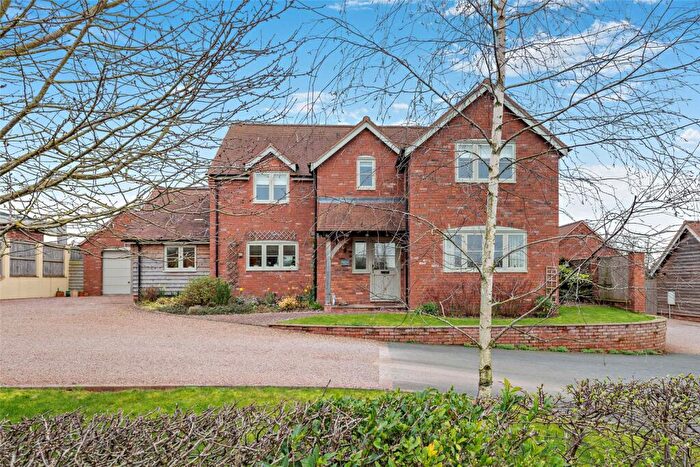
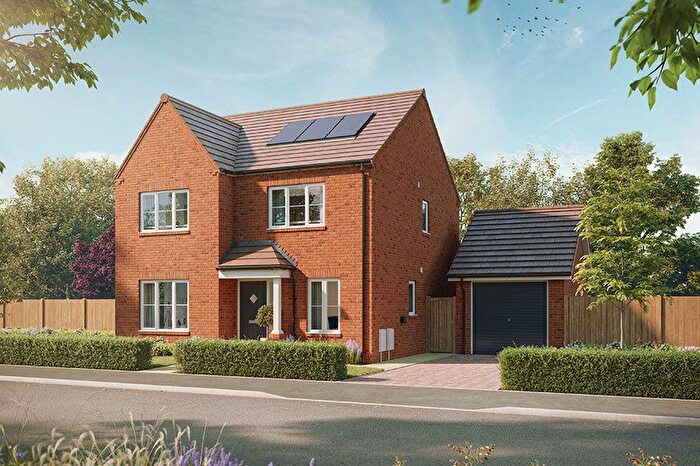
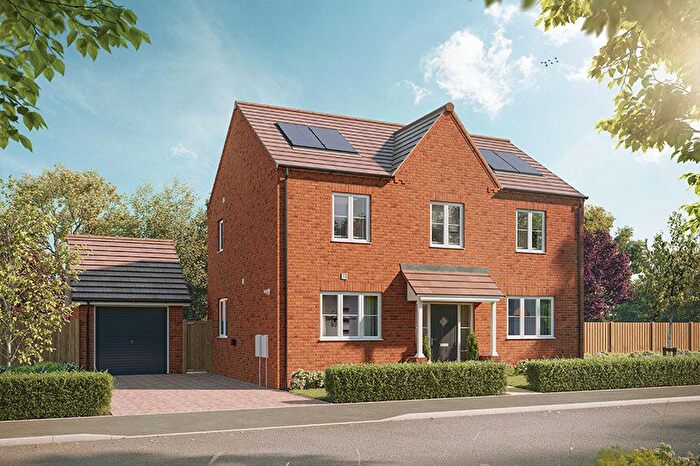
Properties for sale in Ledbury
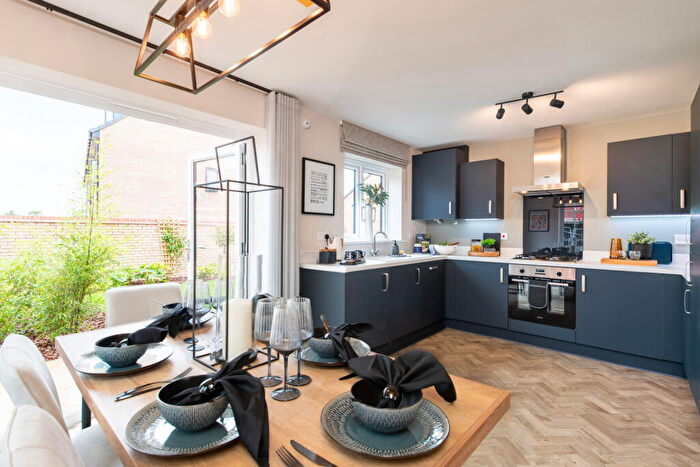
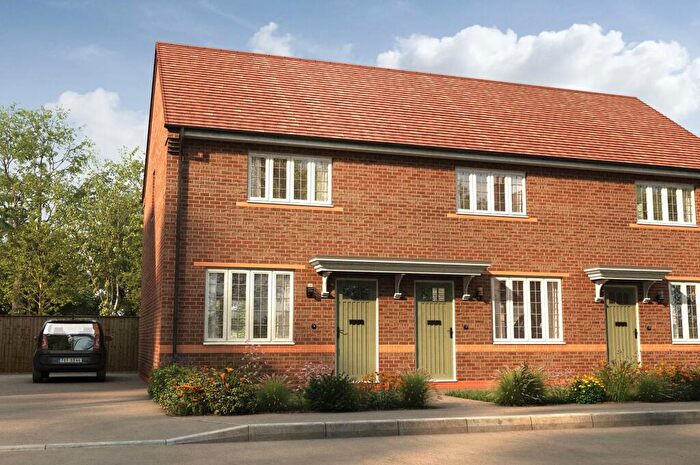
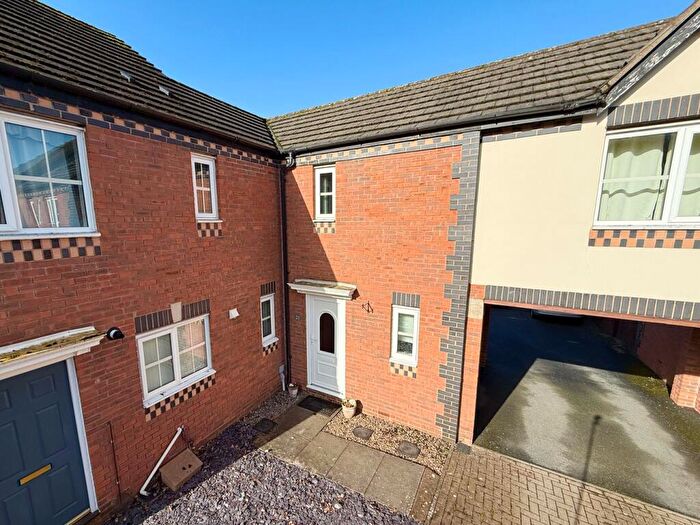
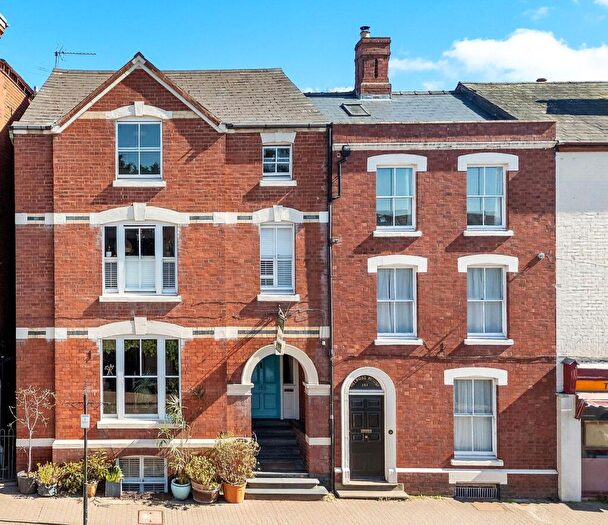
![]()
If you are looking to sell your house, let it out, or receive a property valuation, an expert can help you.
Click the button below to get started.


Neighbourhoods in Ledbury
Navigate through our locations to find the location of your next house in Ledbury, County of Herefordshire for sale or to rent.
Transport in Ledbury
Please see below transportation links in this area:

- FAQ
- Price Paid By Year
- Property Type Price
Frequently asked questions about Ledbury
What is the average price for a property for sale in Ledbury?
The average price for a property for sale in Ledbury is £343,947. This amount is 4% higher than the average price in County of Herefordshire. There are 3,692 property listings for sale in Ledbury.
What locations have the most expensive properties for sale in Ledbury?
The locations with the most expensive properties for sale in Ledbury are Hope End at an average of £533,283, Old Gore at an average of £527,315 and Three Crosses at an average of £497,400.
What locations have the most affordable properties for sale in Ledbury?
The locations with the most affordable properties for sale in Ledbury are Ledbury West at an average of £246,666, Ledbury at an average of £305,802 and Ledbury South at an average of £305,935.
Which train stations are available in or near Ledbury?
Some of the train stations available in or near Ledbury are Ledbury, Colwall and Great Malvern.
Property Price Paid in Ledbury by Year
The average sold property price by year was:
| Year | Average Sold Price | Price Change |
Sold Properties
|
|---|---|---|---|
| 2025 | £335,177 | -2% |
203 Properties |
| 2024 | £341,171 | -5% |
201 Properties |
| 2023 | £358,119 | -6% |
165 Properties |
| 2022 | £378,037 | 15% |
262 Properties |
| 2021 | £322,567 | -4% |
266 Properties |
| 2020 | £337,069 | 21% |
201 Properties |
| 2019 | £265,162 | -10% |
208 Properties |
| 2018 | £291,454 | 4% |
208 Properties |
| 2017 | £280,695 | 13% |
215 Properties |
| 2016 | £243,801 | -5% |
216 Properties |
| 2015 | £256,235 | 7% |
227 Properties |
| 2014 | £237,264 | 5% |
242 Properties |
| 2013 | £224,349 | -2% |
219 Properties |
| 2012 | £229,135 | -4% |
176 Properties |
| 2011 | £238,766 | 9% |
183 Properties |
| 2010 | £216,366 | -1% |
172 Properties |
| 2009 | £218,419 | -7% |
180 Properties |
| 2008 | £233,662 | -6% |
126 Properties |
| 2007 | £248,512 | 10% |
271 Properties |
| 2006 | £224,650 | 5% |
327 Properties |
| 2005 | £213,175 | 3% |
269 Properties |
| 2004 | £207,578 | 15% |
317 Properties |
| 2003 | £175,753 | 9% |
347 Properties |
| 2002 | £160,230 | 22% |
322 Properties |
| 2001 | £125,136 | 16% |
443 Properties |
| 2000 | £104,718 | 5% |
482 Properties |
| 1999 | £99,594 | 14% |
407 Properties |
| 1998 | £85,942 | 6% |
289 Properties |
| 1997 | £80,444 | 9% |
326 Properties |
| 1996 | £73,090 | 2% |
255 Properties |
| 1995 | £71,749 | - |
175 Properties |
Property Price per Property Type in Ledbury
Here you can find historic sold price data in order to help with your property search.
The average Property Paid Price for specific property types in the last three years are:
| Property Type | Average Sold Price | Sold Properties |
|---|---|---|
| Semi Detached House | £277,549.00 | 150 Semi Detached Houses |
| Detached House | £483,179.00 | 243 Detached Houses |
| Terraced House | £234,861.00 | 120 Terraced Houses |
| Flat | £151,392.00 | 56 Flats |