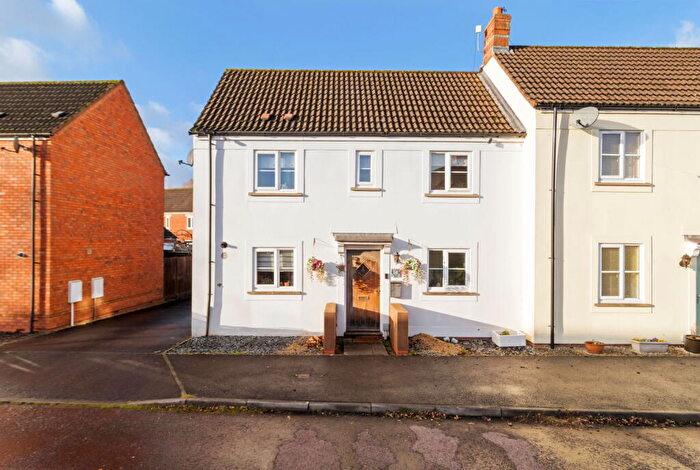
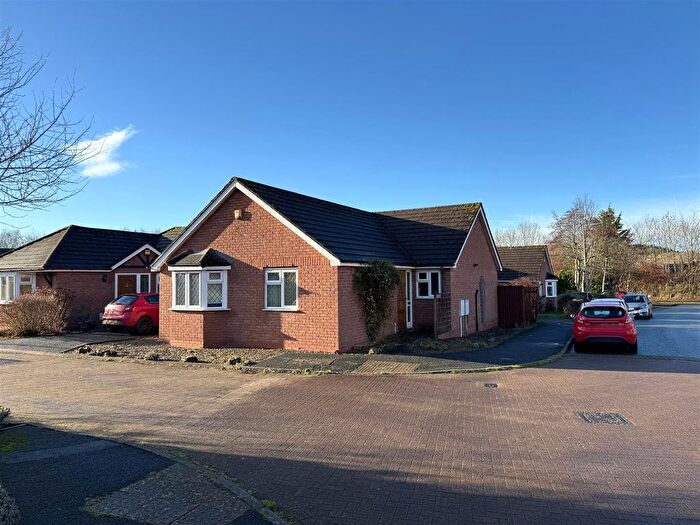
Houses for sale & to rent in Hope End, Ledbury
House Prices in Hope End
Properties in Hope End have an average house price of £528,833.00 and had 33 Property Transactions within the last 3 years¹.
Hope End is an area in Ledbury, County of Herefordshire with 553 households², where the most expensive property was sold for £1,135,000.00.
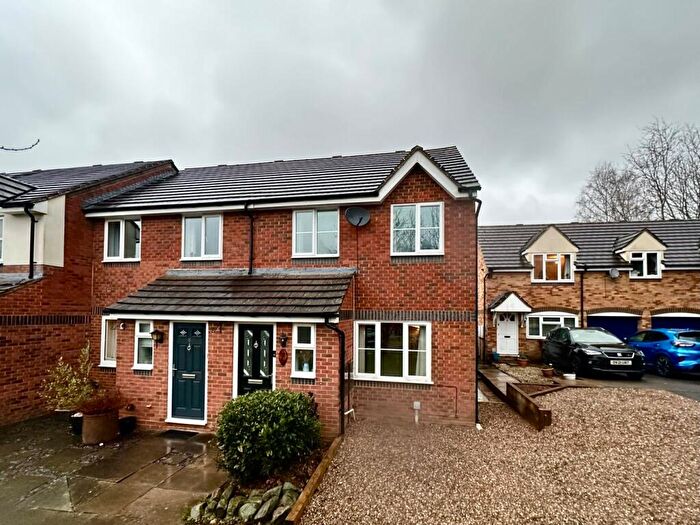
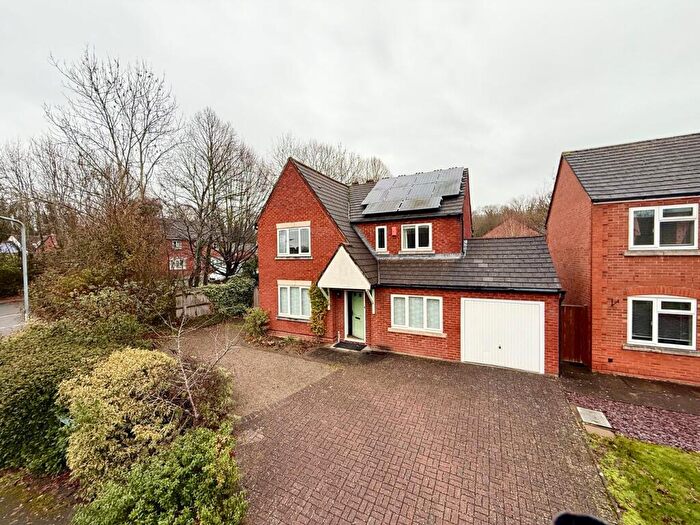
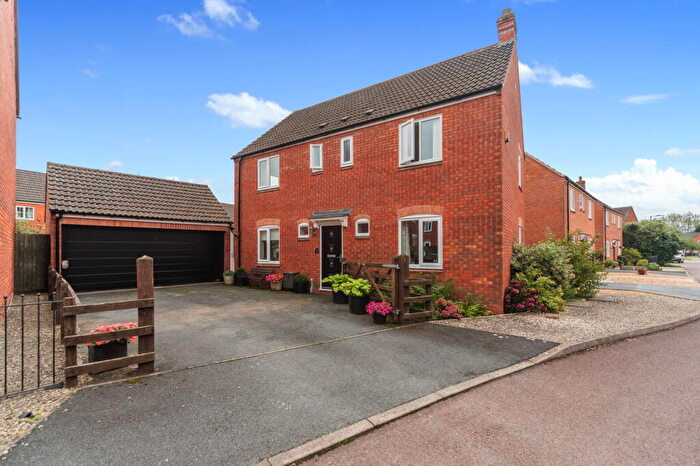
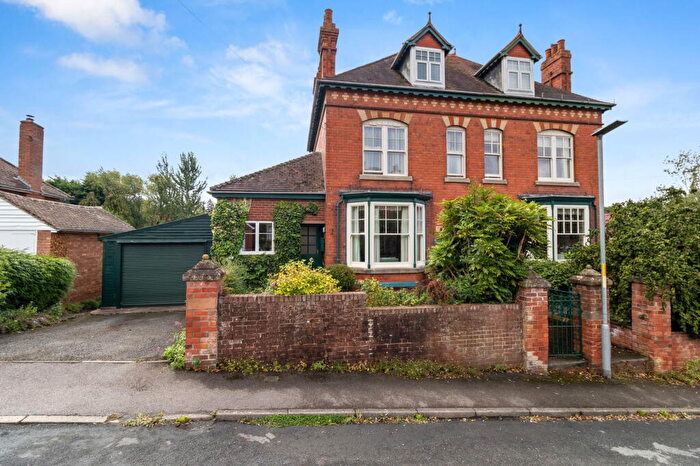
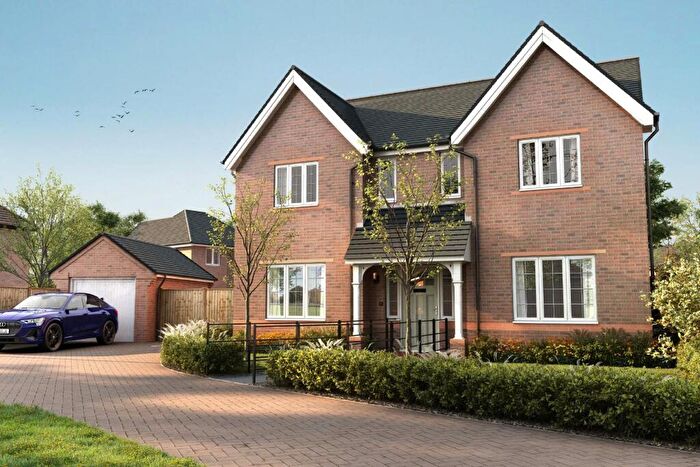
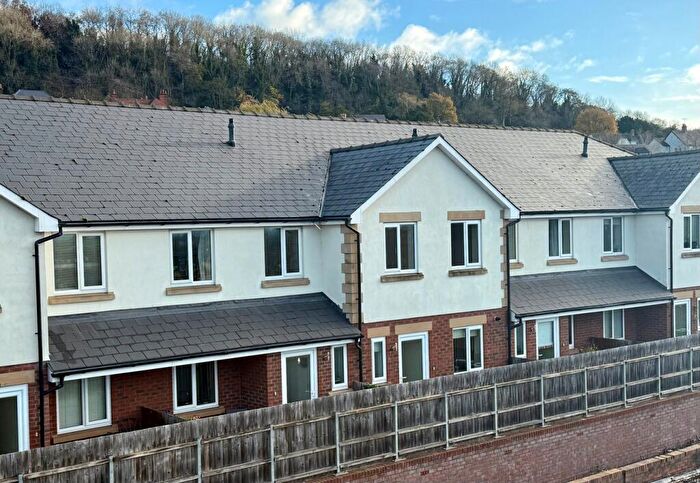
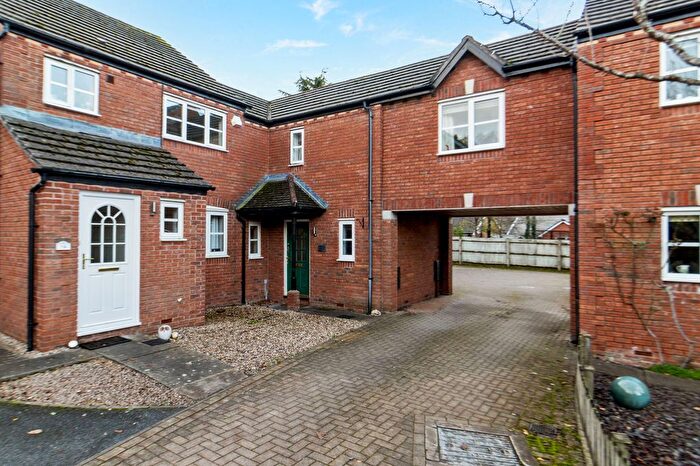
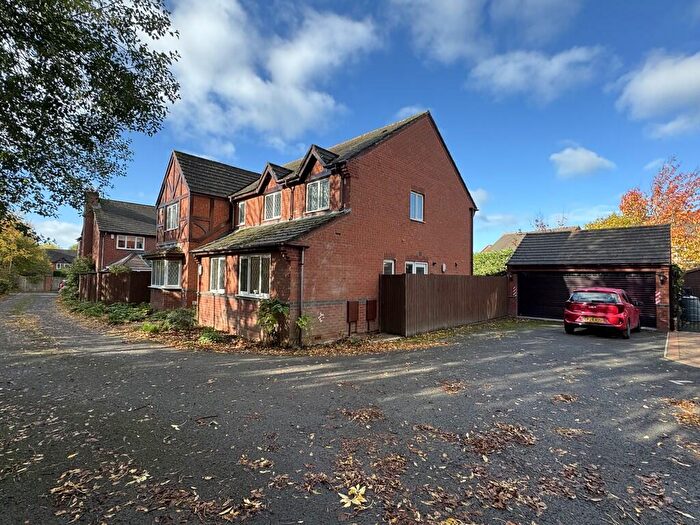
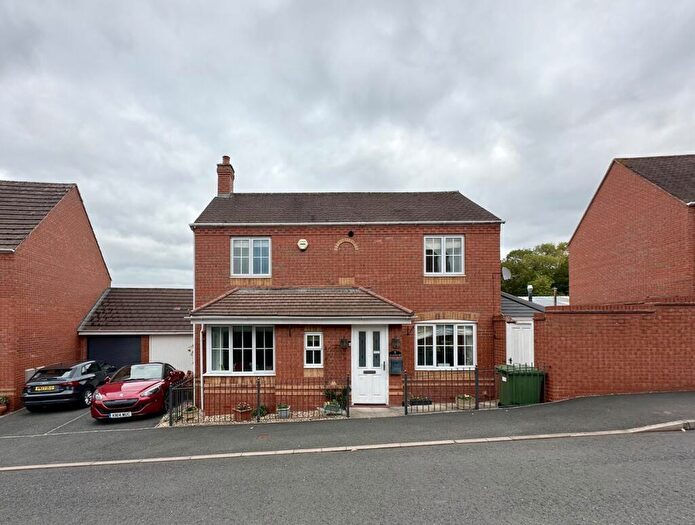
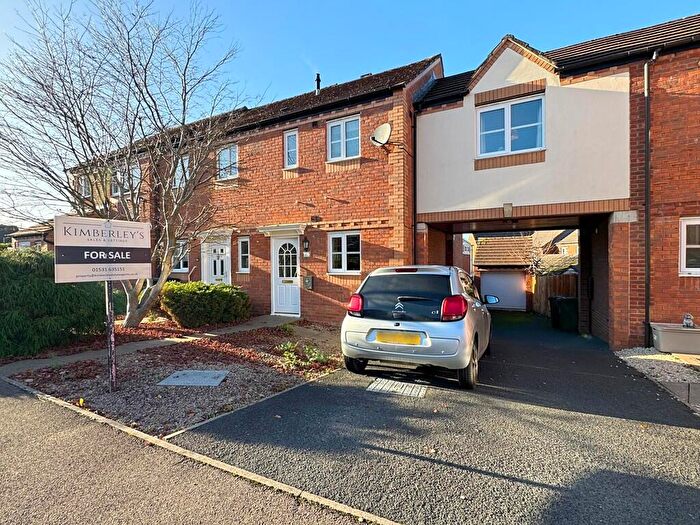
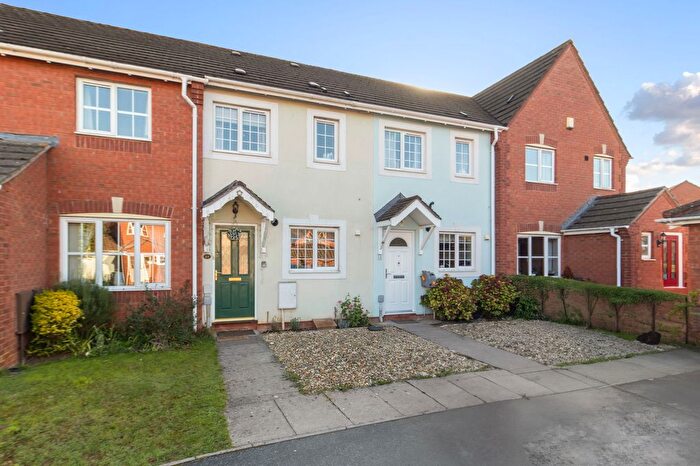
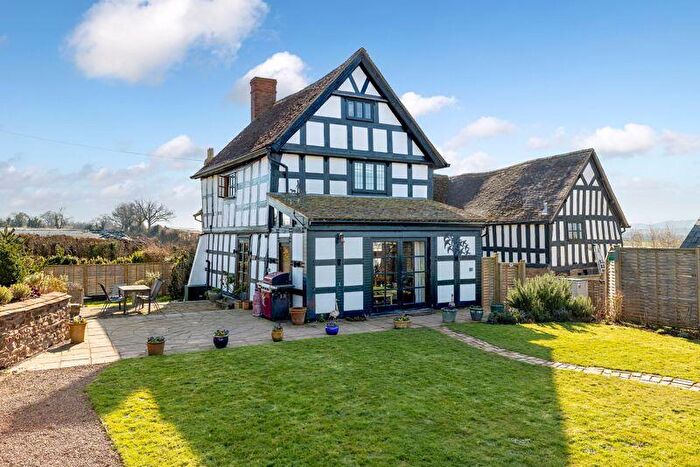
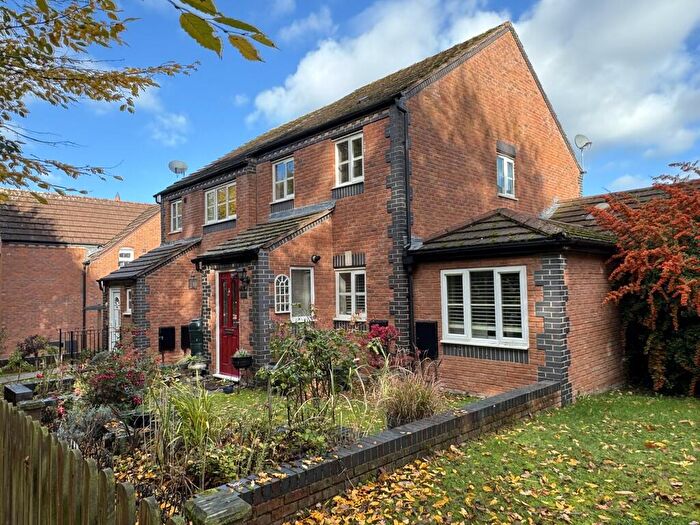
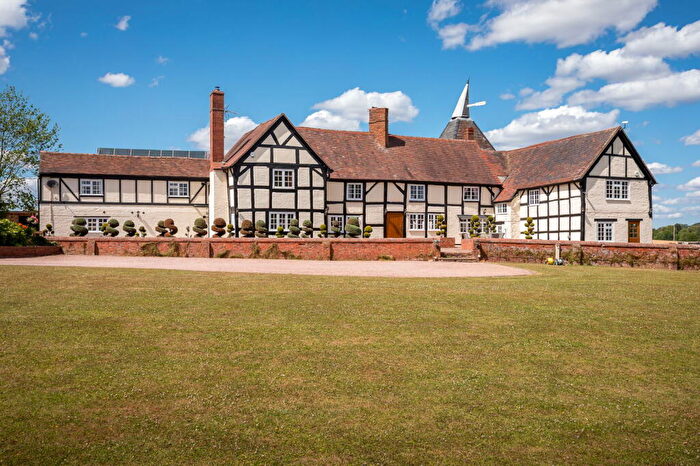
Properties for sale in Hope End
Roads and Postcodes in Hope End
Navigate through our locations to find the location of your next house in Hope End, Ledbury for sale or to rent.
| Streets | Postcodes |
|---|---|
| Aylescroft | HR8 1QA |
| Burtons Lane | HR8 1NF |
| Church Lane | HR8 1NG |
| Dowdings Close | HR8 1FD |
| Forge Bank | HR8 1QU |
| Horse Road | HR8 1LP HR8 1LS |
| Ledbury Road | HR8 1ND |
| Lower Cold Green Cottages | HR8 1NJ |
| Lower Southfield Lane | HR8 1NH |
| Moat Cottages | HR8 1JW |
| Morton Cottages | HR8 1PT |
| Oak Tree Close | HR8 1NU |
| Ochre Hill | HR8 1LZ |
| Orchard Gardens | HR8 1LR |
| Slatchwood Cottages | HR8 1JN |
| Southfield Lane | HR8 1PZ |
| Stanley Hill | HR8 1HE |
| The Common | HR8 1LT HR8 1LU HR8 1LY |
| Upper Court Road | HR8 1QX |
| Victoria Row | HR8 1LX |
| Wellington Heath | HR8 1JQ HR8 1NA HR8 1NB HR8 1NE |
| HR8 1HB HR8 1HD HR8 1JG HR8 1JH HR8 1JJ HR8 1JL HR8 1JP HR8 1JR HR8 1JS HR8 1JU HR8 1JX HR8 1NN HR8 1NP HR8 1NQ HR8 1PR HR8 1PS HR8 1PU HR8 1PX HR8 1QB HR8 1QD HR8 1QF HR8 1QH HR8 1QL HR8 1QN HR8 1QR HR8 1QW HR8 2SJ HR8 2SL HR8 1HA HR8 1HZ HR8 1JT HR8 1JY HR8 1JZ HR8 1NL HR8 1NW HR8 1PY HR8 1QE HR8 1QG HR8 1QP HR8 1QQ HR8 1QS HR8 1QT |
Transport near Hope End
- FAQ
- Price Paid By Year
- Property Type Price
Frequently asked questions about Hope End
What is the average price for a property for sale in Hope End?
The average price for a property for sale in Hope End is £528,833. This amount is 55% higher than the average price in Ledbury. There are 276 property listings for sale in Hope End.
What streets have the most expensive properties for sale in Hope End?
The streets with the most expensive properties for sale in Hope End are Burtons Lane at an average of £757,500, Orchard Gardens at an average of £645,000 and The Common at an average of £562,166.
What streets have the most affordable properties for sale in Hope End?
The streets with the most affordable properties for sale in Hope End are Stanley Hill at an average of £320,000, Southfield Lane at an average of £452,500 and Wellington Heath at an average of £461,916.
Which train stations are available in or near Hope End?
Some of the train stations available in or near Hope End are Ledbury, Colwall and Great Malvern.
Property Price Paid in Hope End by Year
The average sold property price by year was:
| Year | Average Sold Price | Price Change |
Sold Properties
|
|---|---|---|---|
| 2025 | £419,666 | -39% |
6 Properties |
| 2024 | £583,035 | 11% |
14 Properties |
| 2023 | £520,846 | -7% |
13 Properties |
| 2022 | £556,687 | 15% |
16 Properties |
| 2021 | £473,135 | -4% |
20 Properties |
| 2020 | £491,116 | 23% |
21 Properties |
| 2019 | £378,035 | -6% |
14 Properties |
| 2018 | £400,576 | -31% |
23 Properties |
| 2017 | £525,952 | 38% |
17 Properties |
| 2016 | £325,790 | -18% |
16 Properties |
| 2015 | £385,891 | 9% |
23 Properties |
| 2014 | £350,305 | 13% |
18 Properties |
| 2013 | £304,466 | -31% |
15 Properties |
| 2012 | £399,598 | 5% |
11 Properties |
| 2011 | £379,801 | 9% |
12 Properties |
| 2010 | £344,136 | -5% |
11 Properties |
| 2009 | £362,666 | -62% |
12 Properties |
| 2008 | £588,333 | 36% |
3 Properties |
| 2007 | £379,365 | -4% |
19 Properties |
| 2006 | £393,552 | 19% |
18 Properties |
| 2005 | £319,839 | 10% |
18 Properties |
| 2004 | £289,275 | 15% |
18 Properties |
| 2003 | £246,208 | -8% |
12 Properties |
| 2002 | £265,812 | 26% |
27 Properties |
| 2001 | £195,490 | 40% |
26 Properties |
| 2000 | £118,212 | -22% |
13 Properties |
| 1999 | £143,786 | 4% |
19 Properties |
| 1998 | £137,455 | 14% |
17 Properties |
| 1997 | £118,164 | 20% |
20 Properties |
| 1996 | £94,652 | -24% |
14 Properties |
| 1995 | £117,782 | - |
14 Properties |
Property Price per Property Type in Hope End
Here you can find historic sold price data in order to help with your property search.
The average Property Paid Price for specific property types in the last three years are:
| Property Type | Average Sold Price | Sold Properties |
|---|---|---|
| Semi Detached House | £337,333.00 | 6 Semi Detached Houses |
| Detached House | £585,673.00 | 26 Detached Houses |
| Terraced House | £200,000.00 | 1 Terraced House |

