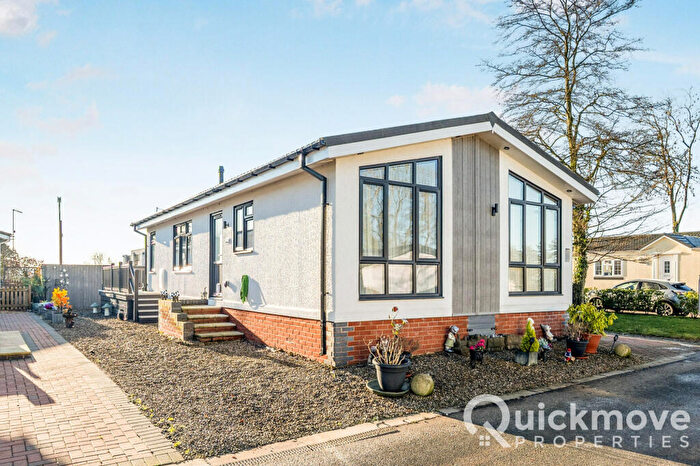
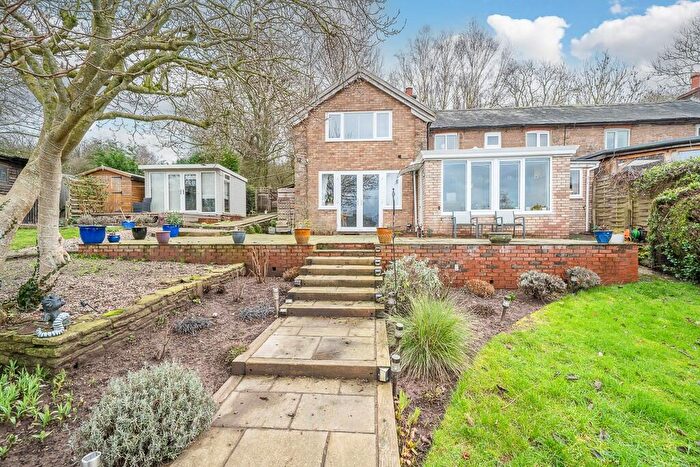
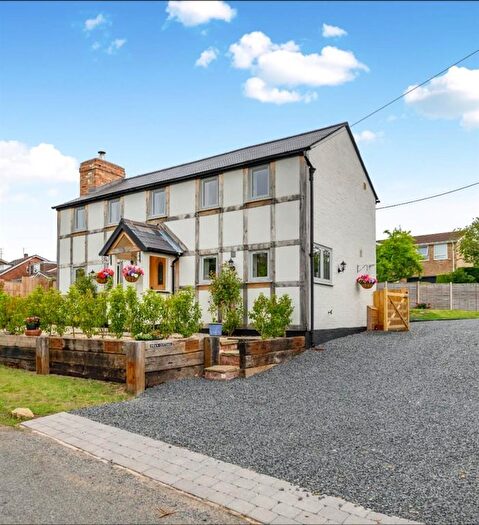
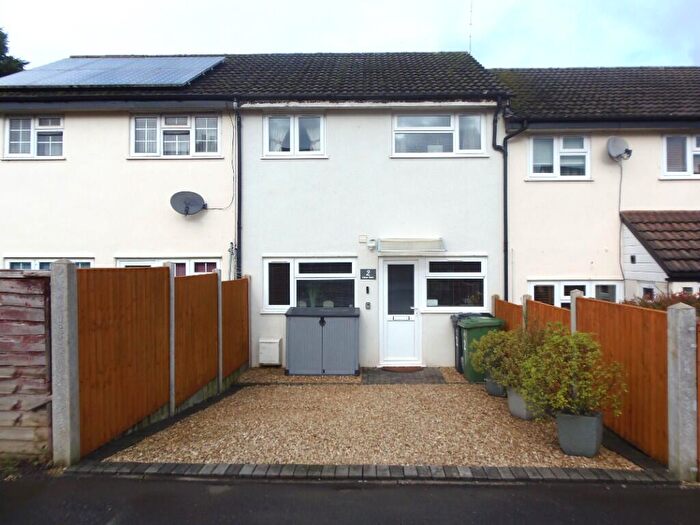
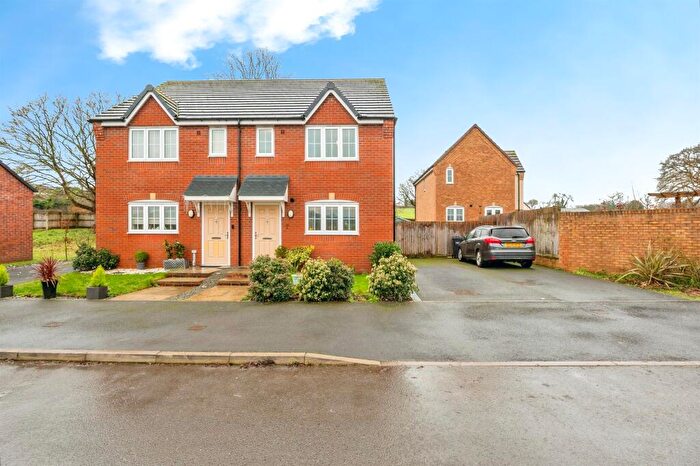
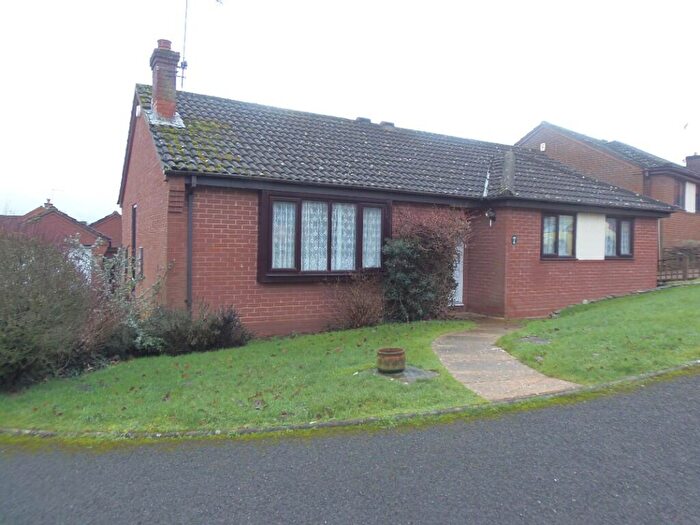
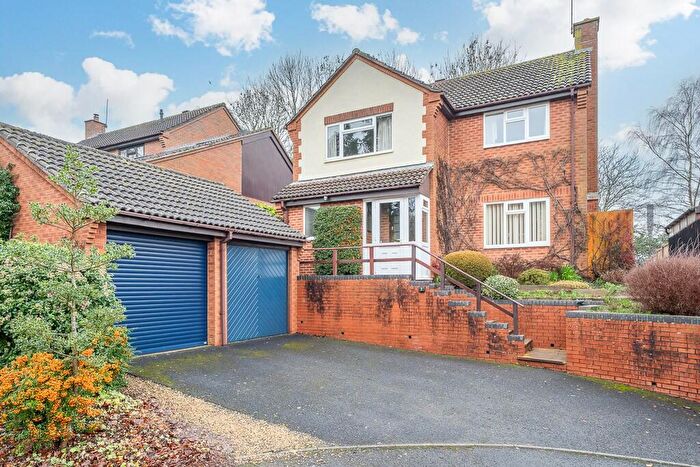
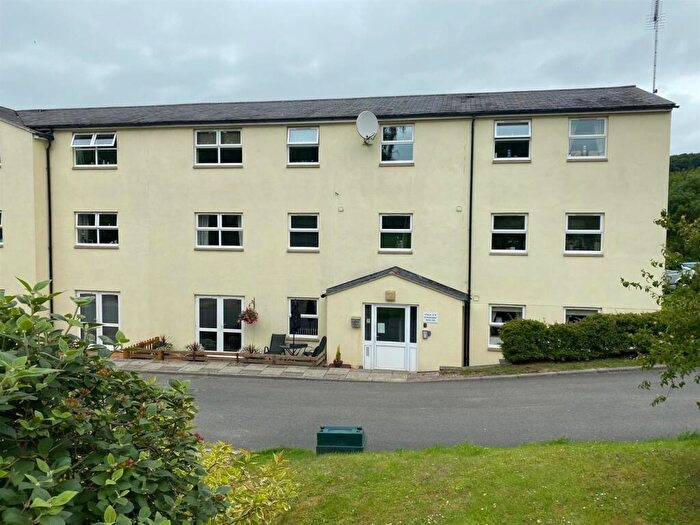
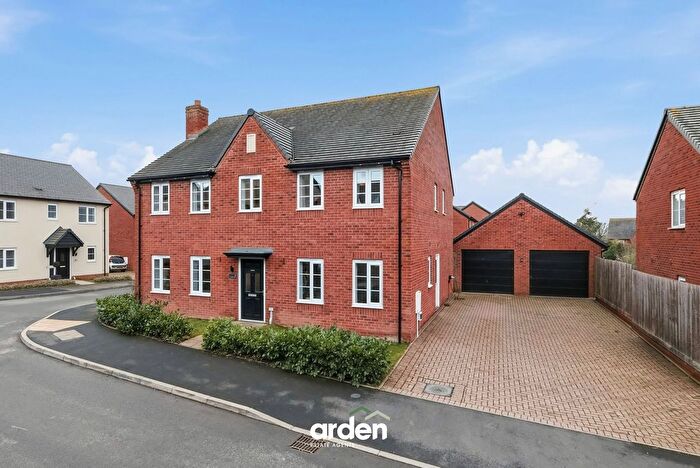
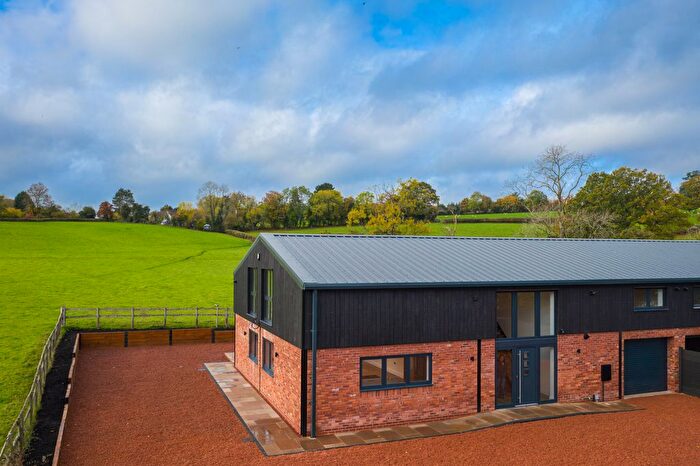
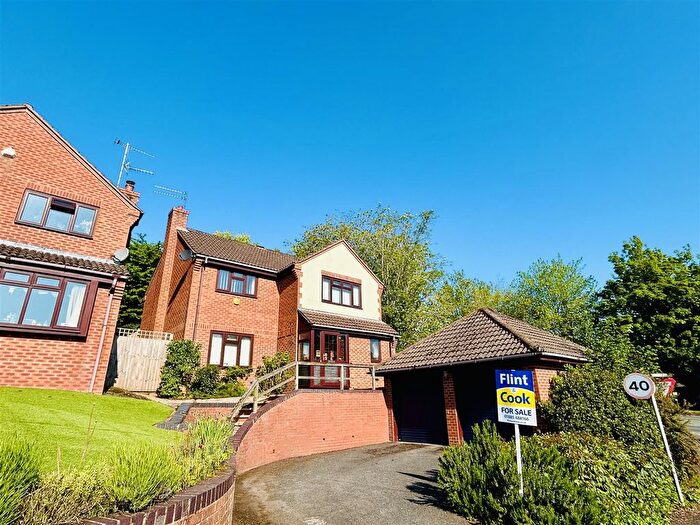
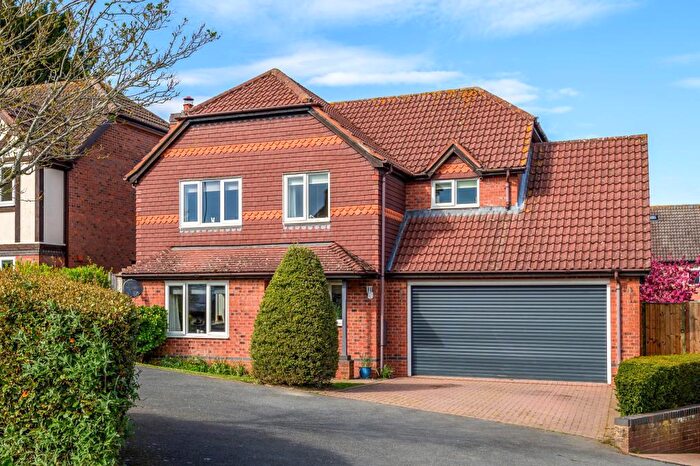
Houses for sale & to rent in Bringsty, Worcester
House Prices in Bringsty
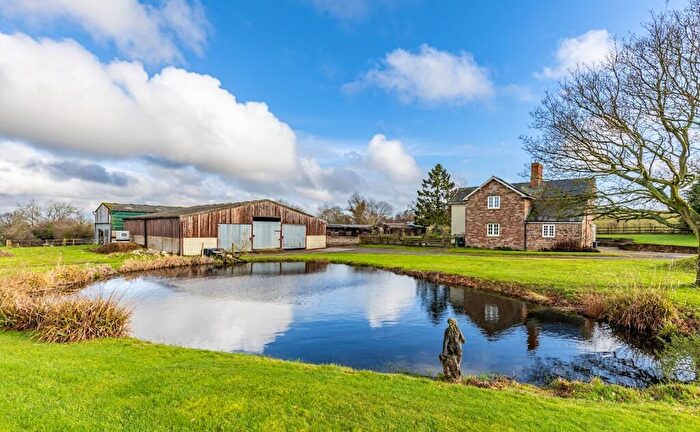
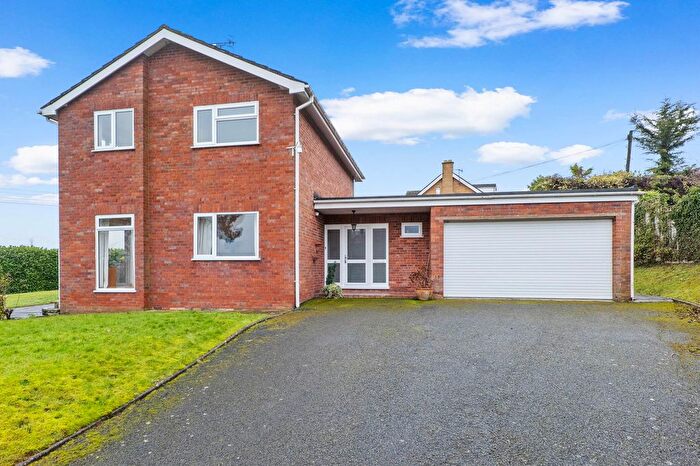
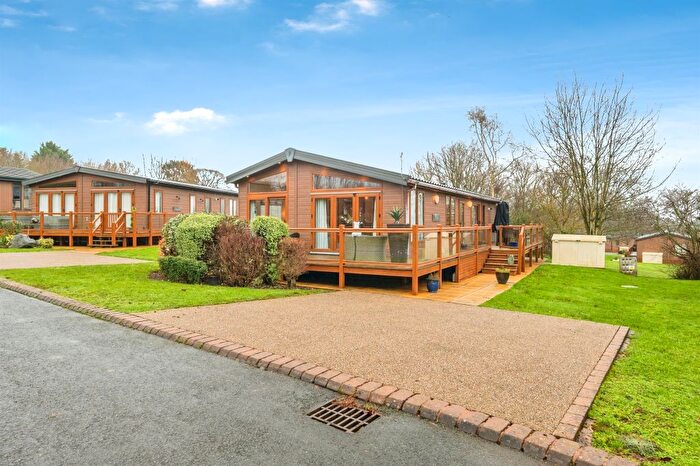
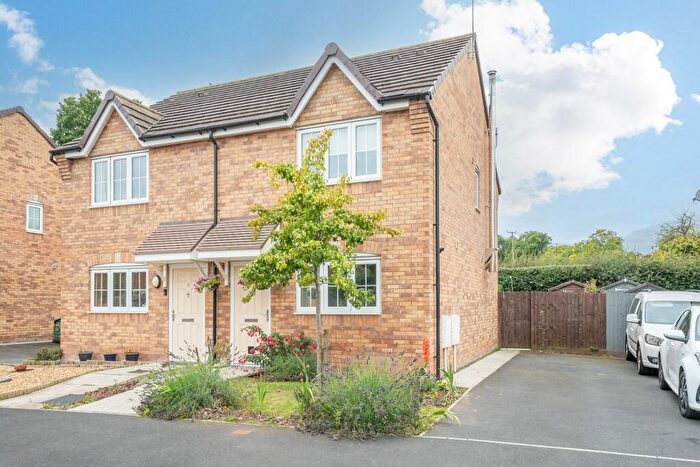
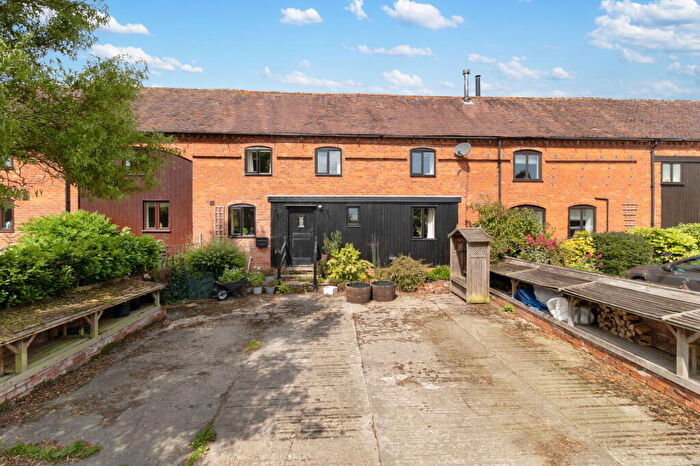
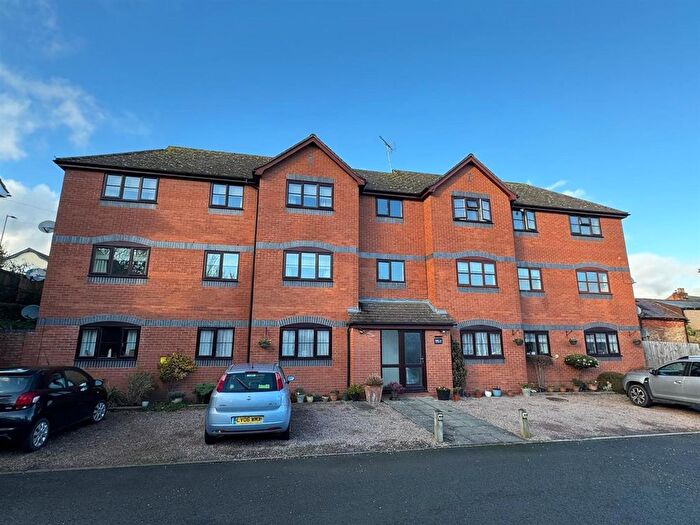
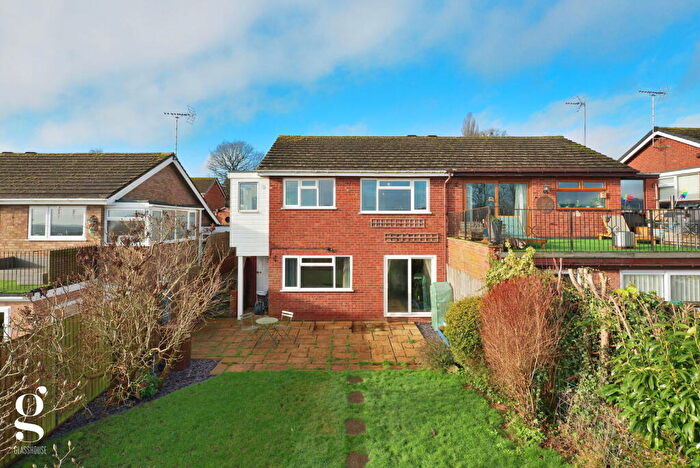
Properties in Bringsty have an average house price of £499,400.00 and had 30 Property Transactions within the last 3 years¹.
Bringsty is an area in Worcester, County of Herefordshire with 547 households², where the most expensive property was sold for £1,250,000.00.
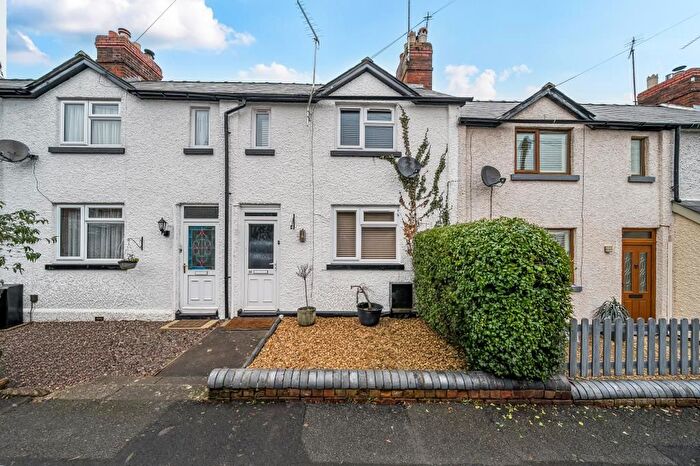
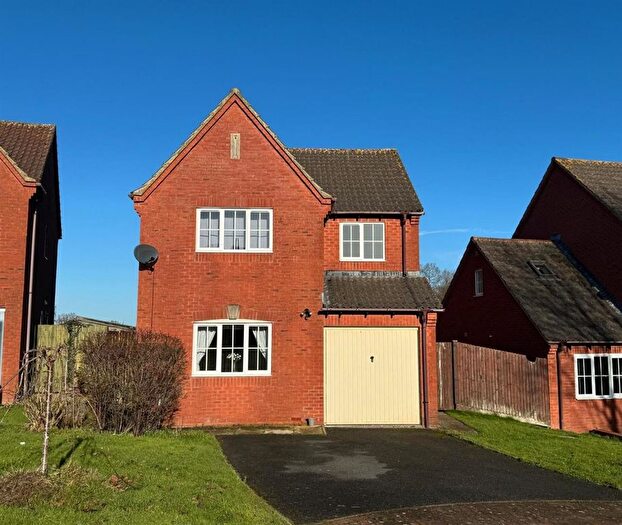
Properties for sale in Bringsty
Roads and Postcodes in Bringsty
Navigate through our locations to find the location of your next house in Bringsty, Worcester for sale or to rent.
| Streets | Postcodes |
|---|---|
| Acreage | WR6 5SA |
| Ashpool | WR6 5SD |
| Badley Wood | WR6 5SJ |
| Boat Lane | WR6 5RS |
| Bringsty Common | WR6 5UJ WR6 5UN WR6 5UP WR6 5UW |
| Brockhampton Park | WR6 5TB |
| Bromyard Road | WR6 5SF WR6 5TA WR6 5TP |
| Church Close | WR6 6TL |
| Gaines Road | WR6 5RD |
| Linley Green | WR6 5RG WR6 5RQ |
| Linley Green Road | WR6 5RE WR6 5RF |
| Little Tedney | WR6 5RX |
| Lockhill | WR6 6XR |
| Malvern Road | WR6 5TR |
| Meadow Green | WR6 5RN WR6 5RW |
| Old Fold Yard Court | WR6 6XZ |
| Old Forge | WR6 5SB |
| Orchard Gardens | WR6 6XP |
| Park Lane | WR6 6ET |
| Rock Lane | WR6 6ER |
| Sapey Common | WR6 6ES |
| Southington Lane | WR6 5TS |
| Stonehouse Lane | WR6 5TF WR6 5TG |
| The Manors Of Shelsley | WR6 6ED |
| Whitbourne Hall Park | WR6 5SH |
| WR6 5RP WR6 5RR WR6 5RT WR6 5RU WR6 5RZ WR6 5SE WR6 5SP WR6 5SR WR6 5SS WR6 5TE WR6 5UG WR6 5UL WR6 5UQ WR6 6EF WR6 6EP WR6 6EQ WR6 6EZ WR6 6HA WR6 6XT |
Transport near Bringsty
-
Malvern Link Station
-
Great Malvern Station
-
Worcester Foregate Street Station
-
Worcester Shrub Hill Station
- FAQ
- Price Paid By Year
- Property Type Price
Frequently asked questions about Bringsty
What is the average price for a property for sale in Bringsty?
The average price for a property for sale in Bringsty is £499,400. This amount is 12% higher than the average price in Worcester. There are 754 property listings for sale in Bringsty.
What streets have the most expensive properties for sale in Bringsty?
The streets with the most expensive properties for sale in Bringsty are Southington Lane at an average of £1,250,000, Lockhill at an average of £1,100,000 and Bringsty Common at an average of £720,000.
What streets have the most affordable properties for sale in Bringsty?
The streets with the most affordable properties for sale in Bringsty are Linley Green at an average of £345,000, Bromyard Road at an average of £380,750 and Old Forge at an average of £390,000.
Which train stations are available in or near Bringsty?
Some of the train stations available in or near Bringsty are Malvern Link, Great Malvern and Worcester Foregate Street.
Property Price Paid in Bringsty by Year
The average sold property price by year was:
| Year | Average Sold Price | Price Change |
Sold Properties
|
|---|---|---|---|
| 2025 | £528,800 | -0,2% |
15 Properties |
| 2024 | £530,000 | 34% |
10 Properties |
| 2023 | £350,000 | -65% |
5 Properties |
| 2022 | £578,105 | 15% |
19 Properties |
| 2021 | £490,075 | 19% |
35 Properties |
| 2020 | £395,576 | 4% |
13 Properties |
| 2019 | £378,361 | 17% |
18 Properties |
| 2018 | £313,826 | 2% |
15 Properties |
| 2017 | £307,043 | -8% |
22 Properties |
| 2016 | £332,713 | -4% |
23 Properties |
| 2015 | £346,500 | -3% |
14 Properties |
| 2014 | £357,915 | -0,4% |
16 Properties |
| 2013 | £359,470 | 8% |
20 Properties |
| 2012 | £331,769 | 2% |
13 Properties |
| 2011 | £326,321 | -12% |
14 Properties |
| 2010 | £364,857 | 14% |
14 Properties |
| 2009 | £315,555 | -10% |
9 Properties |
| 2008 | £347,437 | -4% |
8 Properties |
| 2007 | £360,774 | -17% |
31 Properties |
| 2006 | £421,040 | 27% |
22 Properties |
| 2005 | £308,933 | 17% |
15 Properties |
| 2004 | £255,312 | -1% |
16 Properties |
| 2003 | £258,329 | -2% |
12 Properties |
| 2002 | £264,248 | 30% |
26 Properties |
| 2001 | £185,914 | 24% |
24 Properties |
| 2000 | £141,520 | -8% |
24 Properties |
| 1999 | £152,750 | 19% |
24 Properties |
| 1998 | £123,645 | 3% |
24 Properties |
| 1997 | £119,824 | 27% |
20 Properties |
| 1996 | £87,665 | -8% |
28 Properties |
| 1995 | £94,789 | - |
14 Properties |
Property Price per Property Type in Bringsty
Here you can find historic sold price data in order to help with your property search.
The average Property Paid Price for specific property types in the last three years are:
| Property Type | Average Sold Price | Sold Properties |
|---|---|---|
| Semi Detached House | £263,000.00 | 4 Semi Detached Houses |
| Detached House | £593,200.00 | 20 Detached Houses |
| Terraced House | £382,000.00 | 3 Terraced Houses |
| Flat | £306,666.00 | 3 Flats |

