
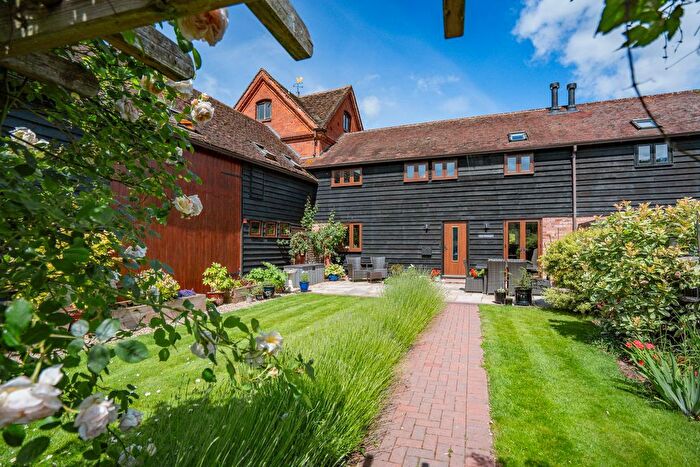
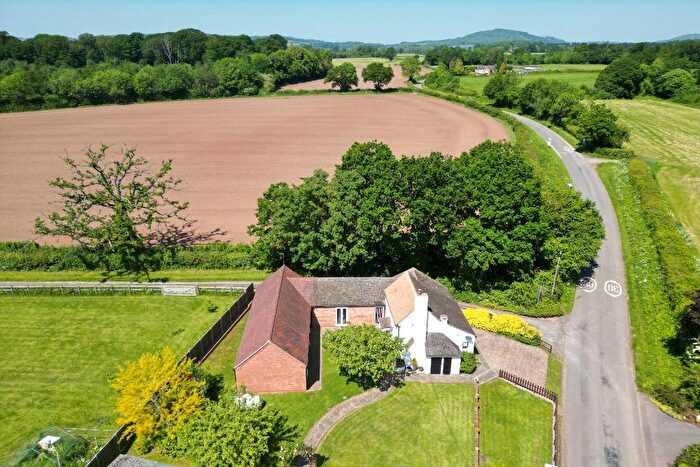
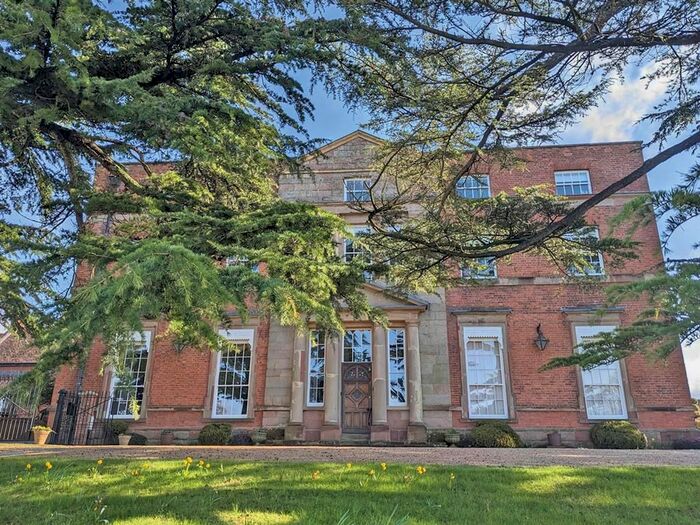
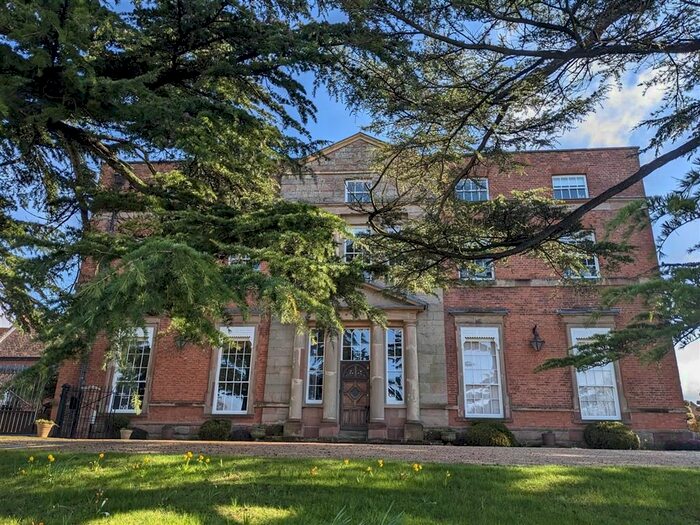
Houses for sale in Martley, Worcester
House Prices in Martley
Properties in Martley have an average house price of £474k and had 58 Property Transactions within the last 3 years¹.
Martley is an area in Worcester, Worcestershire with 830 households², where the most expensive property was sold for £1.4M.
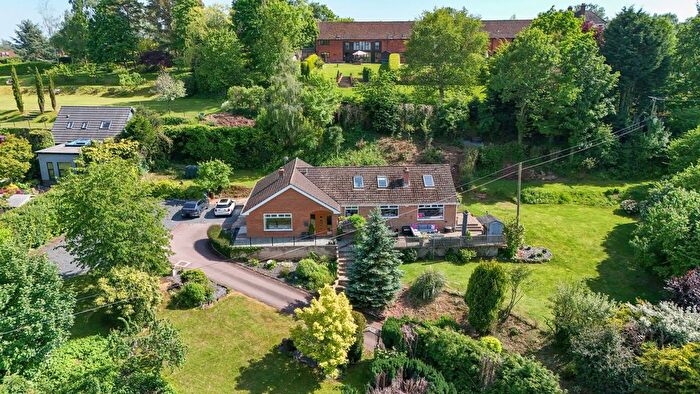
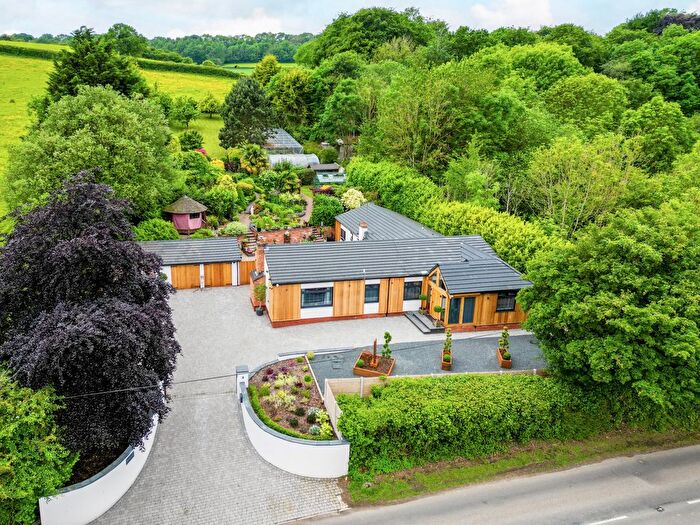
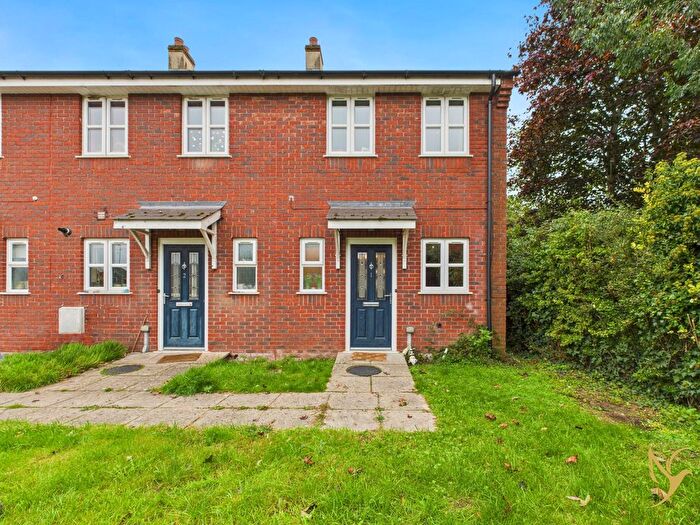
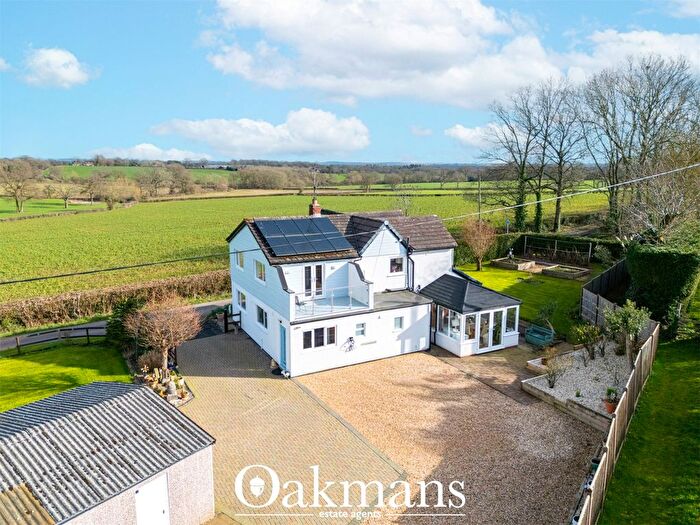
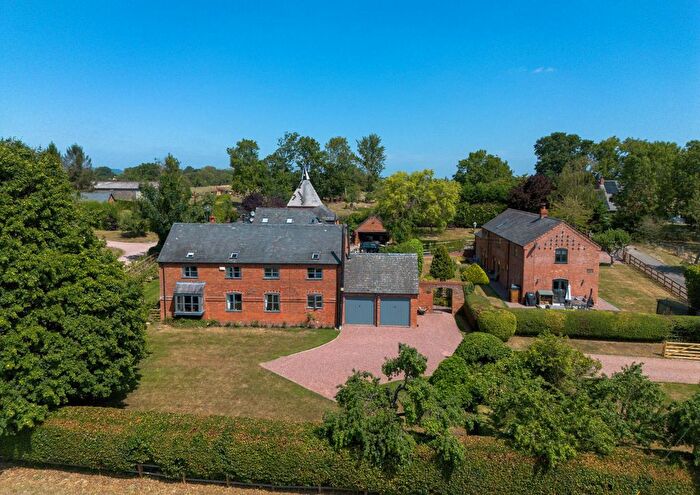
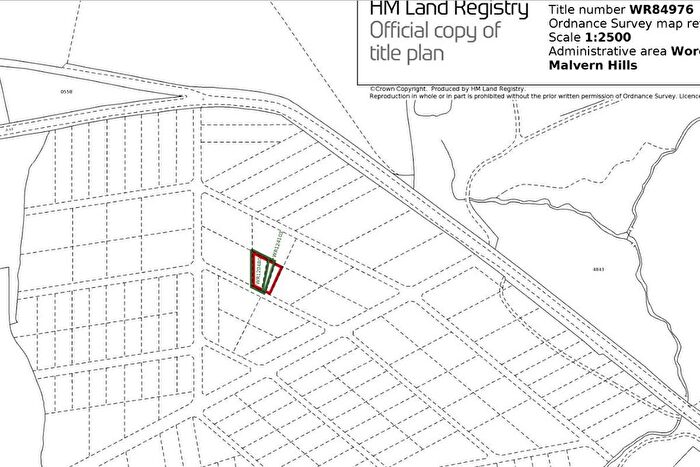
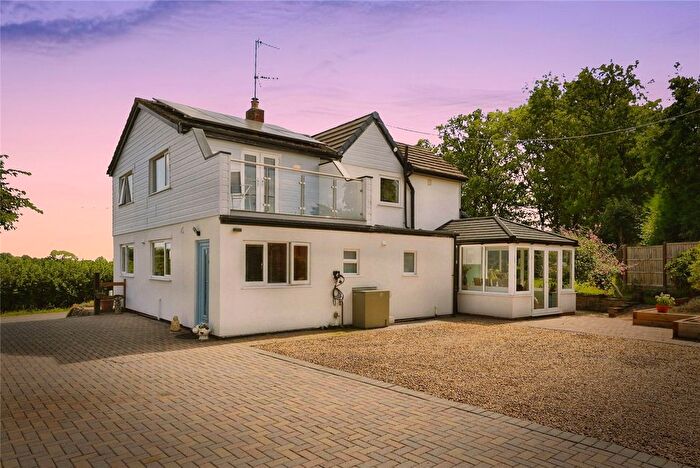
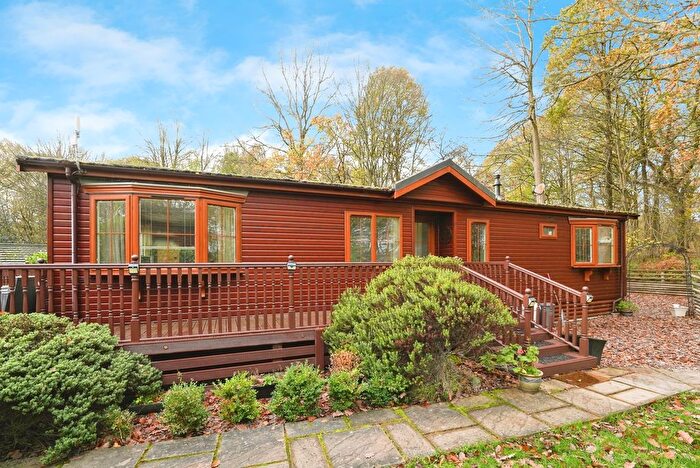
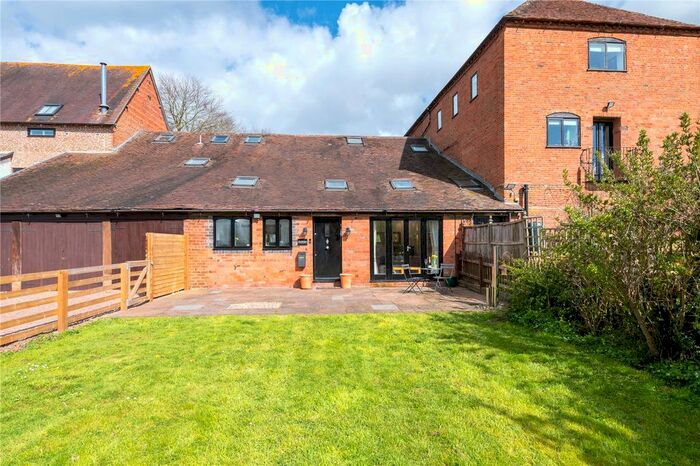
Properties for sale in Martley
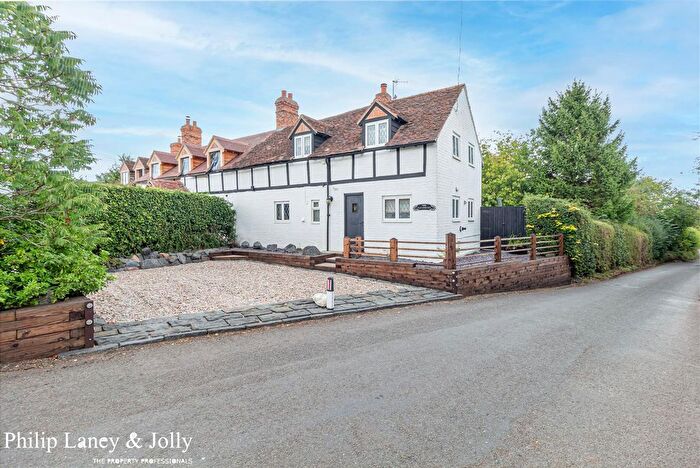
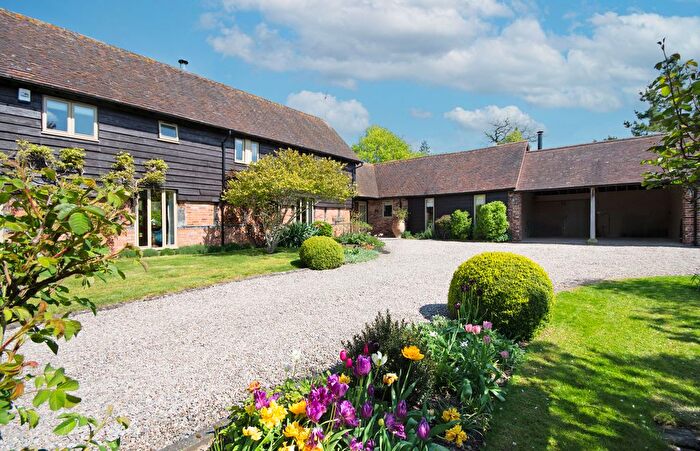
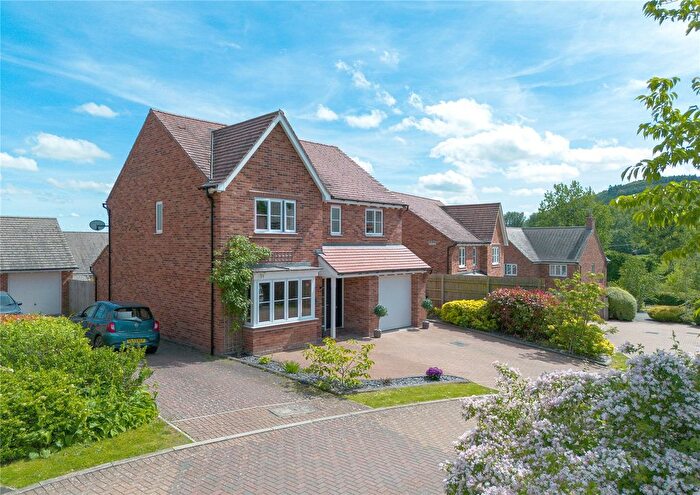
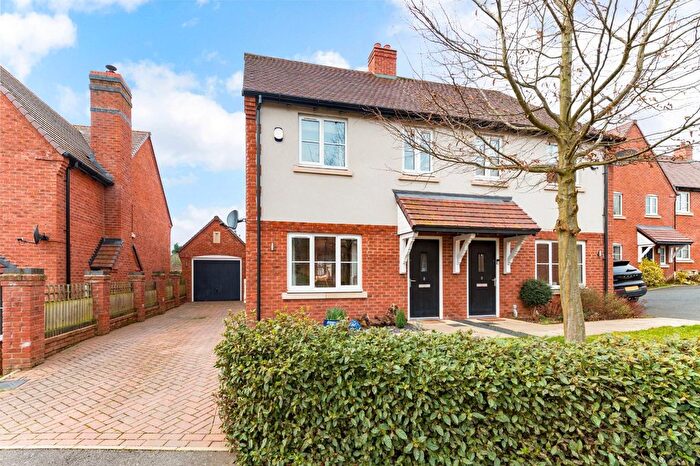
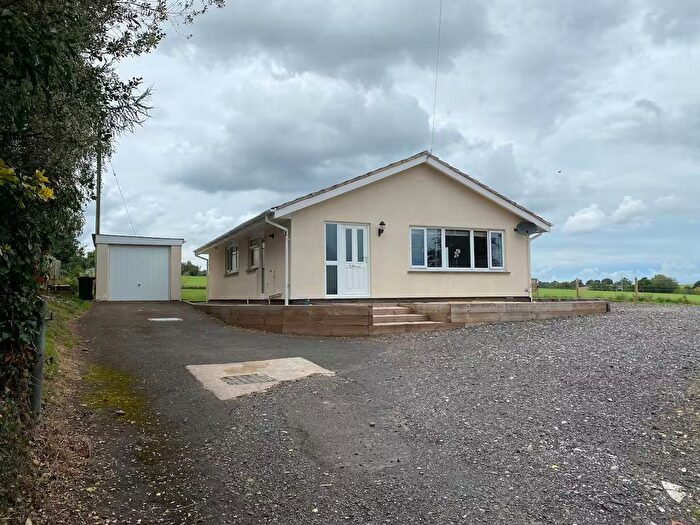
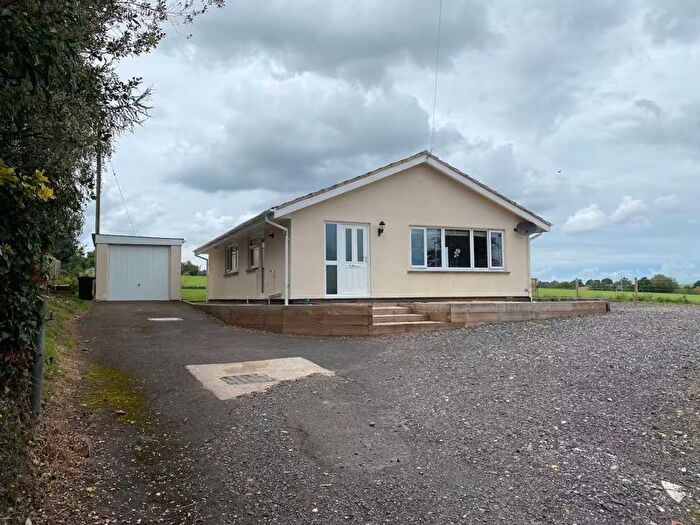
Previously listed properties in Martley
![]()
If you are looking to sell your house, let it out, or receive a property valuation, an expert can help you.
Click the button below to get started.
Roads and Postcodes in Martley
Navigate through our locations to find the location of your next house in Martley, Worcester for sale or to rent.
| Streets | Postcodes |
|---|---|
| Ankerdine Hill | WR6 5PR |
| Badger Close | WR6 6QY |
| Barbers Lane | WR6 6QD |
| Berrow Green | WR6 6PL WR6 6PP |
| Berrow Green Road | WR6 6PQ |
| Boxley Cottages | WR6 6YB |
| Castle Hill | WR6 6YA |
| Church Lane | WR6 6QE |
| Cobblers Corner | WR6 5NP |
| Collins Green | WR6 5PS WR6 5PT |
| Hastings Close | WR6 6TJ |
| Hawthorn Close | WR6 6NS |
| Hillside | WR6 6QN WR6 6QW |
| Hipplecote | WR6 6PW |
| Hockhams Lane | WR6 6QP |
| Hollins Lane | WR6 6PF WR6 6PH WR6 6PU |
| Hope House Lane | WR6 6QF |
| Horne Lane | WR6 6QH |
| Horsham | WR6 6PN |
| Jury Lane | WR6 6PE |
| Kenswick | WR2 6QB WR2 6QX |
| Kings Green | WR6 6YG |
| Kingswood | WR6 6PG |
| Lanthorne Close | WR6 6BJ |
| Laugherne Park | WR6 6RQ |
| Malvern View | WR6 6YY |
| Maple Cottages | WR6 6QA |
| Mistletoe Orchard | WR6 6RW |
| Mortlake Drive | WR6 6QU |
| Nash Close | WR6 6PY |
| Newtown | WR6 6PR |
| Peg Houses | WR6 5NT |
| Poplar Road | WR6 6YF |
| Prickley Green | WR6 6QQ |
| Pudford Lane | WR6 6QL |
| Quarry Lane | WR6 6QJ |
| Queens Estate | WR6 6YJ |
| Queensway | WR6 6YQ |
| Rosses Lane | WR6 6YU |
| Ryecroft Way | WR6 6BF |
| Sandpits Close | WR6 6PZ |
| Sledgemoor | WR6 5NR |
| St Peters Court | WR6 6AL |
| St Peters Drive | WR6 6PX WR6 6QZ |
| Tannery Close | WR6 6SD |
| The Bungalows | WR6 6PJ |
| The Kedges | WR6 6YE |
| Vernon Close | WR6 6QX |
| Wants Green | WR6 5NU |
| Willow Green | WR6 6PT |
| Willow Road | WR6 6PS |
| Witley Road | WR6 6PB |
| Witton Hill | WR6 6YX |
| WR6 6FA WR6 5NS WR6 6PA WR6 6PD WR6 6QB WR6 6QG WR6 6QR WR6 6QT WR6 6XY WR6 6YD WR6 6YL WR6 6YS WR6 6YT |
Property price trends in Martley
According to the latest Land Registry data, the average home in Martley sold for £476,181 in 2025. That figure comes from 736 sales logged over the past 30 years.
Prices have fallen back over the last three years. Compared with 2022, when the typical sale came in around £552,891, that's a fall of roughly 13.9%.
Looking back five years, average prices are up about 4.3% since 2020, a gain of around £19,603 in cash terms.
Zoom out to the past decade for the fuller picture. Back in 2015, homes here averaged £343,457, so the typical sold price has climbed about 38.6% since then, roughly 3.3% a year. Stretch the view to fifteen years and that annual pace eases back to about 2.4%.
Frequently asked questions about Martley
What is the average price for a property for sale in Martley?
The average price for a property for sale in Martley is £473,629. This amount is 52% higher than the average price in Worcester. There are 84 property listings for sale in Martley.
What streets have the most expensive properties for sale in Martley?
The streets with the most expensive properties for sale in Martley are Sledgemoor at an average of £1,400,000, Boxley Cottages at an average of £772,500 and Hipplecote at an average of £770,000.
What streets have the most affordable properties for sale in Martley?
The streets with the most affordable properties for sale in Martley are Nash Close at an average of £200,000, Berrow Green at an average of £207,000 and Queens Estate at an average of £250,000.
Which train stations are available in or near Martley?
Some of the train stations available in or near Martley are Worcester Foregate Street, Worcester Shrub Hill and Malvern Link.
Property Price Paid in Martley by Year
The average sold property price by year was:
| Year | Average Sold Price | Price Change |
Sold Properties
|
|---|---|---|---|
| 2025 | £476,181 | 1% |
22 Properties |
| 2024 | £472,735 | 0,3% |
17 Properties |
| 2023 | £471,473 | -17% |
19 Properties |
| 2022 | £552,891 | 8% |
12 Properties |
| 2021 | £509,592 | 10% |
35 Properties |
| 2020 | £456,578 | 17% |
19 Properties |
| 2019 | £377,780 | 7% |
31 Properties |
| 2018 | £350,219 | 9% |
18 Properties |
| 2017 | £317,108 | -17% |
31 Properties |
| 2016 | £370,329 | 7% |
48 Properties |
Property Price per Property Type in Martley
Here you can find historic sold price data in order to help with your property search.
The average Property Paid Price for specific property types in the last three years are:
| Property Type | Average Sold Price | Sold Properties |
|---|---|---|
| Semi Detached House | £325,750.00 | 12 Semi Detached Houses |
| Detached House | £542,162.00 | 40 Detached Houses |
| Terraced House | £335,000.00 | 4 Terraced Houses |
| Flat | £267,500.00 | 2 Flats |
