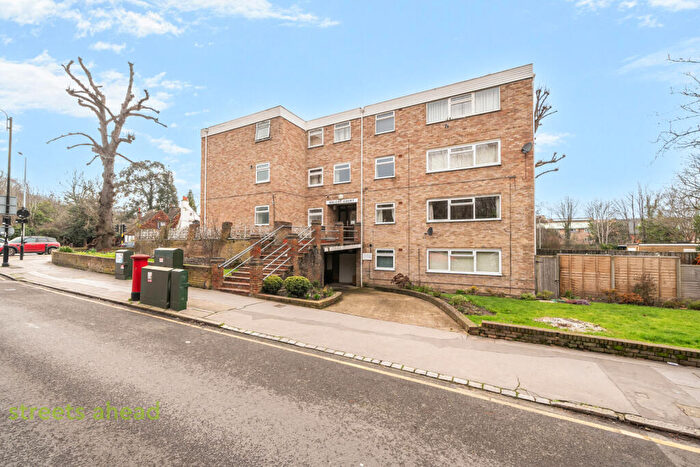
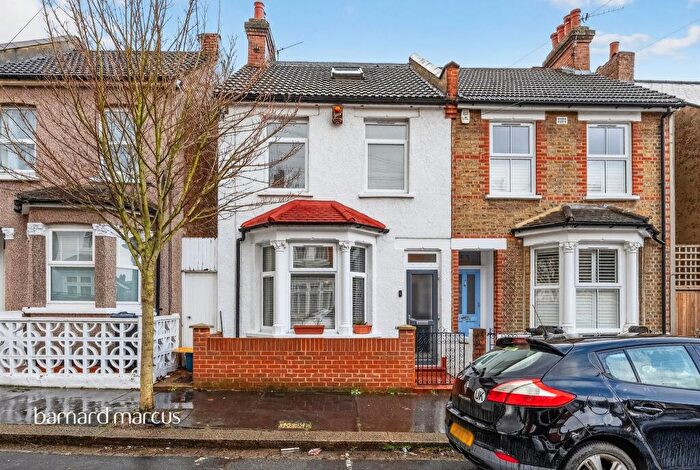
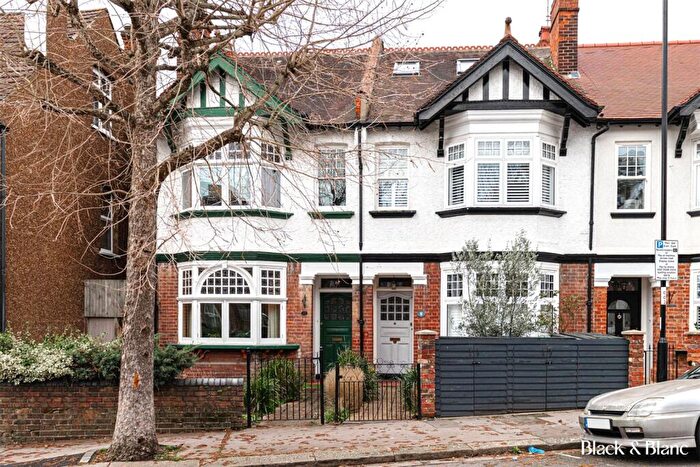
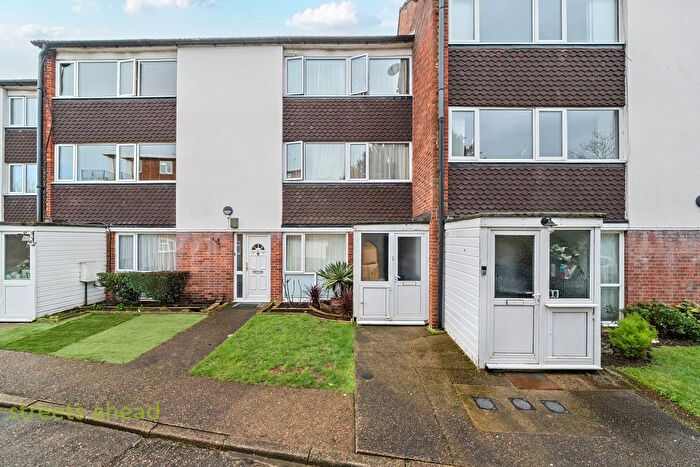
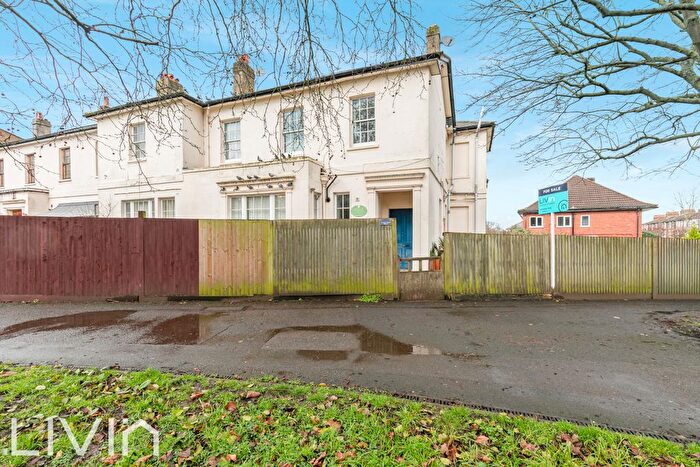
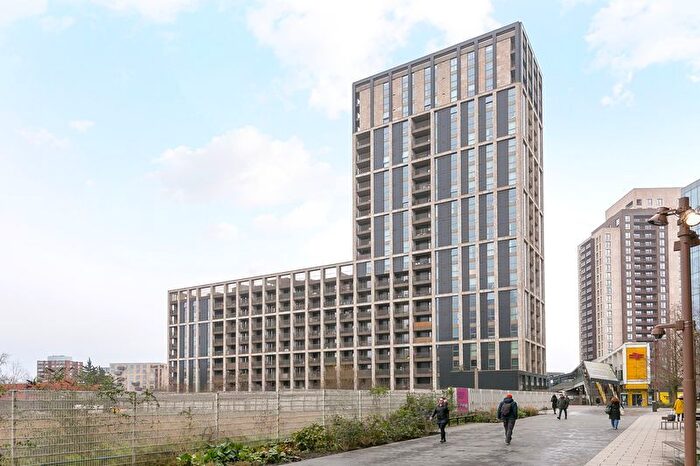
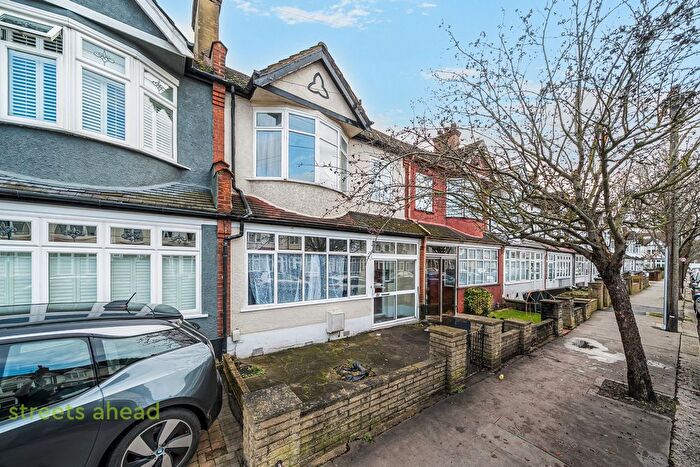
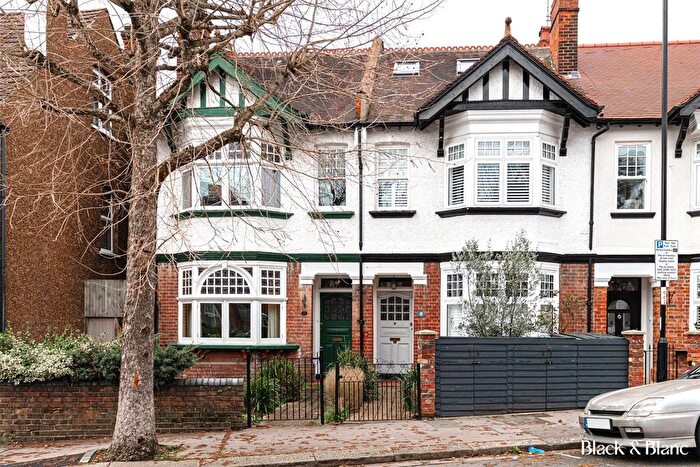
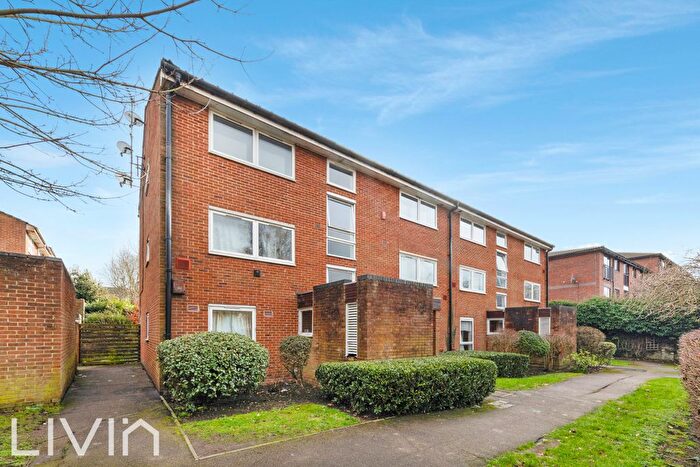
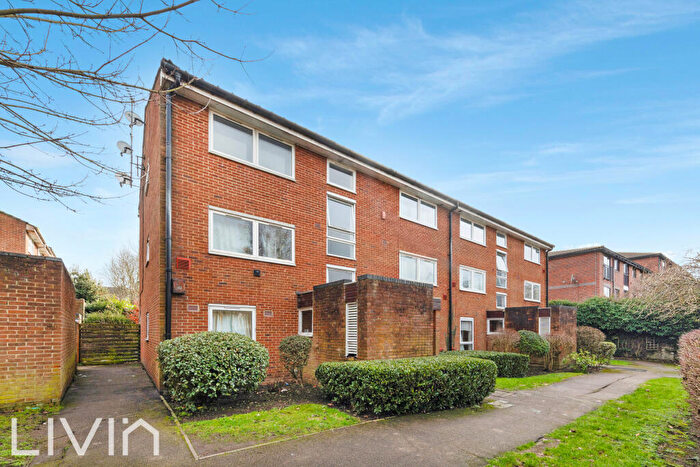
Houses for sale & to rent in Addiscombe, Croydon
House Prices in Addiscombe
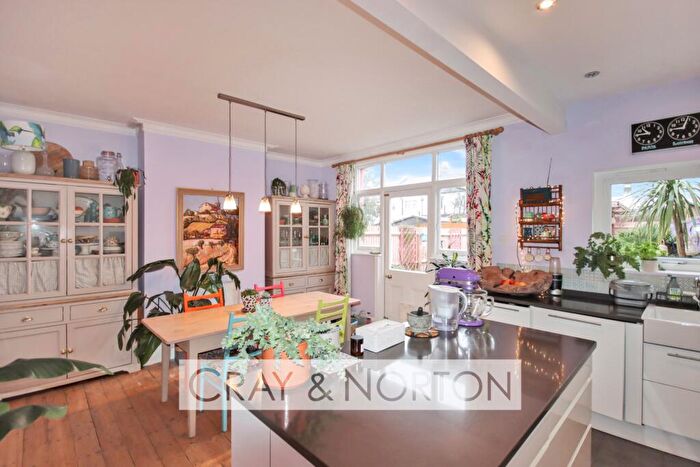
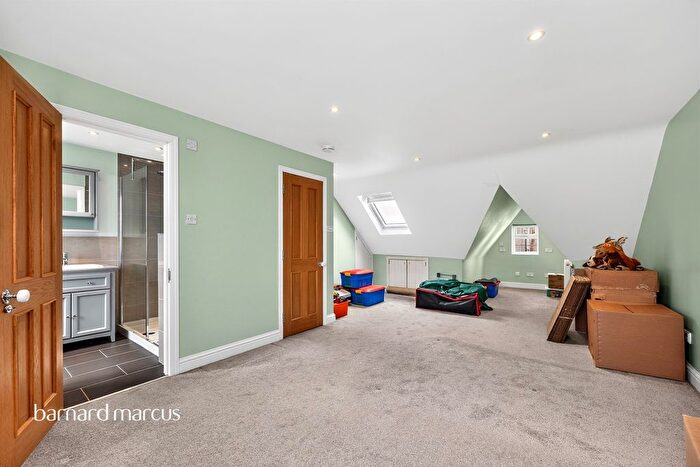
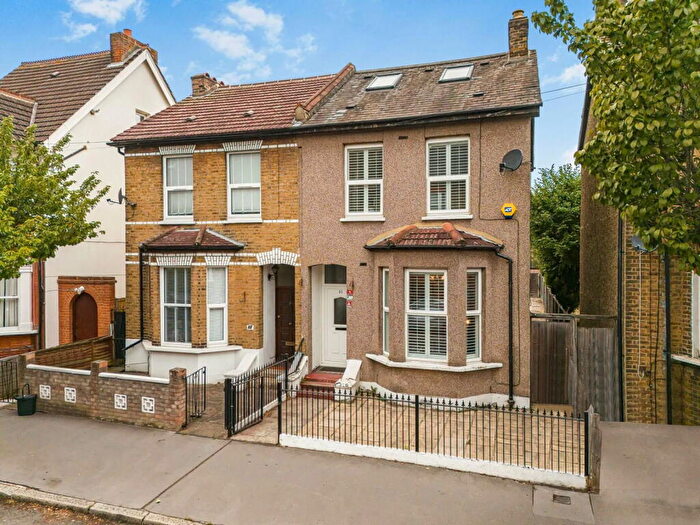
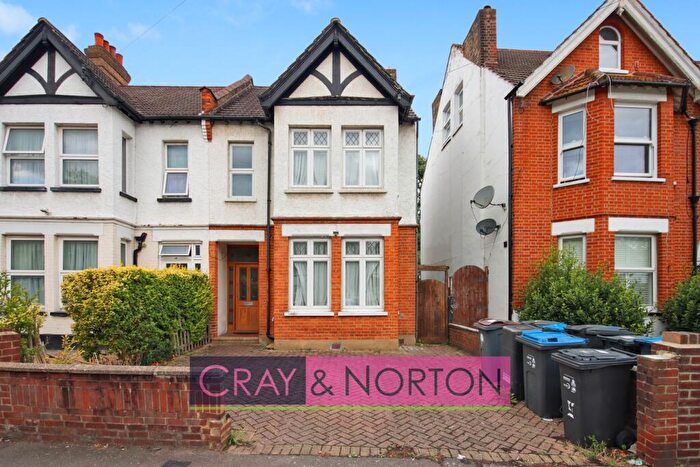
Properties in this part of Addiscombe within Croydon have an average house price of £379,332.00 and had 648 Property Transactions within the last 3 years¹. This area has 7,334 households² , where the most expensive property was sold for £1,010,000.00.
Properties for sale in Addiscombe
Roads and Postcodes in Addiscombe
Navigate through our locations to find the location of your next house in Addiscombe, Croydon for sale or to rent.
Transport near Addiscombe
-
Addiscombe Station
-
Lebanon Road Station
-
Sandilands Station
-
East Croydon Station
-
Blackhorse Lane Station
-
Wellesley Road Station
-
Woodside Station
-
Selhurst Station
-
George Street Station
-
West Croydon Station
- FAQ
- Price Paid By Year
- Property Type Price
Frequently asked questions about Addiscombe
What is the average price for a property for sale in Addiscombe?
The average price for a property for sale in Addiscombe is £379,332. This amount is 0.28% lower than the average price in Croydon. There are 4,605 property listings for sale in Addiscombe.
What streets have the most expensive properties for sale in Addiscombe?
The streets with the most expensive properties for sale in Addiscombe are Bisenden Road at an average of £650,000, Inglis Road at an average of £544,400 and Camborne Road at an average of £543,750.
What streets have the most affordable properties for sale in Addiscombe?
The streets with the most affordable properties for sale in Addiscombe are Burnham Gardens at an average of £245,333, Cherry Orchard Road at an average of £258,316 and Hastings Road at an average of £263,166.
Which train stations are available in or near Addiscombe?
Some of the train stations available in or near Addiscombe are East Croydon, Selhurst and West Croydon.
Property Price Paid in Addiscombe by Year
The average sold property price by year was:
| Year | Average Sold Price | Price Change |
Sold Properties
|
|---|---|---|---|
| 2025 | £391,991 | 4% |
209 Properties |
| 2024 | £377,424 | 2% |
238 Properties |
| 2023 | £368,428 | -3% |
201 Properties |
| 2022 | £378,249 | 4% |
262 Properties |
| 2021 | £362,454 | -4% |
387 Properties |
| 2020 | £377,311 | 7% |
204 Properties |
| 2019 | £349,571 | -7% |
230 Properties |
| 2018 | £374,176 | 6% |
204 Properties |
| 2017 | £350,154 | -1% |
214 Properties |
| 2016 | £352,353 | 16% |
254 Properties |
| 2015 | £296,901 | 12% |
340 Properties |
| 2014 | £260,856 | 14% |
330 Properties |
| 2013 | £223,674 | 4% |
243 Properties |
| 2012 | £215,527 | 0,4% |
195 Properties |
| 2011 | £214,569 | 1% |
202 Properties |
| 2010 | £212,677 | 7% |
191 Properties |
| 2009 | £198,107 | -14% |
209 Properties |
| 2008 | £225,670 | 1% |
216 Properties |
| 2007 | £224,383 | 11% |
475 Properties |
| 2006 | £199,548 | 2% |
496 Properties |
| 2005 | £194,719 | 3% |
395 Properties |
| 2004 | £188,869 | 5% |
465 Properties |
| 2003 | £178,891 | 14% |
509 Properties |
| 2002 | £153,004 | 20% |
507 Properties |
| 2001 | £122,429 | 14% |
383 Properties |
| 2000 | £104,685 | 17% |
358 Properties |
| 1999 | £87,135 | 17% |
523 Properties |
| 1998 | £72,673 | 11% |
447 Properties |
| 1997 | £64,958 | 12% |
469 Properties |
| 1996 | £56,882 | -2% |
396 Properties |
| 1995 | £58,123 | - |
325 Properties |
Property Price per Property Type in Addiscombe
Here you can find historic sold price data in order to help with your property search.
The average Property Paid Price for specific property types in the last three years are:
| Property Type | Average Sold Price | Sold Properties |
|---|---|---|
| Flat | £266,416.00 | 241 Flats |
| Semi Detached House | £490,646.00 | 65 Semi Detached Houses |
| Detached House | £674,178.00 | 14 Detached Houses |
| Terraced House | £427,654.00 | 328 Terraced Houses |

