
Houses for sale & to rent in Croydon, Croydon London Borough
House Prices in Croydon
Properties in this part of Croydon within the Croydon London Borough have an average house price of £381k and had 4,602 Property Transactions within the last 3 years.¹ This area has 60,171 households² , where the most expensive property was sold for £3M.
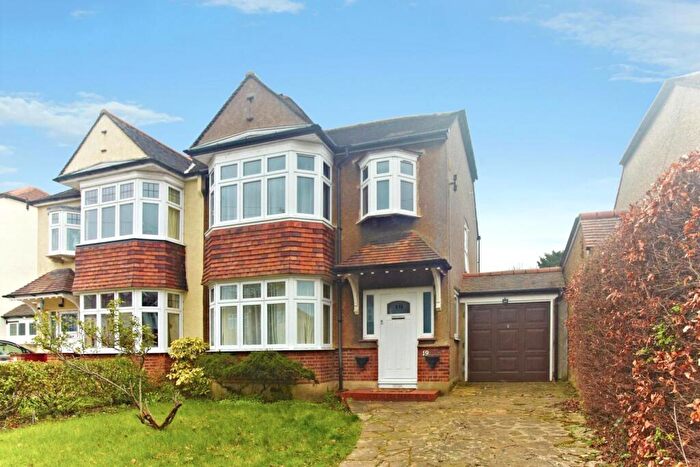
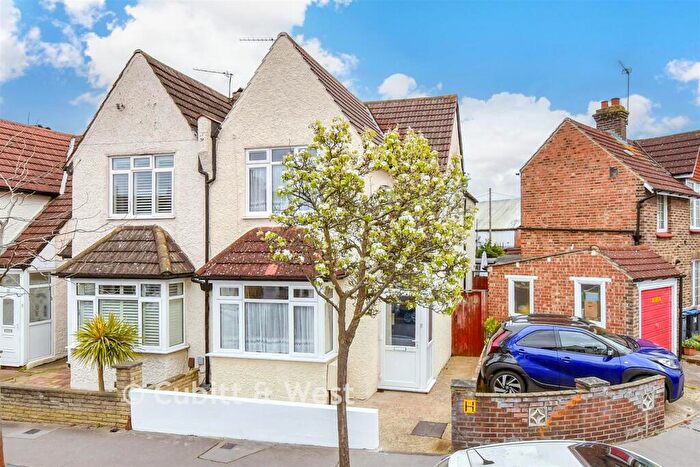
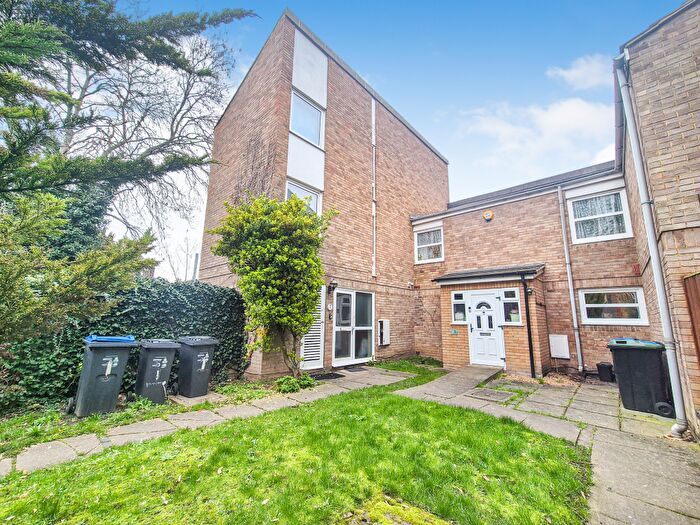
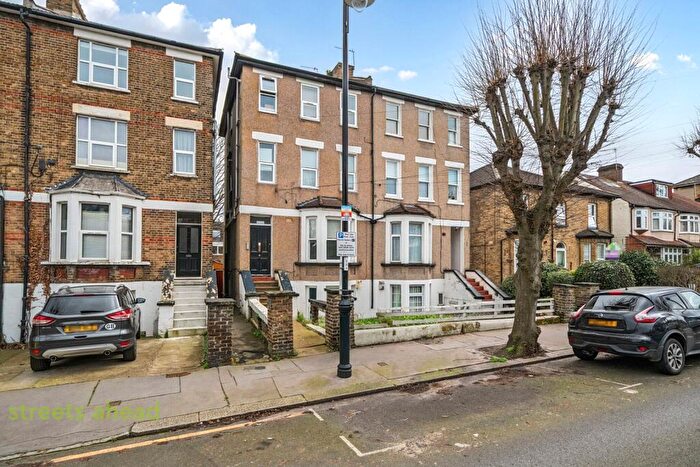
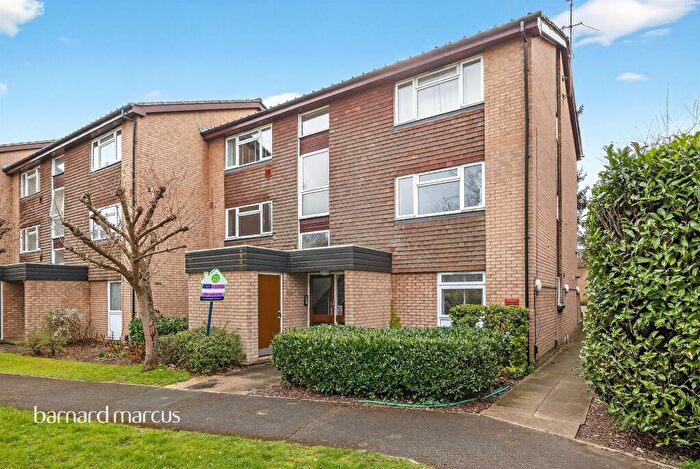
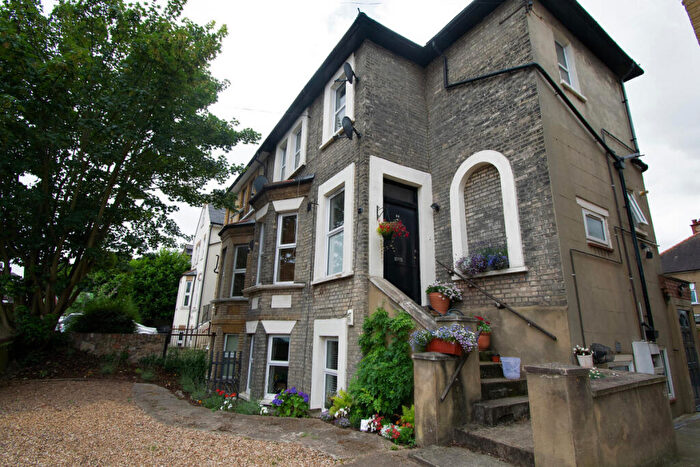
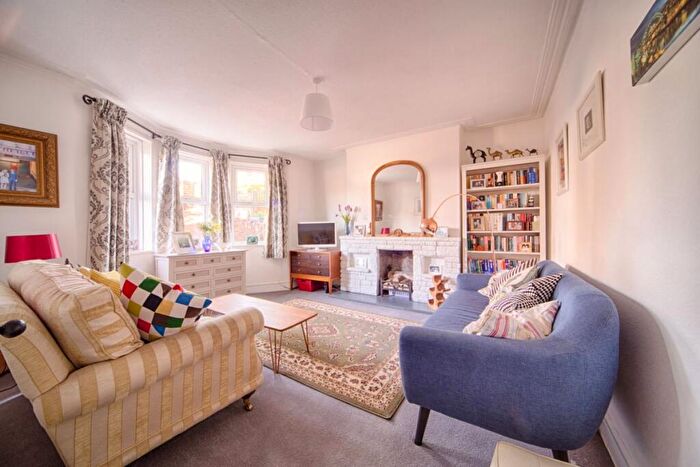
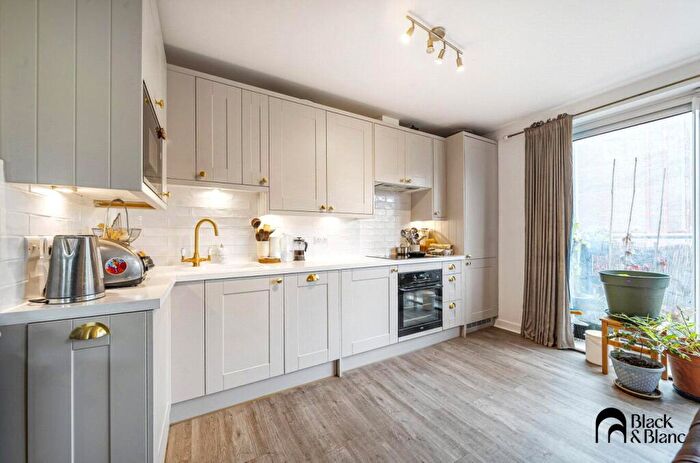
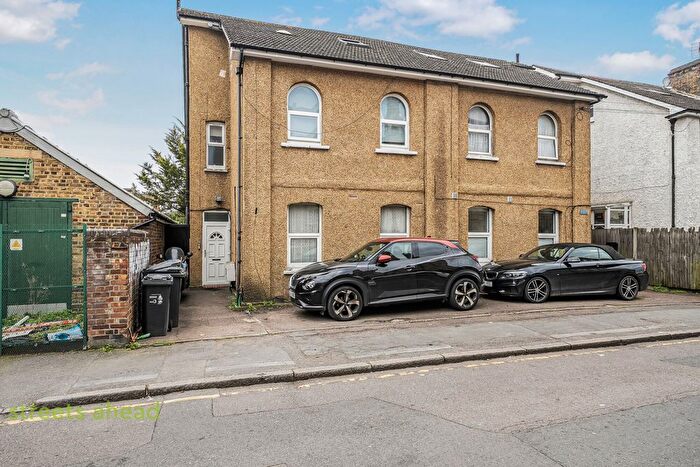
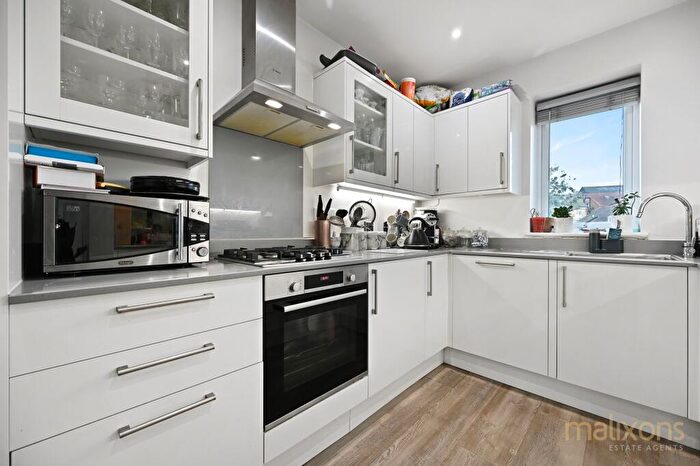
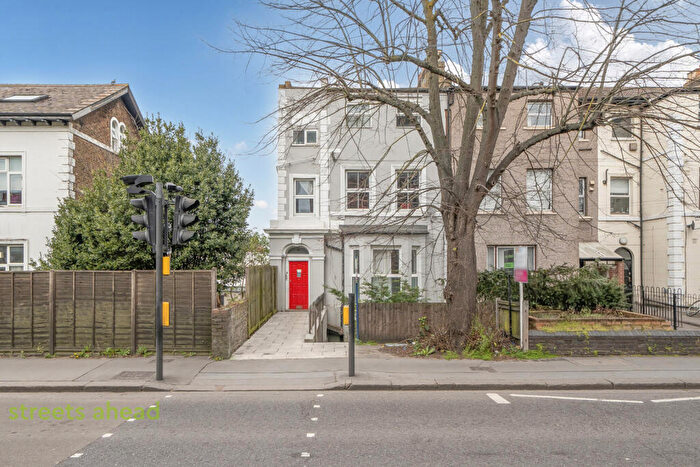
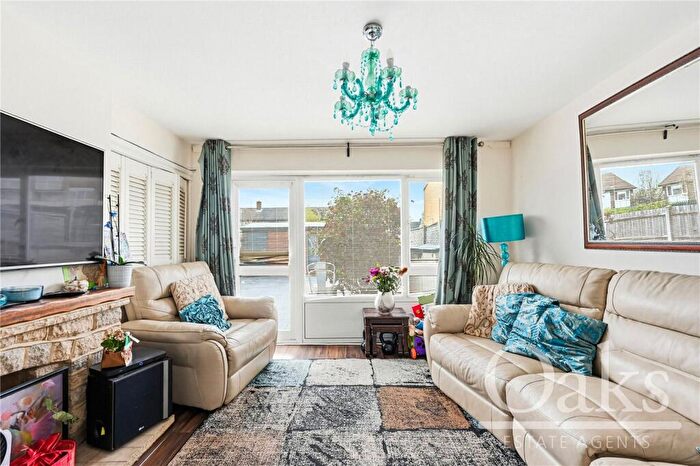
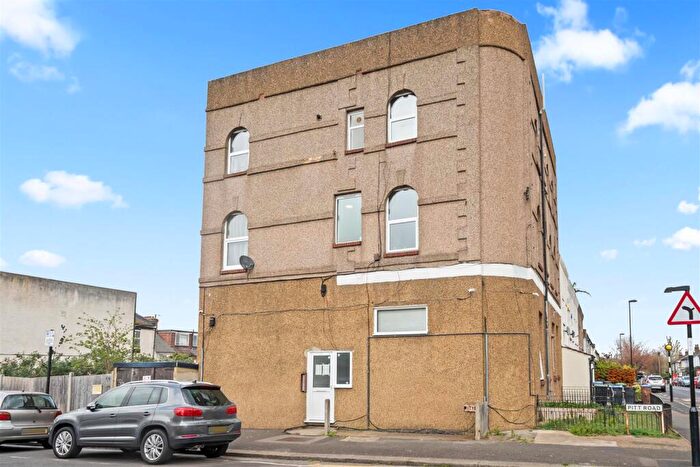
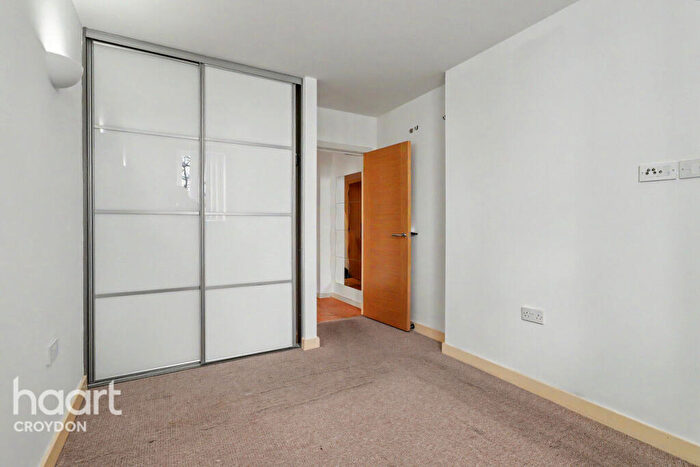
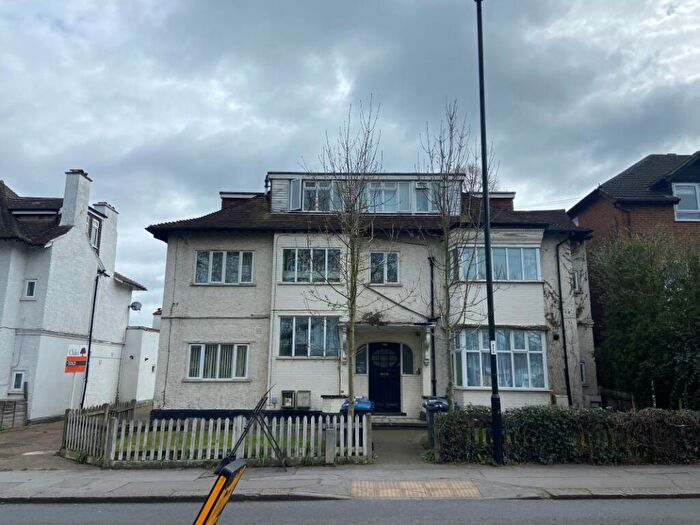
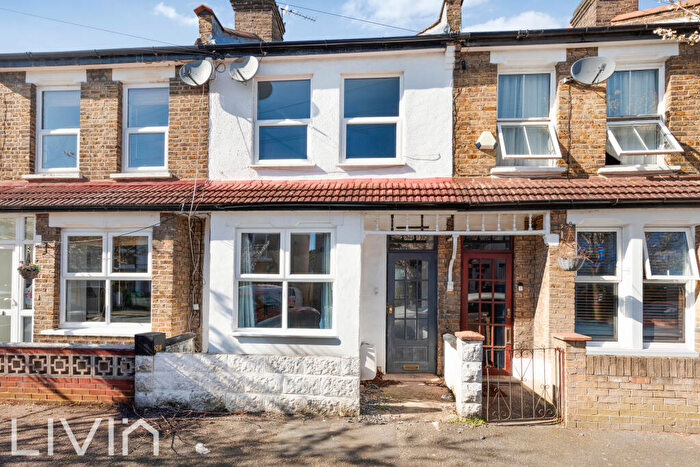
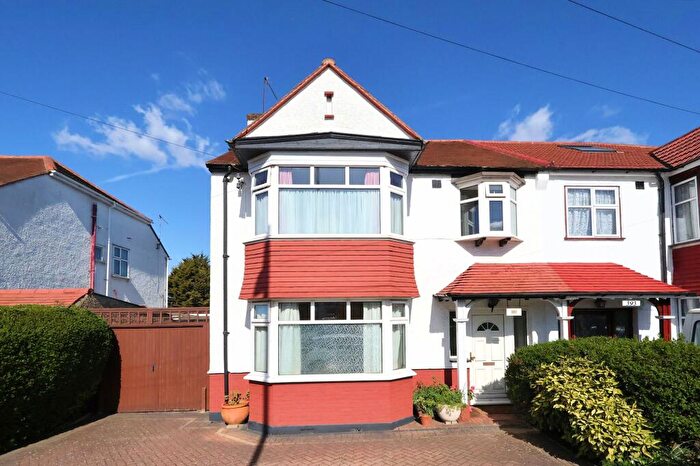
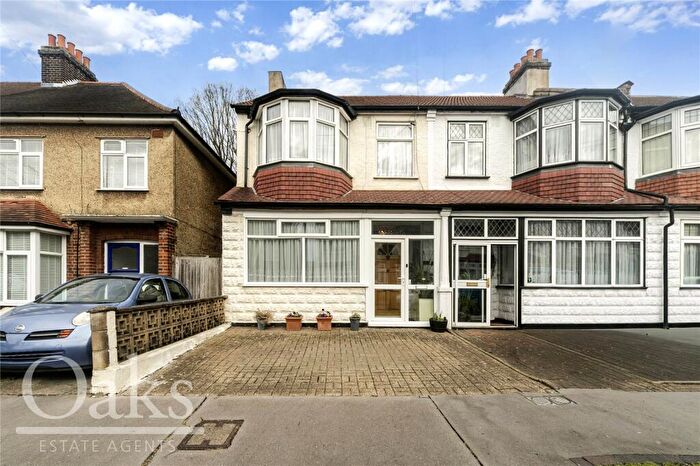
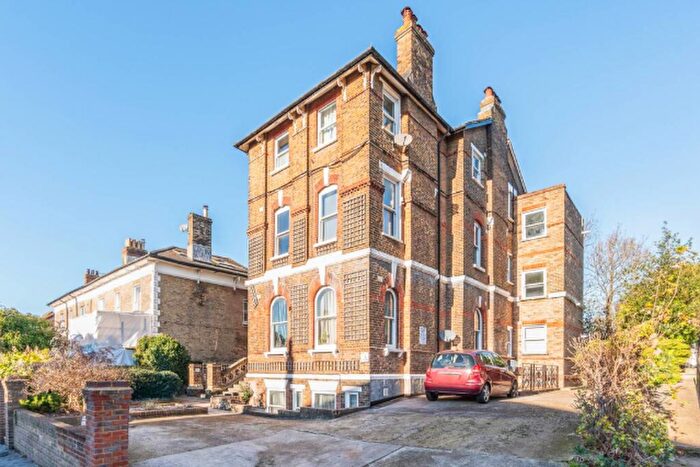
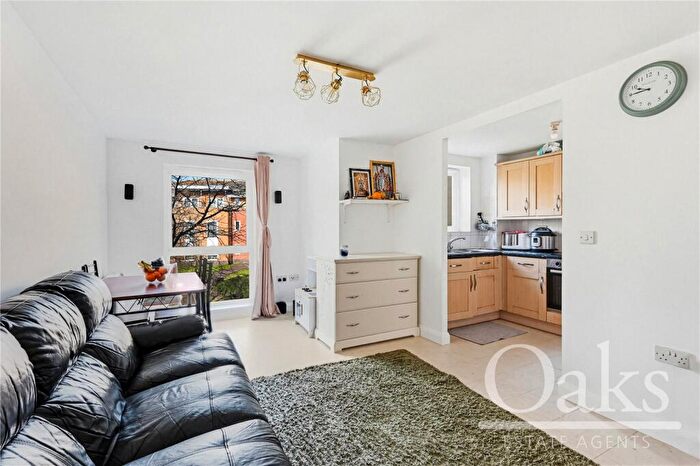
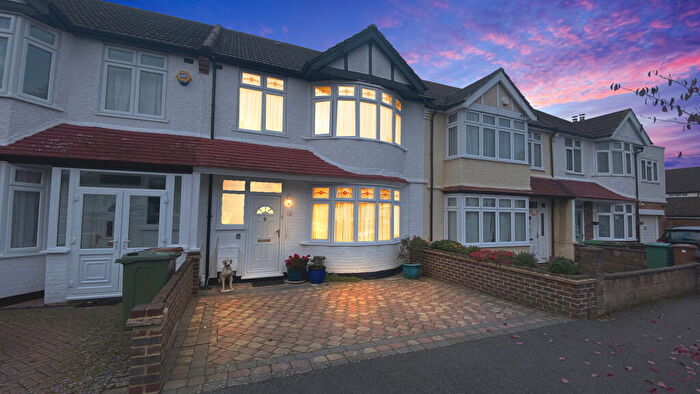
Properties for sale in Croydon
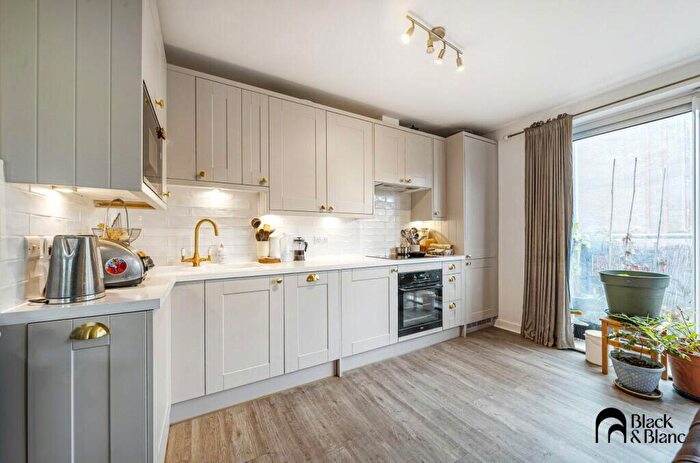
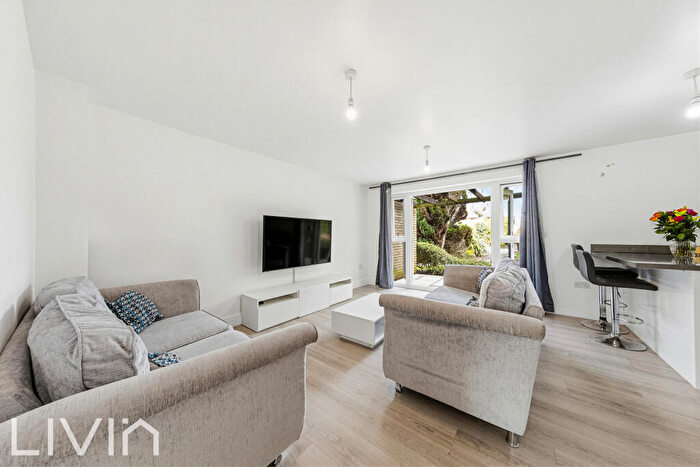
![]()
If you are looking to sell your house, let it out, or receive a property valuation, an expert can help you.
Click the button below to get started.
Neighbourhoods in Croydon
Navigate through our locations to find the location of your next house in Croydon, Croydon London Borough for sale or to rent.
- Addiscombe
- Ashburton
- Bensham Manor
- Broad Green
- Croham
- Fairfield
- Fieldway
- Heathfield
- New Addington
- Selhurst
- Selsdon And Ballards
- Shirley
- Waddon
- West Thornton
- Woodside
- New Addington South
- New Addington North
- Addiscombe West
- South Croydon
- Park Hill & Whitgift
- Selsdon & Addington Village
- Addiscombe East
- Shirley North
- Selsdon Vale & Forestdale
- Shirley South
Transport in Croydon
Please see below transportation links in this area:
-
 Sandilands Station
 -
Lebanon Road Station
-
Addiscombe Station
-
 East Croydon Station
 -
Lloyd Park Station
-
Blackhorse Lane Station
-
Wellesley Road Station
-
George Street Station
-
South Croydon Station
-
Woodside Station
- FAQ
- Price Paid By Year
- Property Type Price
Frequently asked questions about Croydon
What is the average price for a property for sale in Croydon?
The average price for a property for sale in Croydon is £381,114. This amount is 13% lower than the average price in Croydon London Borough. There are more than 10,000 property listings for sale in Croydon.
What locations have the most expensive properties for sale in Croydon?
The locations with the most expensive properties for sale in Croydon are Selsdon And Ballards at an average of £663,333, Shirley South at an average of £535,000 and Ashburton at an average of £481,271.
What locations have the most affordable properties for sale in Croydon?
The locations with the most affordable properties for sale in Croydon are New Addington South at an average of £200,333, South Croydon at an average of £205,000 and New Addington North at an average of £235,000.
Which train stations are available in or near Croydon?
Some of the train stations available in or near Croydon are East Croydon and South Croydon.
Property Price Paid in Croydon by Year
The average sold property price by year was:
| Year | Average Sold Price | Price Change |
Sold Properties
|
|---|---|---|---|
| 2026 | £458,645 | 15% |
36 Properties |
| 2025 | £388,460 | 3% |
1,472 Properties |
| 2024 | £375,588 | -1% |
1,680 Properties |
| 2023 | £378,057 | -5% |
1,414 Properties |
| 2022 | £396,919 | 3% |
1,946 Properties |
| 2021 | £383,096 | 2% |
2,433 Properties |
| 2020 | £374,481 | 4% |
1,539 Properties |
| 2019 | £357,746 | -2% |
1,936 Properties |
| 2018 | £364,145 | 2% |
1,937 Properties |
| 2017 | £356,834 | 9% |
2,463 Properties |
| 2016 | £326,013 | 10% |
2,513 Properties |
| 2015 | £294,553 | 9% |
2,580 Properties |
| 2014 | £266,805 | 12% |
2,429 Properties |
| 2013 | £234,184 | 3% |
1,948 Properties |
| 2012 | £227,100 | 3% |
1,325 Properties |
| 2011 | £219,887 | -2% |
1,347 Properties |
| 2010 | £223,990 | 9% |
1,458 Properties |
| 2009 | £203,154 | -14% |
1,463 Properties |
| 2008 | £230,712 | 1% |
1,515 Properties |
| 2007 | £227,347 | 7% |
3,241 Properties |
| 2006 | £211,080 | 4% |
3,106 Properties |
| 2005 | £201,817 | 5% |
2,450 Properties |
| 2004 | £191,849 | 5% |
2,801 Properties |
| 2003 | £182,278 | 13% |
2,826 Properties |
| 2002 | £159,042 | 19% |
3,292 Properties |
| 2001 | £129,407 | 13% |
2,182 Properties |
| 2000 | £112,332 | 14% |
1,901 Properties |
| 1999 | £96,307 | 12% |
3,057 Properties |
| 1998 | £85,108 | 12% |
2,997 Properties |
| 1997 | £74,588 | 9% |
2,858 Properties |
| 1996 | £67,931 | 5% |
2,452 Properties |
| 1995 | £64,577 | - |
1,952 Properties |
Property Price per Property Type in Croydon
Here you can find historic sold price data in order to help with your property search.
The average Property Paid Price for specific property types in the last three years are:
| Property Type | Average Sold Price | Sold Properties |
|---|---|---|
| Semi Detached House | £491,736.00 | 850 Semi Detached Houses |
| Terraced House | £406,077.00 | 1,741 Terraced Houses |
| Detached House | £728,456.00 | 206 Detached Houses |
| Flat | £265,301.00 | 1,805 Flats |