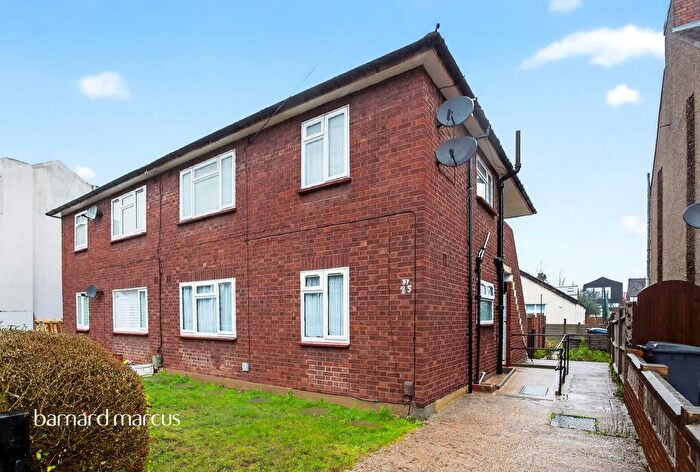
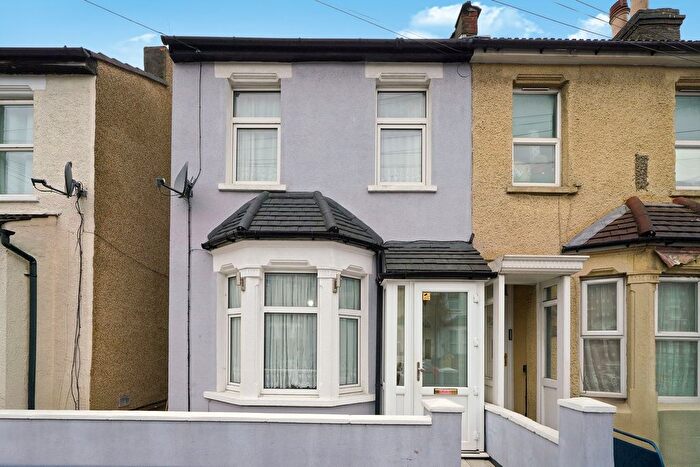
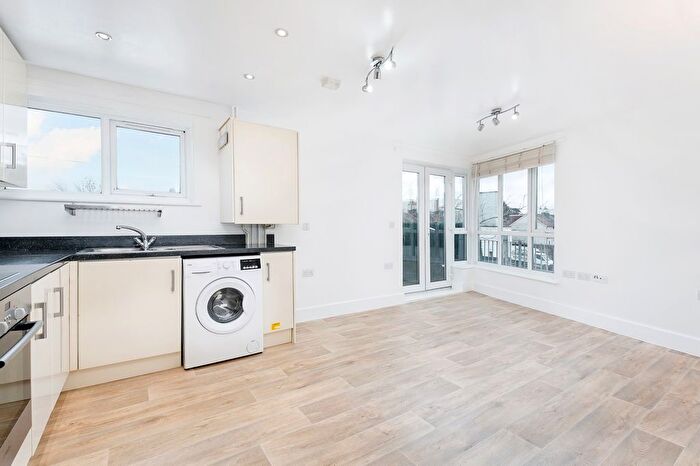
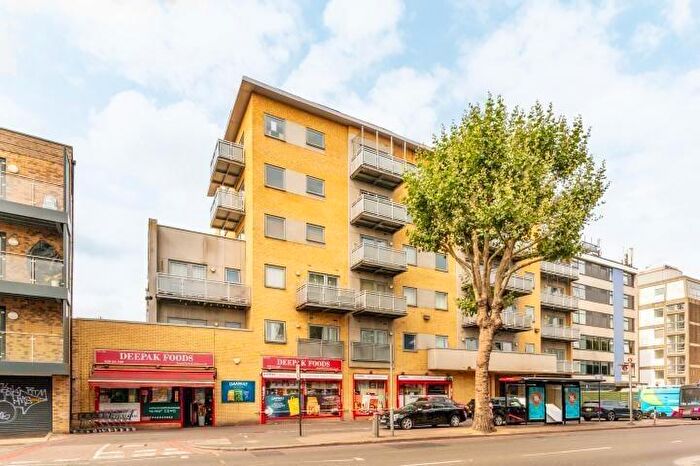
Houses for sale & to rent in West Thornton, Croydon
House Prices in West Thornton
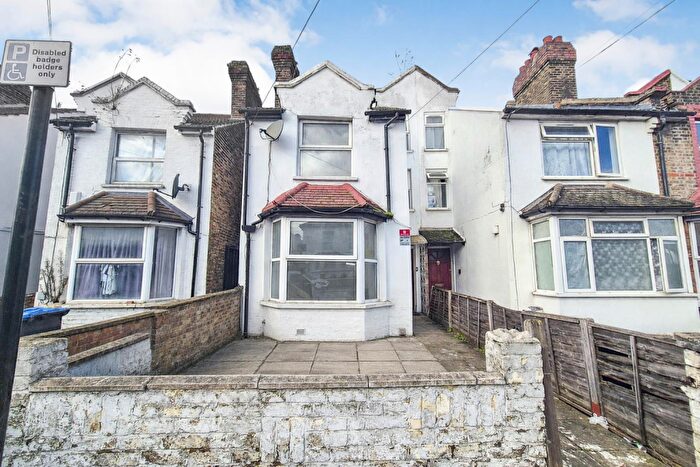
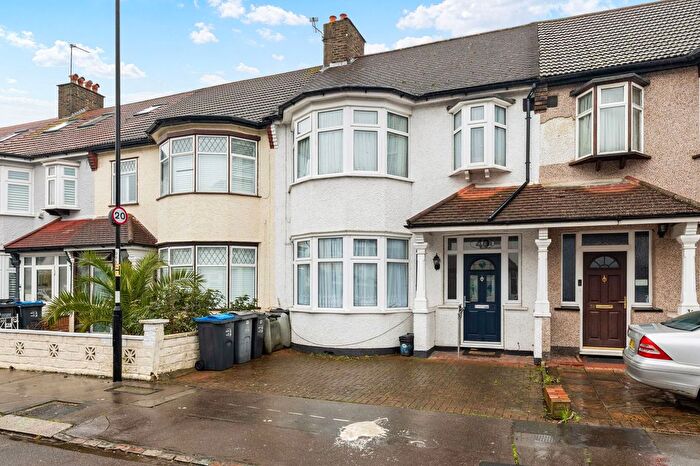
Properties in this part of West Thornton within Croydon have an average house price of £342,788.00 and had 142 Property Transactions within the last 3 years¹. This area has 2,173 households² , where the most expensive property was sold for £1,100,000.00.
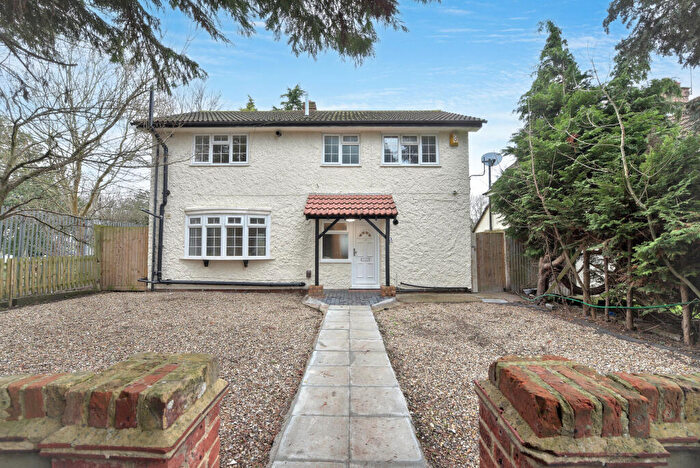
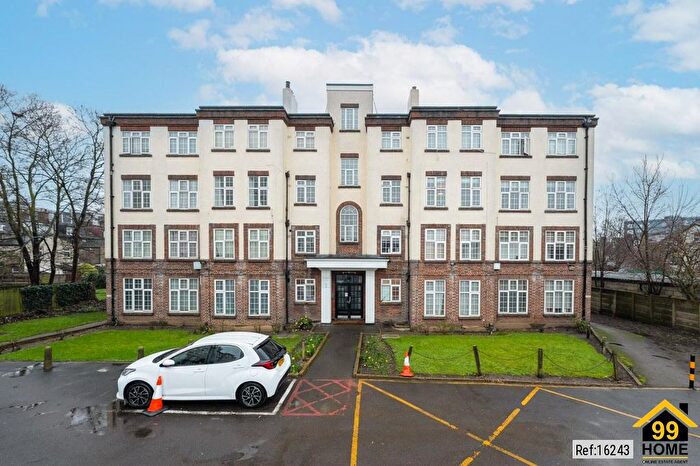
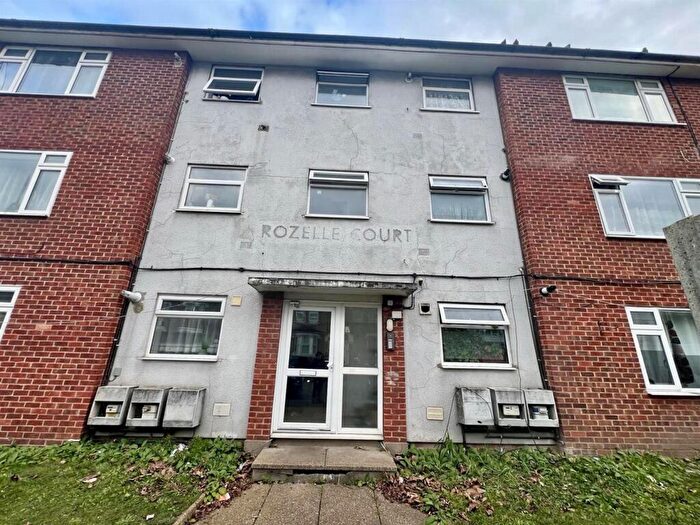
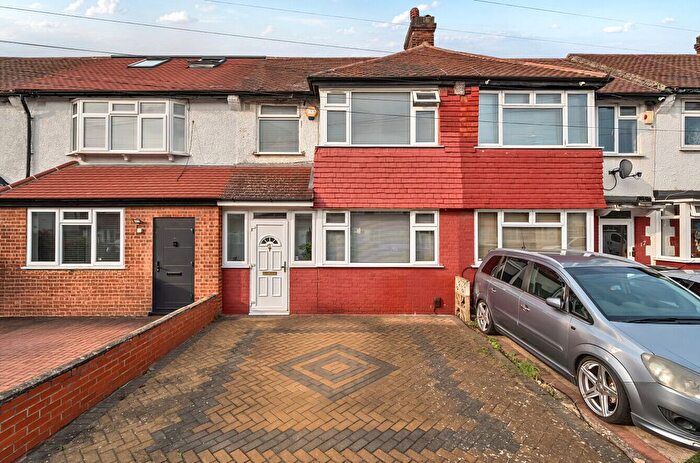
Properties for sale in West Thornton
Roads and Postcodes in West Thornton
Navigate through our locations to find the location of your next house in West Thornton, Croydon for sale or to rent.
| Streets | Postcodes |
|---|---|
| Aurelia Gardens | CR0 3BD |
| Aurelia Road | CR0 3BA CR0 3BB CR0 3BE CR0 3BF |
| Beddington Terrace | CR0 3HG |
| Bensham Lane | CR0 2RX CR0 2RZ |
| Boston Road | CR0 3ED CR0 3EE CR0 3EF CR0 3EG CR0 3EH CR0 3EJ |
| Brading Road | CR0 3BR |
| Cameron Road | CR0 2SR |
| Campbell Road | CR0 2SP CR0 2SQ CR0 2YF |
| Canterbury Road | CR0 3HA CR0 3HD CR0 3HE CR0 3HF CR0 3PU CR0 3PW |
| Cecil Road | CR0 3BG CR0 3BJ CR0 3BL CR0 3BN CR0 3BP CR0 3BQ |
| Donald Road | CR0 3EP CR0 3EQ |
| Frederick Gardens | CR0 2PP |
| Furtherfield Close | CR0 3DZ |
| Lancing Road | CR0 3EL CR0 3EN |
| Lavender Road | CR0 3BH |
| Lodge Road | CR0 2PF CR0 2PH |
| London Road | CR0 2SS CR0 3PF CR0 9BH CR0 9BJ |
| Lynton Road | CR0 3QX |
| Marden Crescent | CR0 3ER CR0 3ES |
| Marden Road | CR0 3ET |
| Mitcham Road | CR0 3AA CR0 3AB CR0 3AZ CR9 3AS CR9 3AT CR0 3FP |
| Moys Close | CR0 3AX |
| Oakwood Place | CR0 3US |
| Oakwood Road | CR0 3QS |
| Peall Road | CR0 3BX CR0 3EX |
| Peall Road Industrial Estate | CR0 3BT |
| Queens Road | CR0 2PX |
| Rosecourt Road | CR0 3BS |
| Songhurst Close | CR0 3RQ |
| Southwell Road | CR0 3QD |
| Stanley Grove | CR0 3QU CR0 3QW |
| Stanley Road | CR0 3QA CR0 3QB CR0 3QE CR0 3QF |
| Tankerton Terrace | CR0 3HJ CR0 3HL |
| Thornton Avenue | CR0 3BU CR0 3BW |
| Thornton Road | CR0 3EU CR0 3EW CR0 3EY CR0 3EZ |
| Wingate Crescent | CR0 3AL CR0 3AN CR0 3AP |
| Wortley Road | CR0 3EA CR0 3EB |
| York Road | CR0 3QT |
Transport near West Thornton
-
Ampere Way Station
-
Therapia Lane Station
-
Waddon Marsh Station
-
West Croydon Station
-
Beddington Lane Station
-
Reeves Corner Station
-
Wandle Park Station
-
Centrale Station
-
Thornton Heath Station
-
Church Street Station
- FAQ
- Price Paid By Year
- Property Type Price
Frequently asked questions about West Thornton
What is the average price for a property for sale in West Thornton?
The average price for a property for sale in West Thornton is £342,788. This amount is 10% lower than the average price in Croydon. There are 2,568 property listings for sale in West Thornton.
What streets have the most expensive properties for sale in West Thornton?
The streets with the most expensive properties for sale in West Thornton are Lavender Road at an average of £483,333, Canterbury Road at an average of £441,702 and Brading Road at an average of £420,000.
What streets have the most affordable properties for sale in West Thornton?
The streets with the most affordable properties for sale in West Thornton are Campbell Road at an average of £181,562, Donald Road at an average of £265,125 and Cameron Road at an average of £288,692.
Which train stations are available in or near West Thornton?
Some of the train stations available in or near West Thornton are West Croydon and Thornton Heath.
Property Price Paid in West Thornton by Year
The average sold property price by year was:
| Year | Average Sold Price | Price Change |
Sold Properties
|
|---|---|---|---|
| 2025 | £340,806 | -4% |
41 Properties |
| 2024 | £353,070 | 5% |
49 Properties |
| 2023 | £334,663 | -8% |
52 Properties |
| 2022 | £361,359 | 11% |
66 Properties |
| 2021 | £319,862 | 4% |
65 Properties |
| 2020 | £306,385 | -4% |
53 Properties |
| 2019 | £319,407 | -1% |
54 Properties |
| 2018 | £323,140 | 9% |
57 Properties |
| 2017 | £292,957 | -2% |
59 Properties |
| 2016 | £298,734 | 17% |
71 Properties |
| 2015 | £248,837 | 10% |
76 Properties |
| 2014 | £223,403 | 11% |
66 Properties |
| 2013 | £197,906 | 13% |
49 Properties |
| 2012 | £172,228 | 2% |
36 Properties |
| 2011 | £168,153 | -5% |
46 Properties |
| 2010 | £177,121 | 4% |
47 Properties |
| 2009 | £170,244 | -18% |
47 Properties |
| 2008 | £201,309 | 2% |
66 Properties |
| 2007 | £197,087 | 8% |
133 Properties |
| 2006 | £180,765 | 5% |
119 Properties |
| 2005 | £172,336 | 2% |
114 Properties |
| 2004 | £168,118 | 7% |
129 Properties |
| 2003 | £156,271 | 16% |
113 Properties |
| 2002 | £130,601 | 20% |
132 Properties |
| 2001 | £104,478 | 11% |
106 Properties |
| 2000 | £93,060 | 19% |
86 Properties |
| 1999 | £75,823 | 11% |
139 Properties |
| 1998 | £67,503 | 15% |
133 Properties |
| 1997 | £57,179 | 7% |
120 Properties |
| 1996 | £53,016 | 6% |
85 Properties |
| 1995 | £49,701 | - |
89 Properties |
Property Price per Property Type in West Thornton
Here you can find historic sold price data in order to help with your property search.
The average Property Paid Price for specific property types in the last three years are:
| Property Type | Average Sold Price | Sold Properties |
|---|---|---|
| Semi Detached House | £391,515.00 | 20 Semi Detached Houses |
| Terraced House | £376,180.00 | 89 Terraced Houses |
| Flat | £202,761.00 | 31 Flats |
| Detached House | £540,000.00 | 2 Detached Houses |

