
Houses for sale & to rent in South Norwood, London
House Prices in South Norwood
Properties in this part of South Norwood within London have an average house price of £404,702.00 and had 938 Property Transactions within the last 3 years¹. This area has 7,773 households² , where the most expensive property was sold for £3,150,000.00.
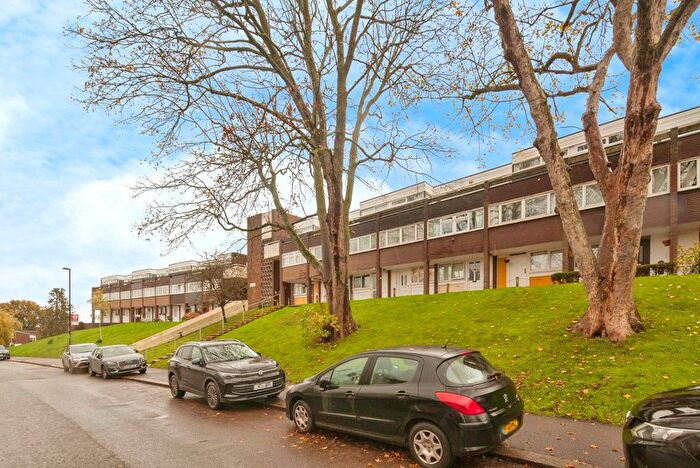
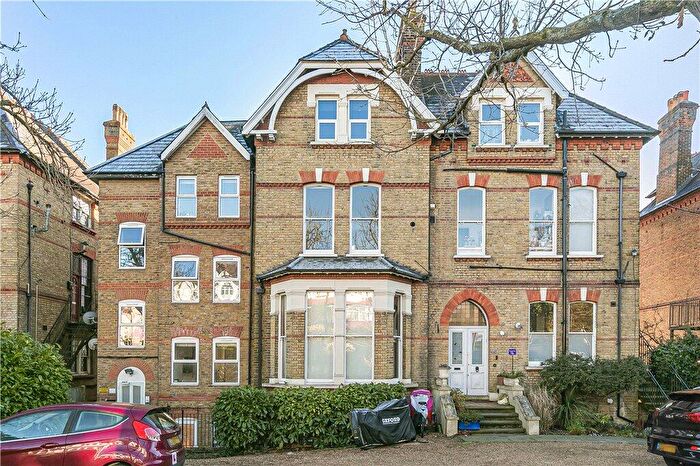
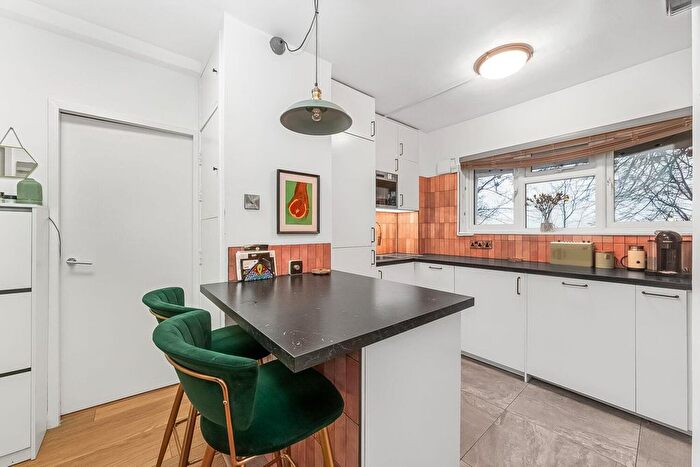
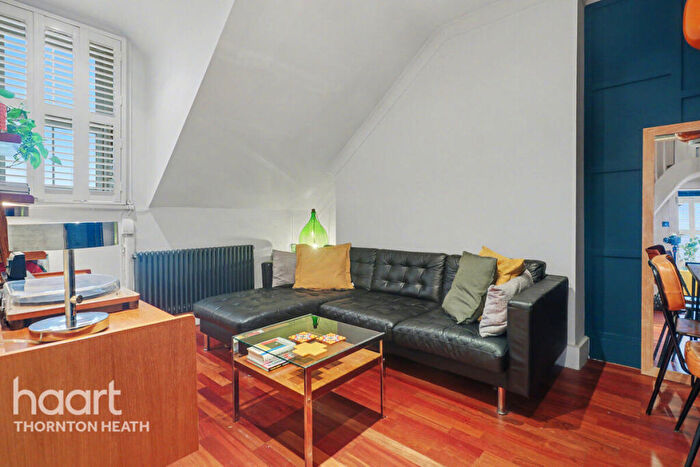
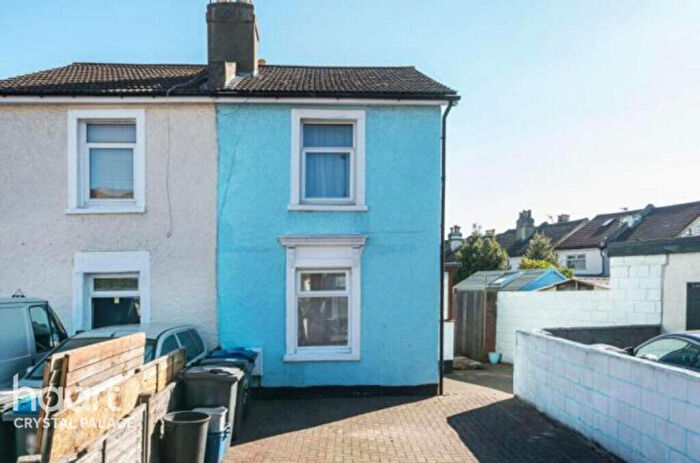
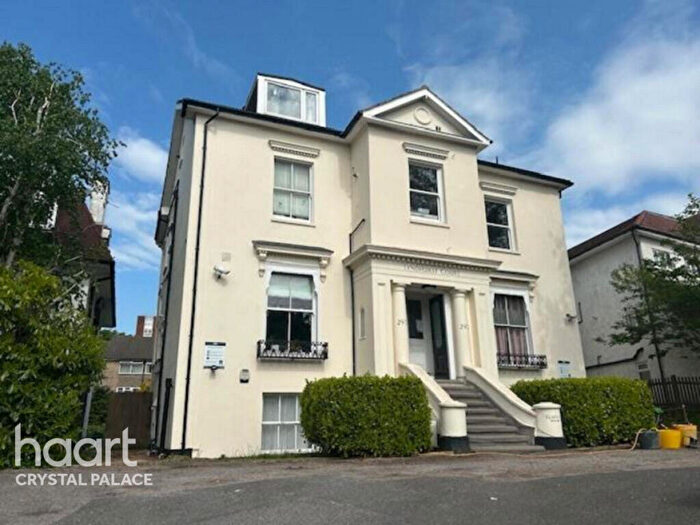
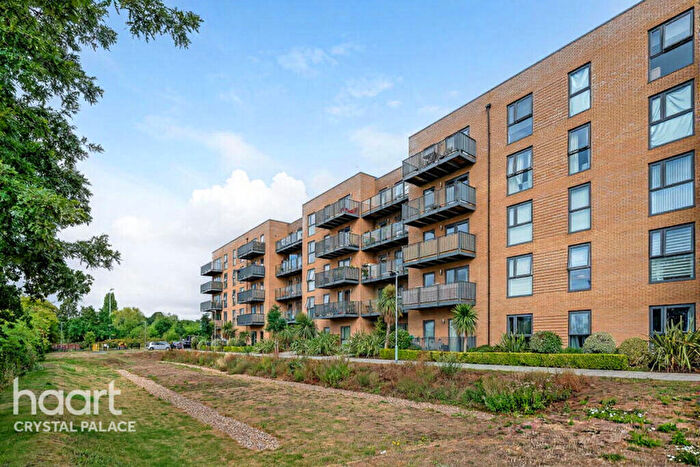
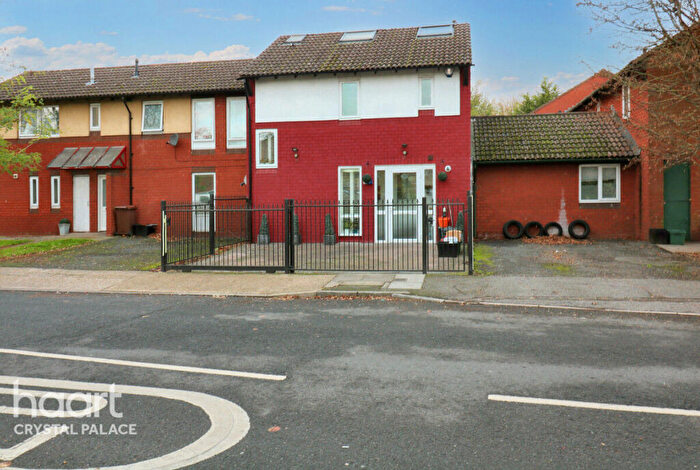
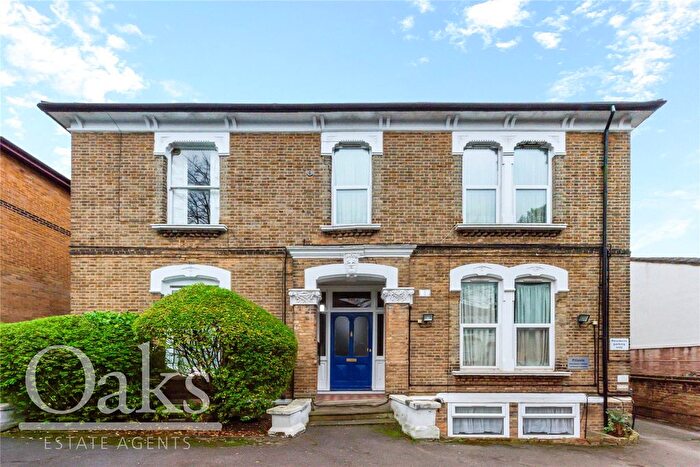
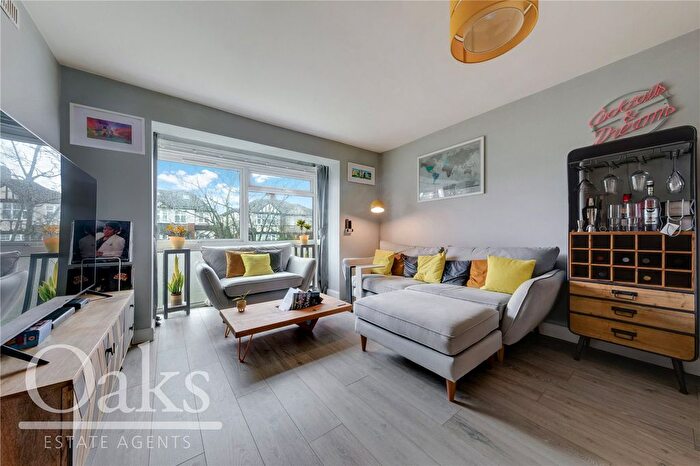
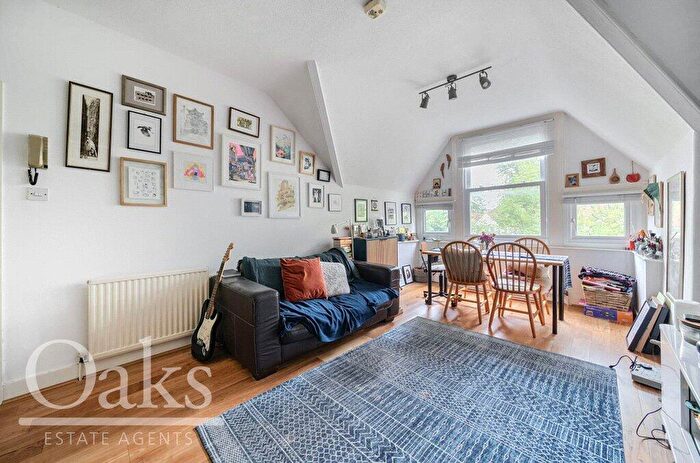
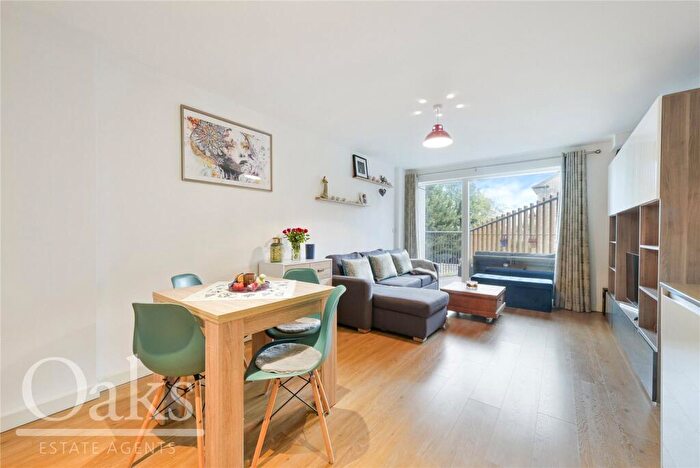
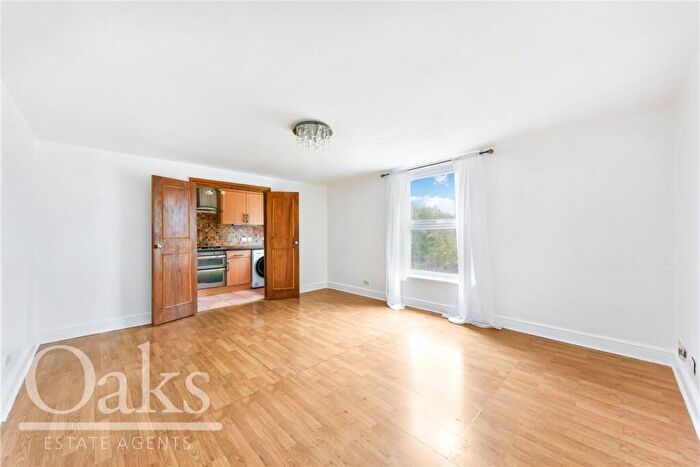
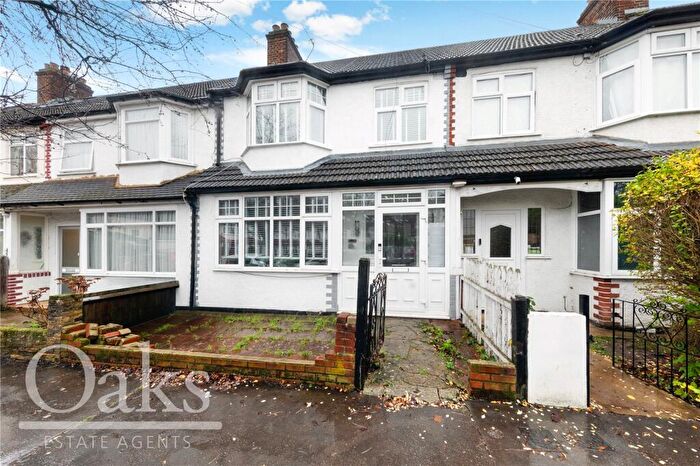
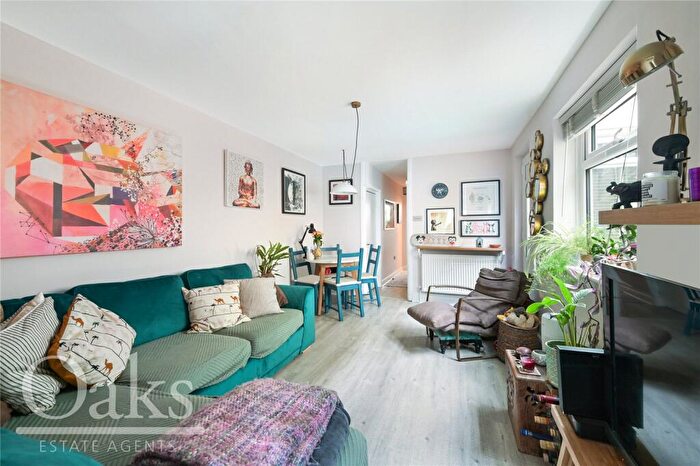
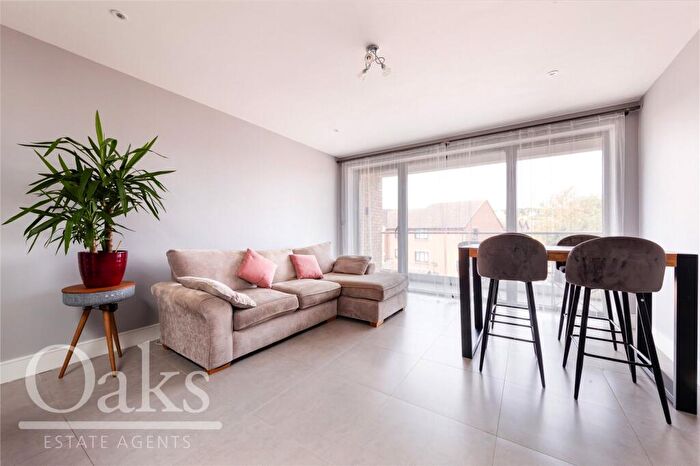
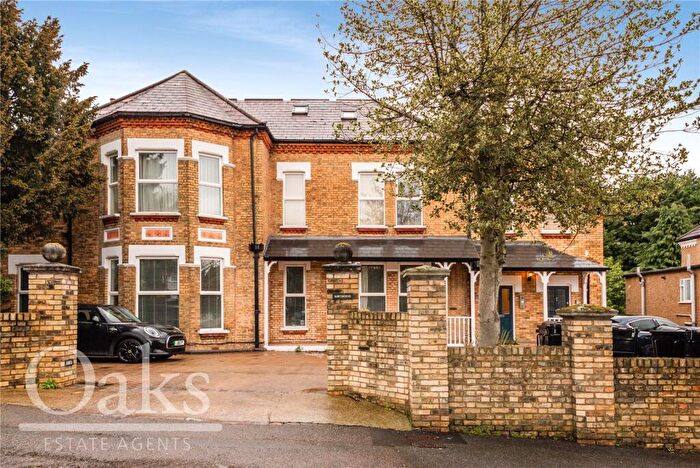
Properties for sale in South Norwood


![]()
If you are looking to sell your house, let it out, or receive a property valuation, an expert can help you.
Click the button below to get started.

Roads and Postcodes in South Norwood
Navigate through our locations to find the location of your next house in South Norwood, London for sale or to rent.
Transport near South Norwood
-

 Norwood Junction Station
 -
Anerley Station
-
 Harrington Road Station
 -
Selhurst Station
-
Birkbeck Station
-
Crystal Palace Station
-
Thornton Heath Station
-
Penge West Station
-
Arena Station
-
Avenue Road Station
- FAQ
- Price Paid By Year
- Property Type Price
Frequently asked questions about South Norwood
What is the average price for a property for sale in South Norwood?
The average price for a property for sale in South Norwood is £404,702. This amount is 7% lower than the average price in London. There are 4,733 property listings for sale in South Norwood.
What streets have the most expensive properties for sale in South Norwood?
The streets with the most expensive properties for sale in South Norwood are Stambourne Way at an average of £971,666, Buckleigh Way at an average of £895,000 and Fox Hill at an average of £892,906.
What streets have the most affordable properties for sale in South Norwood?
The streets with the most affordable properties for sale in South Norwood are Claret Gardens at an average of £150,000, Warminster Gardens at an average of £175,000 and St Marks Road at an average of £218,000.
Which train stations are available in or near South Norwood?
Some of the train stations available in or near South Norwood are Norwood Junction, Anerley and Selhurst.
Property Price Paid in South Norwood by Year
The average sold property price by year was:
| Year | Average Sold Price | Price Change |
Sold Properties
|
|---|---|---|---|
| 2025 | £436,356 | 9% |
143 Properties |
| 2024 | £398,569 | -1% |
233 Properties |
| 2023 | £403,889 | 2% |
244 Properties |
| 2022 | £395,585 | -6% |
318 Properties |
| 2021 | £419,968 | 3% |
404 Properties |
| 2020 | £408,612 | 6% |
253 Properties |
| 2019 | £385,928 | -5% |
237 Properties |
| 2018 | £406,869 | 13% |
315 Properties |
| 2017 | £352,386 | 2% |
326 Properties |
| 2016 | £343,844 | 9% |
375 Properties |
| 2015 | £312,950 | 16% |
376 Properties |
| 2014 | £264,025 | 6% |
364 Properties |
| 2013 | £248,051 | 15% |
278 Properties |
| 2012 | £209,710 | -7% |
254 Properties |
| 2011 | £223,779 | 2% |
190 Properties |
| 2010 | £219,287 | 17% |
151 Properties |
| 2009 | £181,526 | -12% |
144 Properties |
| 2008 | £202,694 | -1% |
183 Properties |
| 2007 | £205,182 | 6% |
573 Properties |
| 2006 | £192,057 | 7% |
443 Properties |
| 2005 | £179,080 | 5% |
364 Properties |
| 2004 | £169,373 | 5% |
430 Properties |
| 2003 | £160,910 | 16% |
480 Properties |
| 2002 | £135,430 | 22% |
520 Properties |
| 2001 | £105,058 | 8% |
473 Properties |
| 2000 | £96,291 | 14% |
504 Properties |
| 1999 | £82,570 | 15% |
515 Properties |
| 1998 | £69,808 | 14% |
441 Properties |
| 1997 | £59,908 | 11% |
441 Properties |
| 1996 | £53,557 | 7% |
336 Properties |
| 1995 | £49,673 | - |
298 Properties |
Property Price per Property Type in South Norwood
Here you can find historic sold price data in order to help with your property search.
The average Property Paid Price for specific property types in the last three years are:
| Property Type | Average Sold Price | Sold Properties |
|---|---|---|
| Flat | £305,736.00 | 639 Flats |
| Semi Detached House | £730,802.00 | 81 Semi Detached Houses |
| Detached House | £922,869.00 | 21 Detached Houses |
| Terraced House | £536,394.00 | 197 Terraced Houses |