
Houses for sale & to rent in Woodside, London
House Prices in Woodside
Properties in this part of Woodside within London have an average house price of £394,180.00 and had 748 Property Transactions within the last 3 years¹. This area has 5,712 households² , where the most expensive property was sold for £1,555,840.00.
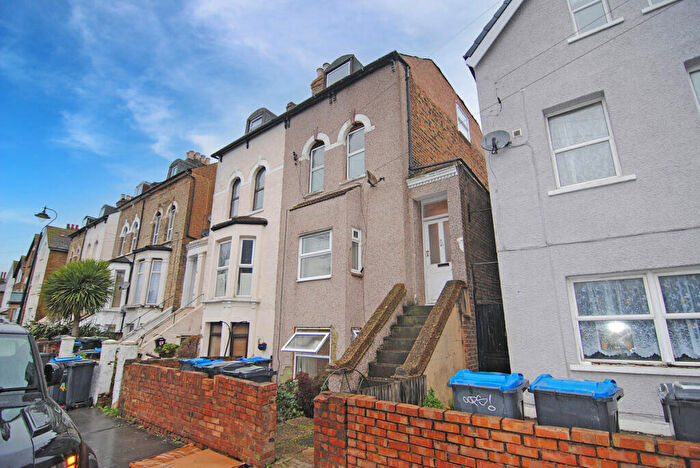
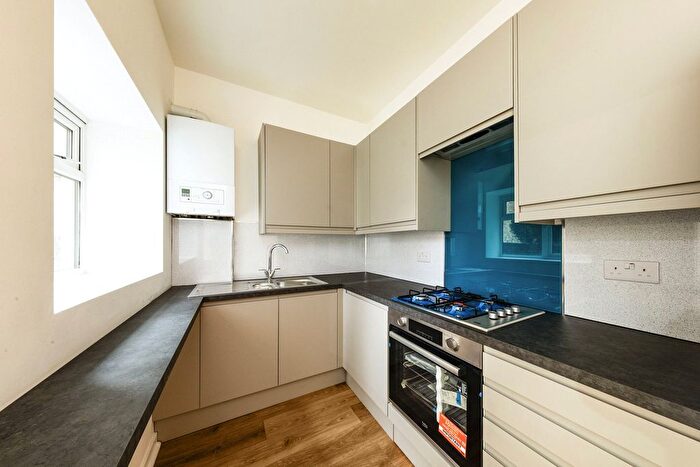
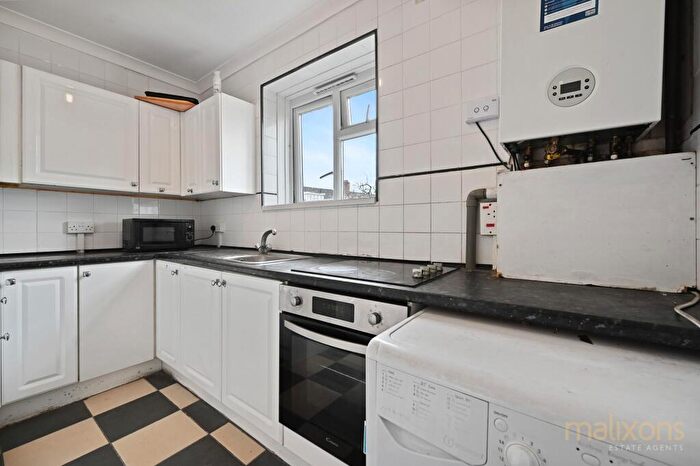
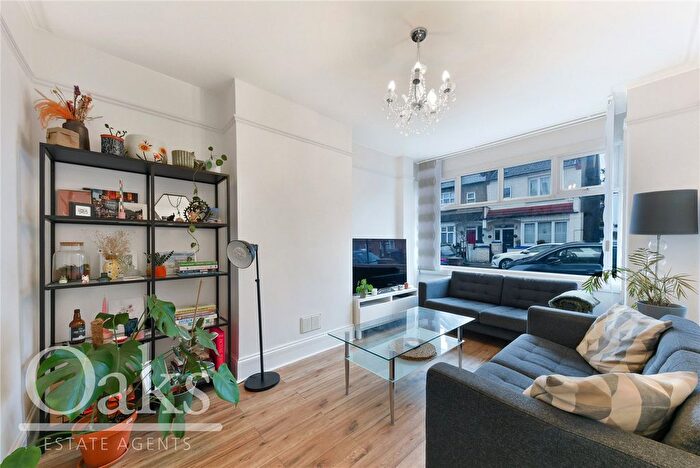
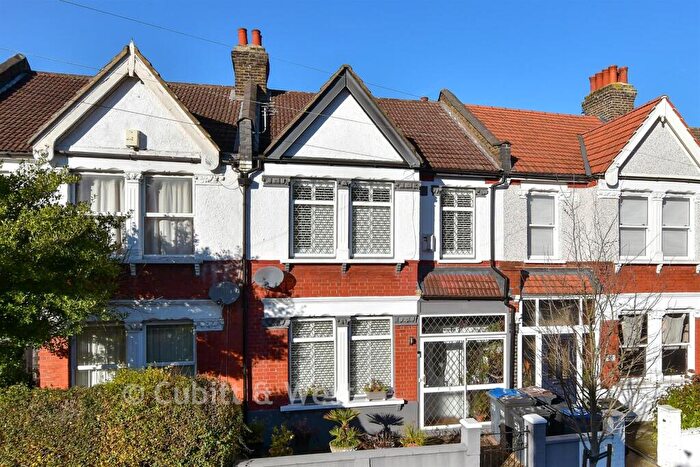
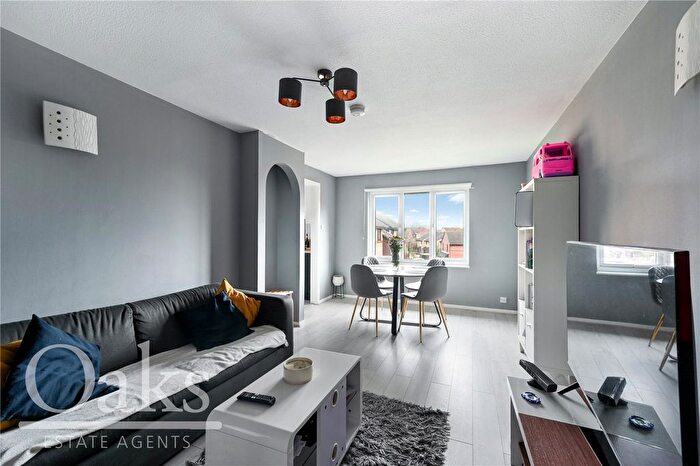
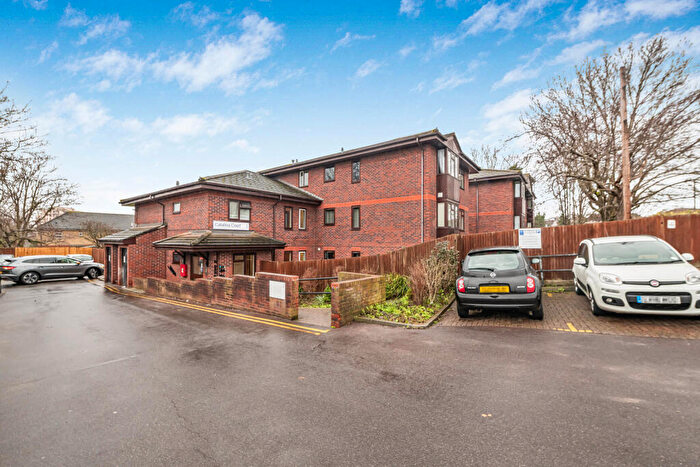
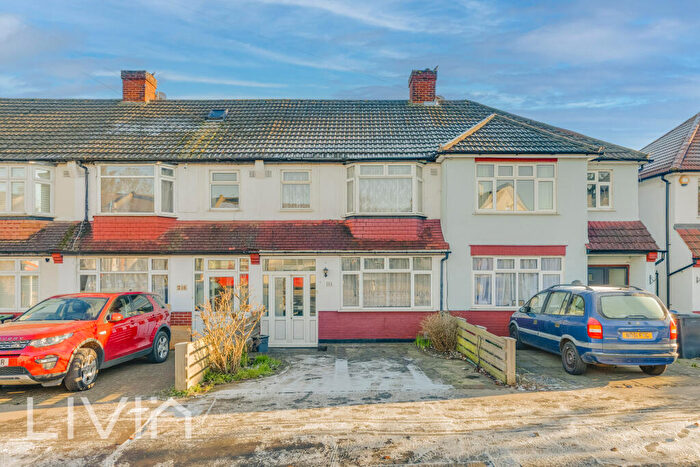
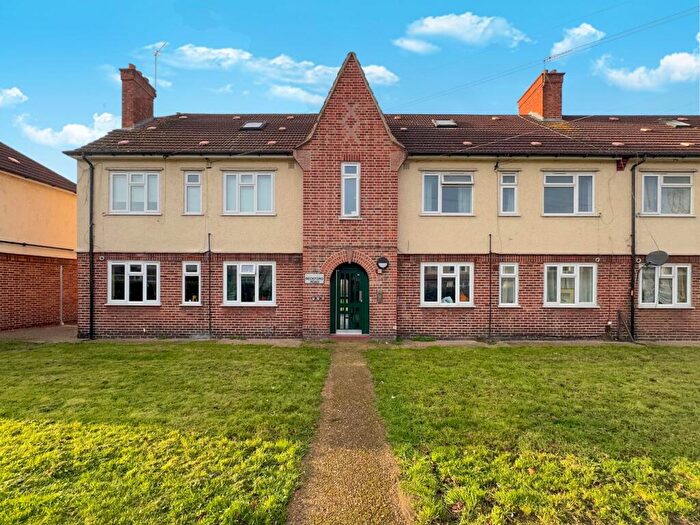
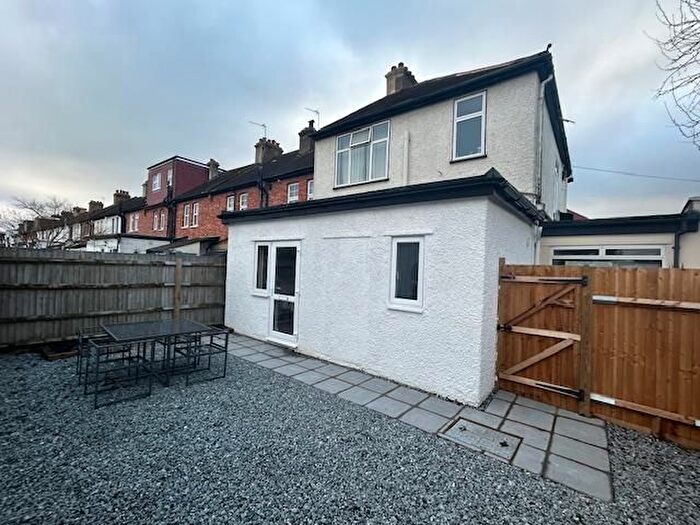
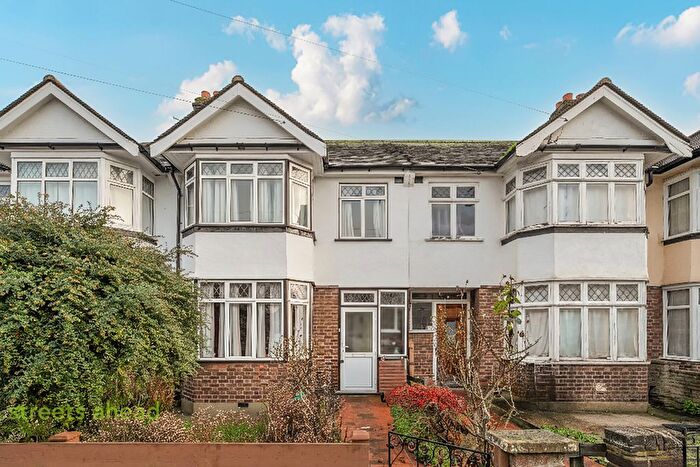
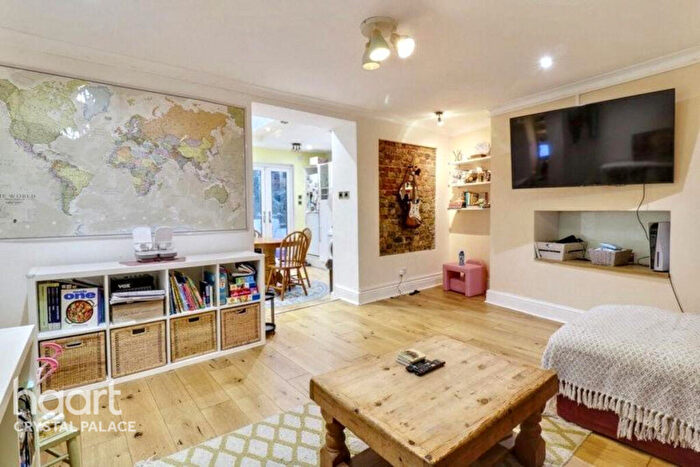
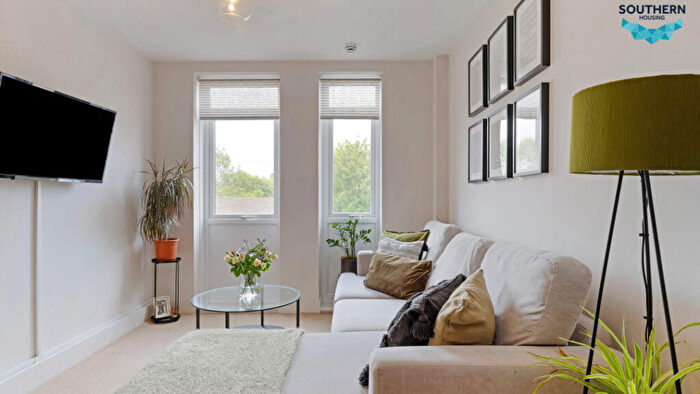
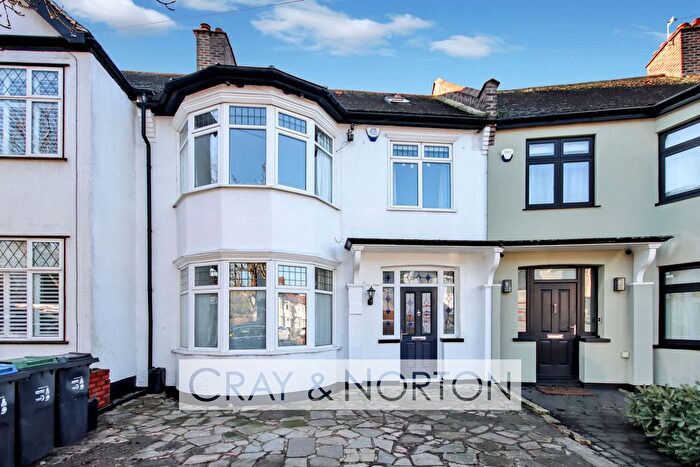
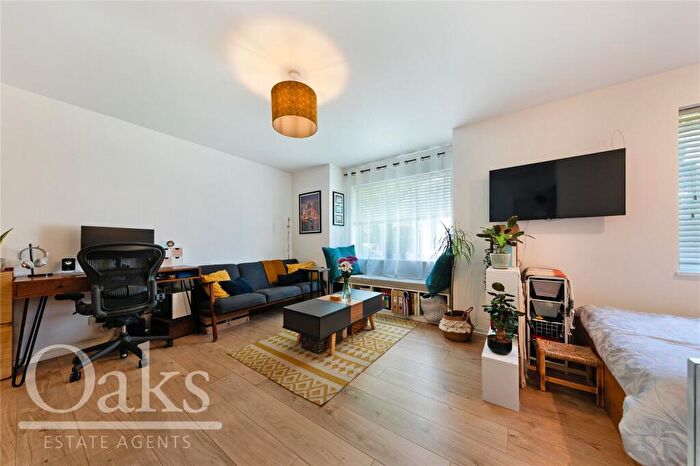
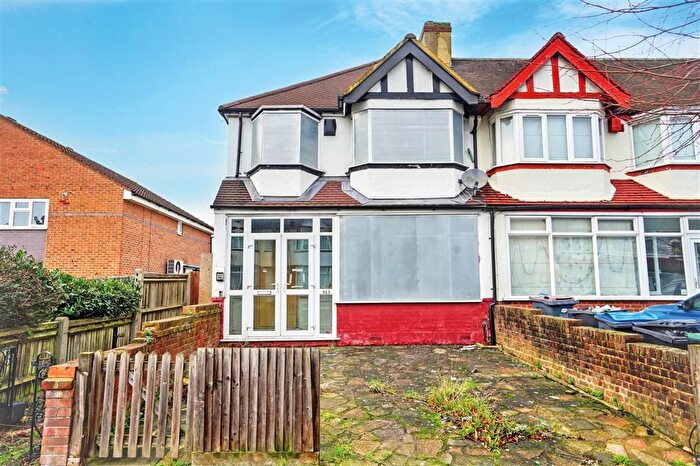
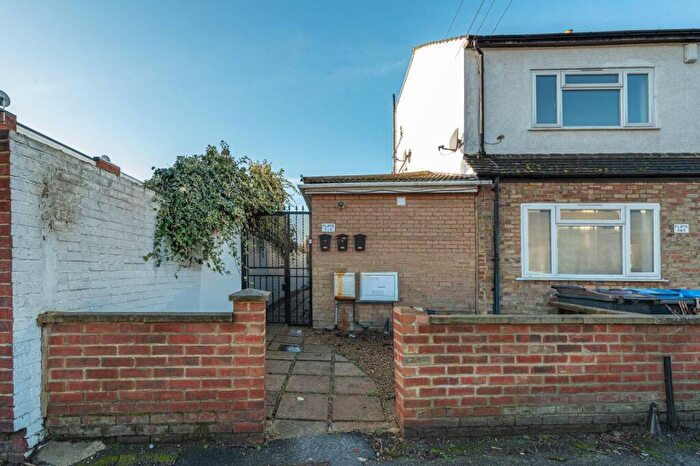
Properties for sale in Woodside


![]()
If you are looking to sell your house, let it out, or receive a property valuation, an expert can help you.
Click the button below to get started.
Roads and Postcodes in Woodside
Navigate through our locations to find the location of your next house in Woodside, London for sale or to rent.
Transport near Woodside
-

 Norwood Junction Station
 -
 Arena Station
 -
Woodside Station
-
Harrington Road Station
-
Blackhorse Lane Station
-
Elmers End Station
-
Selhurst Station
-
Birkbeck Station
-
Addiscombe Station
-
Avenue Road Station
- FAQ
- Price Paid By Year
- Property Type Price
Frequently asked questions about Woodside
What is the average price for a property for sale in Woodside?
The average price for a property for sale in Woodside is £394,180. This amount is 9% lower than the average price in London. There are 3,611 property listings for sale in Woodside.
What streets have the most expensive properties for sale in Woodside?
The streets with the most expensive properties for sale in Woodside are Holland Road at an average of £585,250, Cumberland Road at an average of £552,500 and Tudor Road at an average of £547,416.
What streets have the most affordable properties for sale in Woodside?
The streets with the most affordable properties for sale in Woodside are Shinners Close at an average of £157,661, Clifford Road at an average of £253,727 and Spring Lane at an average of £255,666.
Which train stations are available in or near Woodside?
Some of the train stations available in or near Woodside are Norwood Junction, Elmers End and Selhurst.
Property Price Paid in Woodside by Year
The average sold property price by year was:
| Year | Average Sold Price | Price Change |
Sold Properties
|
|---|---|---|---|
| 2025 | £414,570 | 9% |
132 Properties |
| 2024 | £375,346 | -5% |
194 Properties |
| 2023 | £394,280 | -1% |
186 Properties |
| 2022 | £398,179 | 8% |
236 Properties |
| 2021 | £366,453 | -2% |
281 Properties |
| 2020 | £375,594 | 7% |
181 Properties |
| 2019 | £350,900 | -1% |
173 Properties |
| 2018 | £355,746 | 3% |
188 Properties |
| 2017 | £345,017 | 6% |
237 Properties |
| 2016 | £325,785 | 15% |
245 Properties |
| 2015 | £278,539 | 12% |
277 Properties |
| 2014 | £245,974 | 14% |
295 Properties |
| 2013 | £211,080 | 10% |
178 Properties |
| 2012 | £190,317 | -0,1% |
126 Properties |
| 2011 | £190,592 | 1% |
117 Properties |
| 2010 | £189,297 | 6% |
122 Properties |
| 2009 | £177,410 | -14% |
129 Properties |
| 2008 | £201,445 | -1% |
187 Properties |
| 2007 | £203,213 | 10% |
385 Properties |
| 2006 | £183,088 | 5% |
372 Properties |
| 2005 | £173,133 | 3% |
310 Properties |
| 2004 | £168,343 | 7% |
387 Properties |
| 2003 | £156,581 | 17% |
374 Properties |
| 2002 | £130,358 | 15% |
422 Properties |
| 2001 | £110,581 | 15% |
435 Properties |
| 2000 | £94,232 | 18% |
384 Properties |
| 1999 | £77,659 | 11% |
412 Properties |
| 1998 | £68,967 | 13% |
345 Properties |
| 1997 | £60,000 | 13% |
375 Properties |
| 1996 | £52,227 | 7% |
294 Properties |
| 1995 | £48,501 | - |
249 Properties |
Property Price per Property Type in Woodside
Here you can find historic sold price data in order to help with your property search.
The average Property Paid Price for specific property types in the last three years are:
| Property Type | Average Sold Price | Sold Properties |
|---|---|---|
| Flat | £270,965.00 | 263 Flats |
| Semi Detached House | £490,872.00 | 58 Semi Detached Houses |
| Detached House | £431,700.00 | 5 Detached Houses |
| Terraced House | £457,237.00 | 422 Terraced Houses |