
Houses for sale & to rent in Upper Norwood, London
House Prices in Upper Norwood
Properties in this part of Upper Norwood within London have an average house price of £475,299.00 and had 637 Property Transactions within the last 3 years¹. This area has 4,767 households² , where the most expensive property was sold for £2,225,000.00.
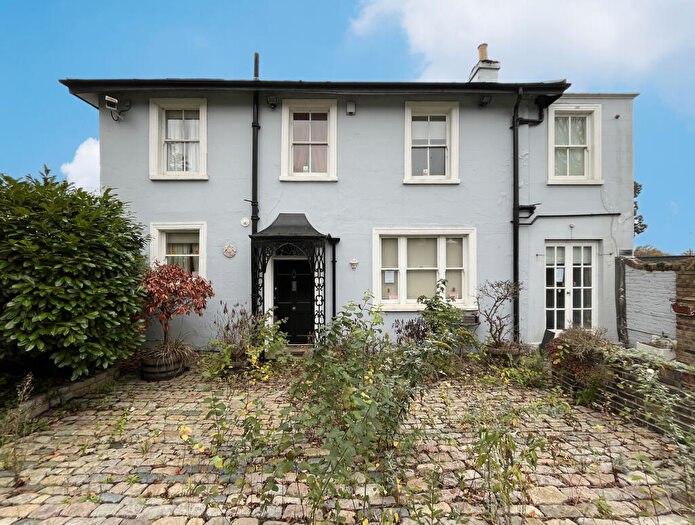
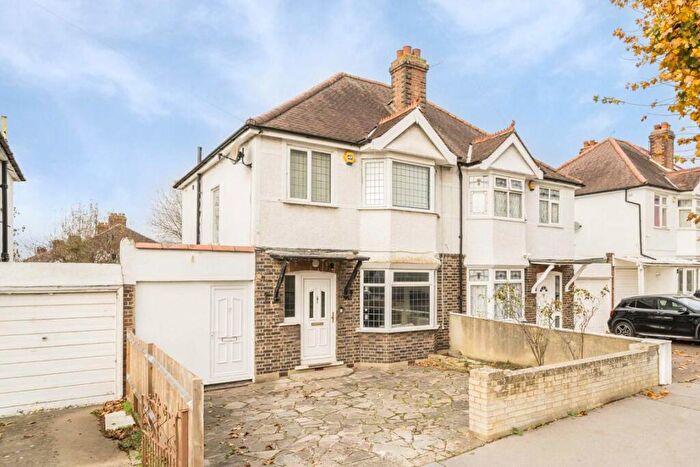
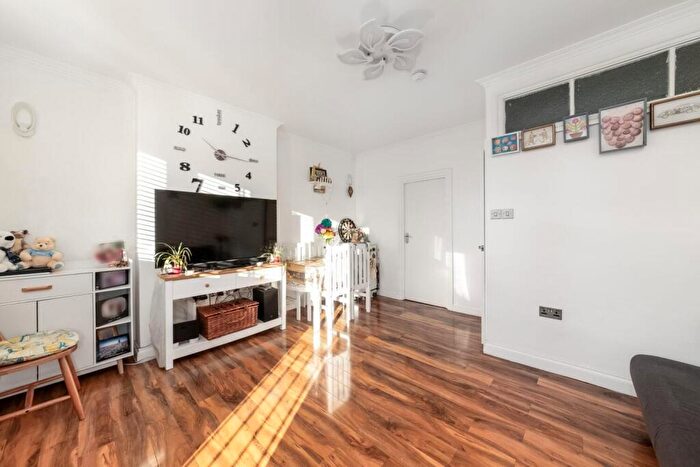
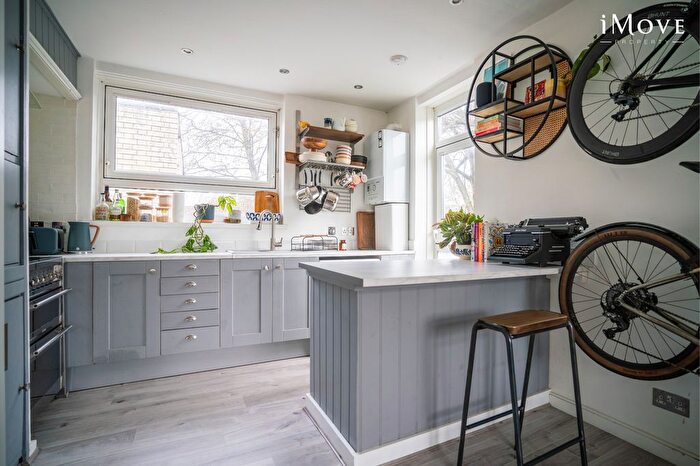
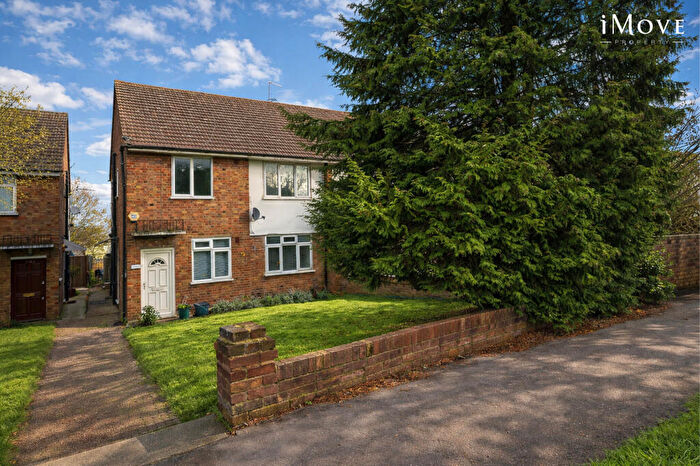
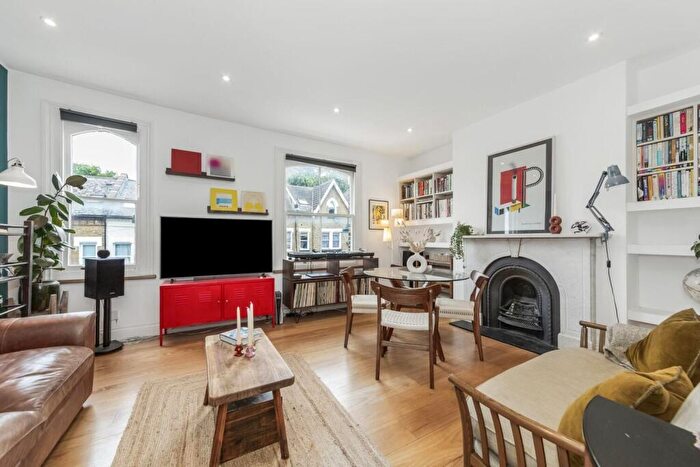
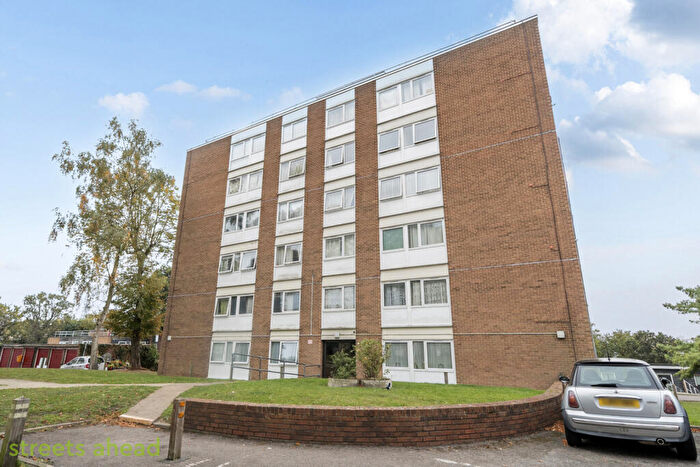
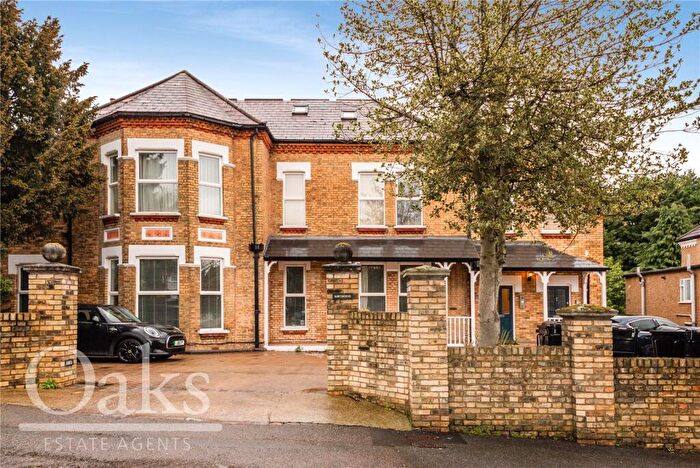
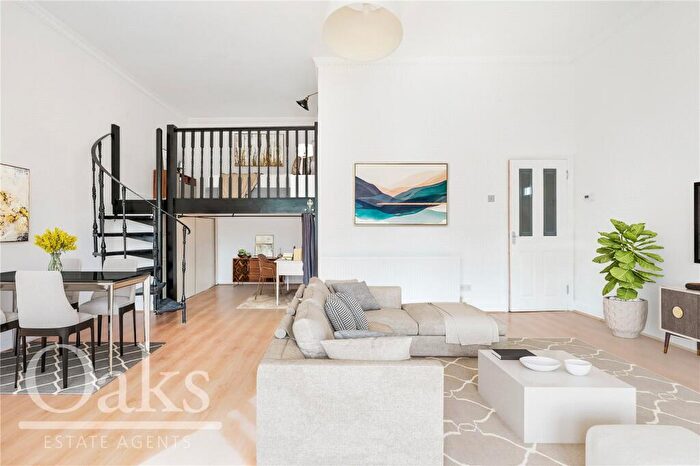
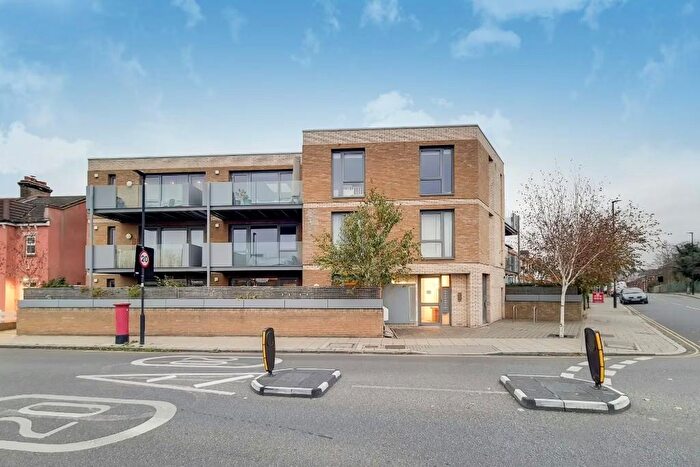
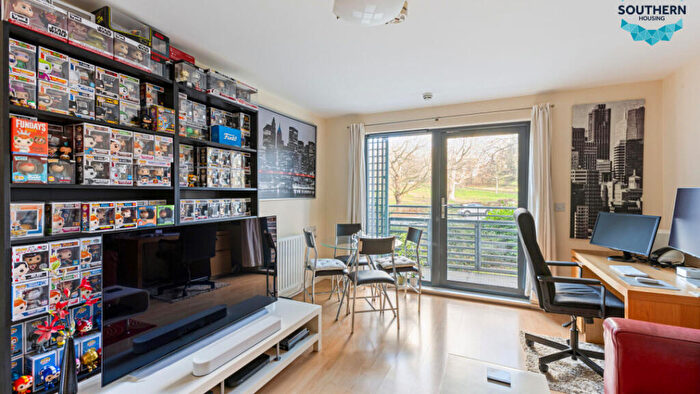
Properties for sale in Upper Norwood

![]()
If you are looking to sell your house, let it out, or receive a property valuation, an expert can help you.
Click the button below to get started.


Roads and Postcodes in Upper Norwood
Navigate through our locations to find the location of your next house in Upper Norwood, London for sale or to rent.
Transport near Upper Norwood
-
 Gipsy Hill Station
 -
 Crystal Palace Station
 -
West Norwood Station
-
Thornton Heath Station
-
Norbury Station
-
Anerley Station
-
Sydenham Hill Station
-
Penge West Station
-
Norwood Junction Station
-
Selhurst Station
- FAQ
- Price Paid By Year
- Property Type Price
Frequently asked questions about Upper Norwood
What is the average price for a property for sale in Upper Norwood?
The average price for a property for sale in Upper Norwood is £475,299. This amount is 10% higher than the average price in London. There are 4,105 property listings for sale in Upper Norwood.
What streets have the most expensive properties for sale in Upper Norwood?
The streets with the most expensive properties for sale in Upper Norwood are Dickenswood Close at an average of £1,304,500, Eversley Road at an average of £1,059,000 and Pytchley Crescent at an average of £915,000.
What streets have the most affordable properties for sale in Upper Norwood?
The streets with the most affordable properties for sale in Upper Norwood are South Norwood Hill at an average of £205,000, Menlo Gardens at an average of £222,183 and The Woodlands at an average of £275,708.
Which train stations are available in or near Upper Norwood?
Some of the train stations available in or near Upper Norwood are Gipsy Hill, Crystal Palace and West Norwood.
Property Price Paid in Upper Norwood by Year
The average sold property price by year was:
| Year | Average Sold Price | Price Change |
Sold Properties
|
|---|---|---|---|
| 2025 | £508,059 | -1% |
109 Properties |
| 2024 | £512,712 | 9% |
154 Properties |
| 2023 | £467,303 | 6% |
144 Properties |
| 2022 | £439,730 | -9% |
230 Properties |
| 2021 | £478,249 | 1% |
248 Properties |
| 2020 | £471,894 | 8% |
166 Properties |
| 2019 | £433,694 | 2% |
180 Properties |
| 2018 | £423,433 | -4% |
159 Properties |
| 2017 | £440,374 | 1% |
169 Properties |
| 2016 | £434,180 | 13% |
172 Properties |
| 2015 | £376,487 | 9% |
250 Properties |
| 2014 | £343,847 | 8% |
235 Properties |
| 2013 | £316,748 | 13% |
224 Properties |
| 2012 | £275,938 | 12% |
150 Properties |
| 2011 | £241,902 | -6% |
112 Properties |
| 2010 | £255,462 | 7% |
101 Properties |
| 2009 | £236,987 | -6% |
82 Properties |
| 2008 | £251,107 | 3% |
133 Properties |
| 2007 | £243,696 | 7% |
315 Properties |
| 2006 | £226,809 | 10% |
302 Properties |
| 2005 | £203,974 | 1% |
224 Properties |
| 2004 | £201,739 | 10% |
255 Properties |
| 2003 | £181,618 | 8% |
278 Properties |
| 2002 | £167,970 | 20% |
301 Properties |
| 2001 | £134,671 | 18% |
280 Properties |
| 2000 | £109,906 | 3% |
271 Properties |
| 1999 | £106,808 | 26% |
290 Properties |
| 1998 | £79,299 | 10% |
212 Properties |
| 1997 | £71,029 | 5% |
265 Properties |
| 1996 | £67,395 | 4% |
198 Properties |
| 1995 | £64,515 | - |
177 Properties |
Property Price per Property Type in Upper Norwood
Here you can find historic sold price data in order to help with your property search.
The average Property Paid Price for specific property types in the last three years are:
| Property Type | Average Sold Price | Sold Properties |
|---|---|---|
| Flat | £342,671.00 | 384 Flats |
| Semi Detached House | £683,325.00 | 80 Semi Detached Houses |
| Detached House | £898,182.00 | 52 Detached Houses |
| Terraced House | £576,929.00 | 121 Terraced Houses |