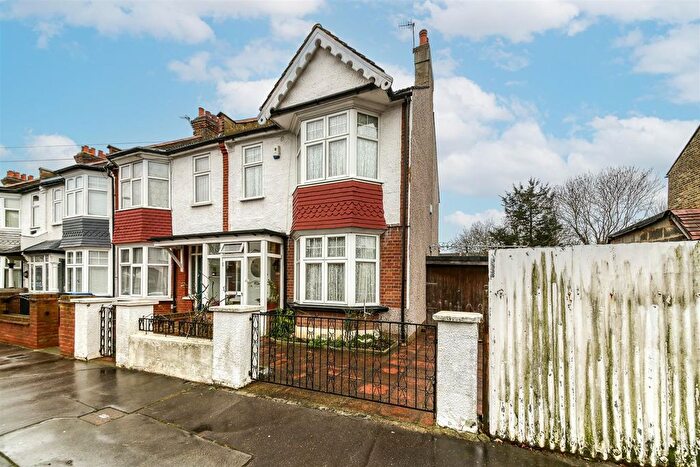
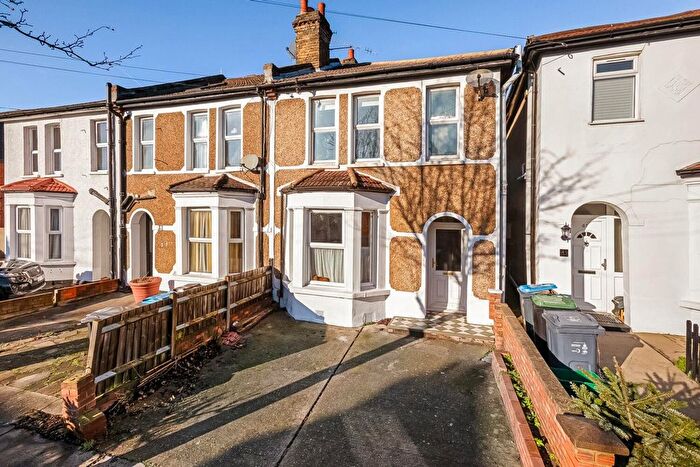
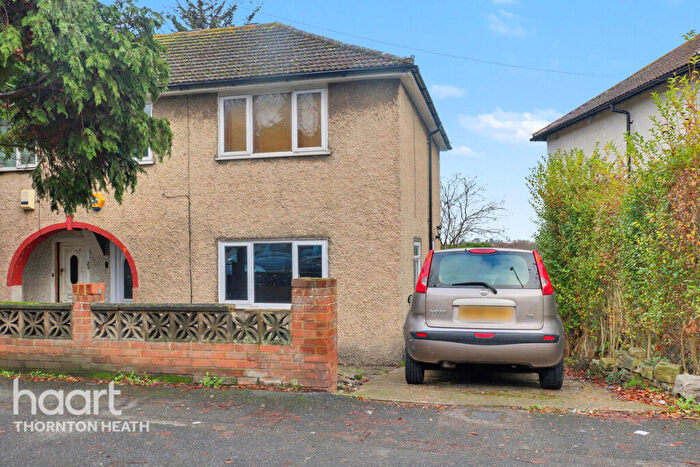
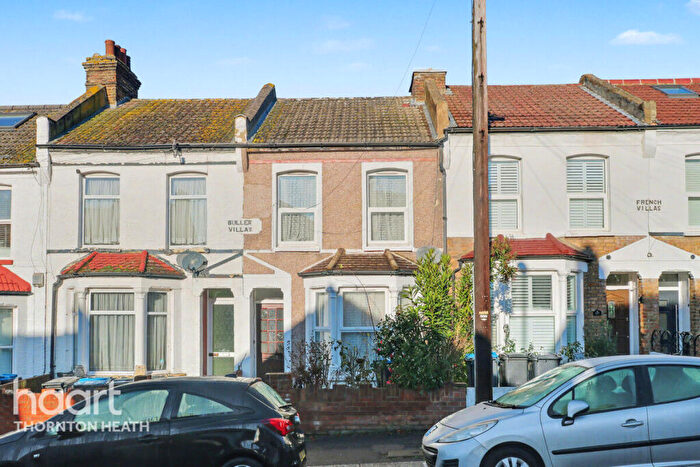
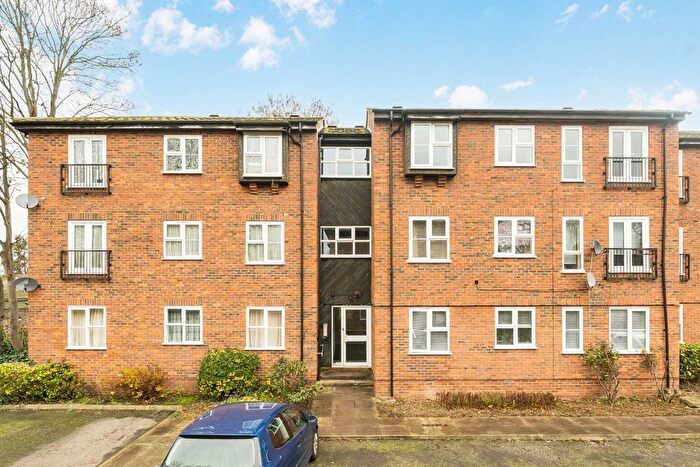
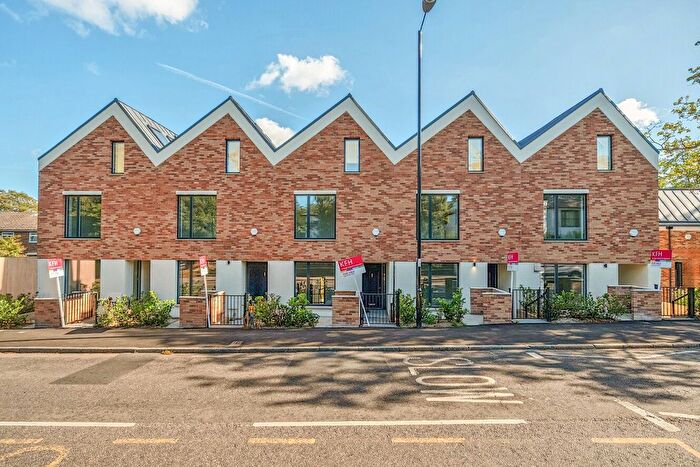
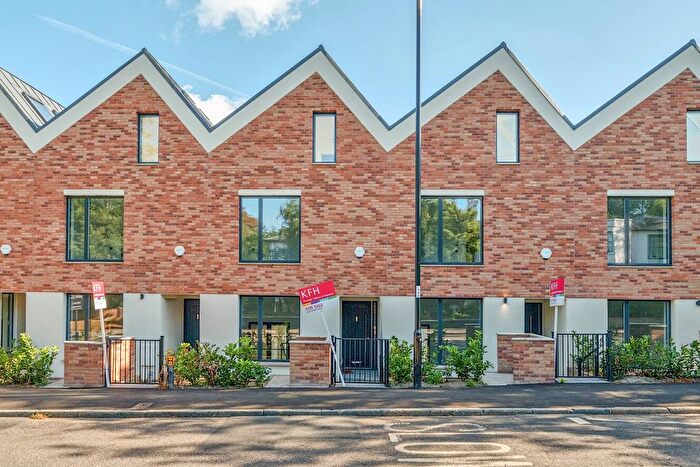
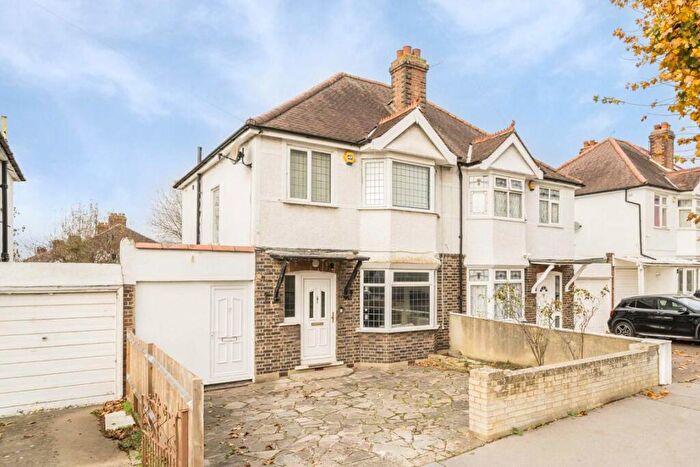
Houses for sale & to rent in Upper Norwood, Thornton Heath
House Prices in Upper Norwood
Properties in this part of Upper Norwood within Thornton Heath have an average house price of £484,114.00 and had 109 Property Transactions within the last 3 years¹. This area has 1,420 households² , where the most expensive property was sold for £1,200,000.00.
Properties for sale in Upper Norwood
Roads and Postcodes in Upper Norwood
Navigate through our locations to find the location of your next house in Upper Norwood, Thornton Heath for sale or to rent.
| Streets | Postcodes |
|---|---|
| Brickfield Road | CR7 8DS |
| Buckingham Avenue | CR7 8AS |
| Buckingham Gardens | CR7 8AT |
| Carolina Road | CR7 8DL CR7 8DN CR7 8DP CR7 8DT |
| County Road | CR7 8HN |
| Florida Road | CR7 8EU CR7 8EW CR7 8EY CR7 8EZ |
| Georgia Road | CR7 8DQ CR7 8DR CR7 8DU CR7 8DW |
| Green Lane | CR7 8BA CR7 8BB CR7 8BD CR7 8BE CR7 8BF CR7 8BG CR7 8BH CR7 8BJ CR7 8BL |
| Green Lane Gardens | CR7 8HP |
| Hawthorn Avenue | CR7 8BU CR7 8BW |
| Highbury Avenue | CR7 8BN CR7 8BP CR7 8BQ |
| Ingram Road | CR7 8EB CR7 8ED CR7 8EE CR7 8EF CR7 8EH |
| Kensington Avenue | CR7 8BT CR7 8BY CR7 8BZ |
| Maryland Road | CR7 8DE CR7 8DF CR7 8DG CR7 8DJ |
| Norbury Avenue | CR7 8AB CR7 8AG CR7 8AJ CR7 8AP |
| Northwood Road | CR7 8HU CR7 8HW CR7 8HX |
| Osterley Gardens | CR7 8DH |
| Springfield Road | CR7 8DY CR7 8DZ |
| Virginia Road | CR7 8EG CR7 8EJ CR7 8EL CR7 8EN |
| Westminster Avenue | CR7 8BR CR7 8BS |
Transport near Upper Norwood
-
Norbury Station
-
Thornton Heath Station
-
Gipsy Hill Station
-
Selhurst Station
-
Streatham Common Station
-
West Norwood Station
-
Crystal Palace Station
-
Streatham Station
-
Norwood Junction Station
-
Anerley Station
- FAQ
- Price Paid By Year
- Property Type Price
Frequently asked questions about Upper Norwood
What is the average price for a property for sale in Upper Norwood?
The average price for a property for sale in Upper Norwood is £484,114. This amount is 28% higher than the average price in Thornton Heath. There are 2,919 property listings for sale in Upper Norwood.
What streets have the most expensive properties for sale in Upper Norwood?
The streets with the most expensive properties for sale in Upper Norwood are Virginia Road at an average of £734,944, Florida Road at an average of £666,111 and Georgia Road at an average of £640,000.
What streets have the most affordable properties for sale in Upper Norwood?
The streets with the most affordable properties for sale in Upper Norwood are Northwood Road at an average of £279,187, County Road at an average of £280,000 and Osterley Gardens at an average of £355,000.
Which train stations are available in or near Upper Norwood?
Some of the train stations available in or near Upper Norwood are Norbury, Thornton Heath and Gipsy Hill.
Property Price Paid in Upper Norwood by Year
The average sold property price by year was:
| Year | Average Sold Price | Price Change |
Sold Properties
|
|---|---|---|---|
| 2025 | £448,175 | -8% |
14 Properties |
| 2024 | £482,506 | -6% |
29 Properties |
| 2023 | £512,346 | 6% |
24 Properties |
| 2022 | £481,071 | -5% |
42 Properties |
| 2021 | £504,657 | 12% |
44 Properties |
| 2020 | £443,698 | 1% |
30 Properties |
| 2019 | £437,732 | 0,1% |
29 Properties |
| 2018 | £437,219 | 2% |
31 Properties |
| 2017 | £430,247 | 3% |
39 Properties |
| 2016 | £418,597 | 11% |
40 Properties |
| 2015 | £371,985 | 18% |
44 Properties |
| 2014 | £304,424 | 0,2% |
37 Properties |
| 2013 | £303,738 | 3% |
39 Properties |
| 2012 | £293,606 | 5% |
23 Properties |
| 2011 | £280,196 | 14% |
28 Properties |
| 2010 | £241,490 | 3% |
28 Properties |
| 2009 | £233,638 | -18% |
22 Properties |
| 2008 | £275,370 | -2% |
31 Properties |
| 2007 | £281,657 | 10% |
77 Properties |
| 2006 | £254,692 | 9% |
77 Properties |
| 2005 | £231,643 | 12% |
45 Properties |
| 2004 | £203,457 | -4% |
47 Properties |
| 2003 | £211,179 | 13% |
58 Properties |
| 2002 | £183,794 | 22% |
70 Properties |
| 2001 | £142,554 | -5% |
36 Properties |
| 2000 | £149,148 | 21% |
45 Properties |
| 1999 | £118,193 | 14% |
62 Properties |
| 1998 | £102,171 | 16% |
54 Properties |
| 1997 | £86,256 | 10% |
59 Properties |
| 1996 | £77,562 | 3% |
53 Properties |
| 1995 | £75,428 | - |
48 Properties |
Property Price per Property Type in Upper Norwood
Here you can find historic sold price data in order to help with your property search.
The average Property Paid Price for specific property types in the last three years are:
| Property Type | Average Sold Price | Sold Properties |
|---|---|---|
| Semi Detached House | £578,425.00 | 40 Semi Detached Houses |
| Detached House | £505,400.00 | 5 Detached Houses |
| Terraced House | £526,661.00 | 40 Terraced Houses |
| Flat | £251,583.00 | 24 Flats |

