
Houses for sale & to rent in Bensham Manor, Thornton Heath
House Prices in Bensham Manor
Properties in this part of Bensham Manor within Thornton Heath have an average house price of £376k and had 394 Property Transactions within the last 3 years¹. This area has 5,215 households² , where the most expensive property was sold for £710k.
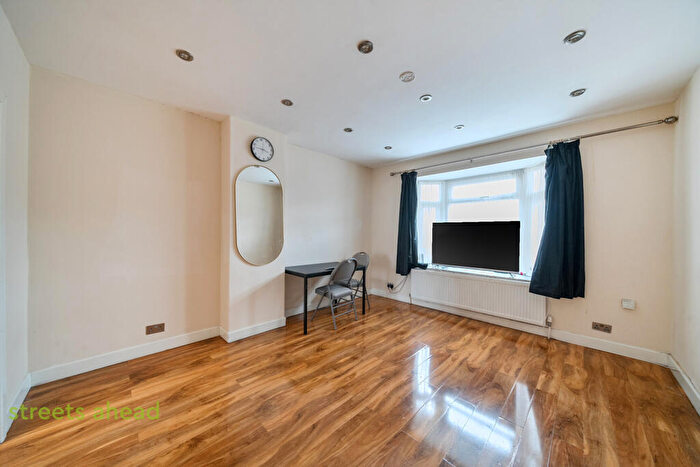
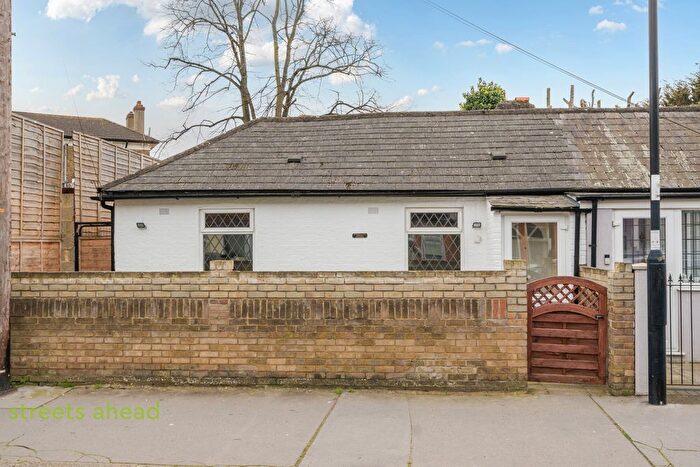
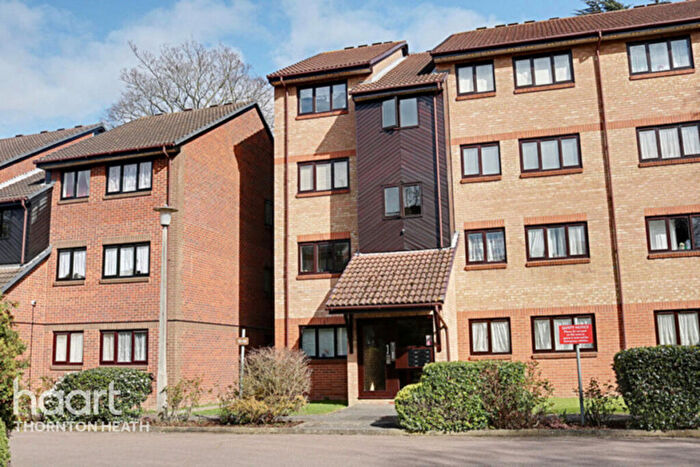
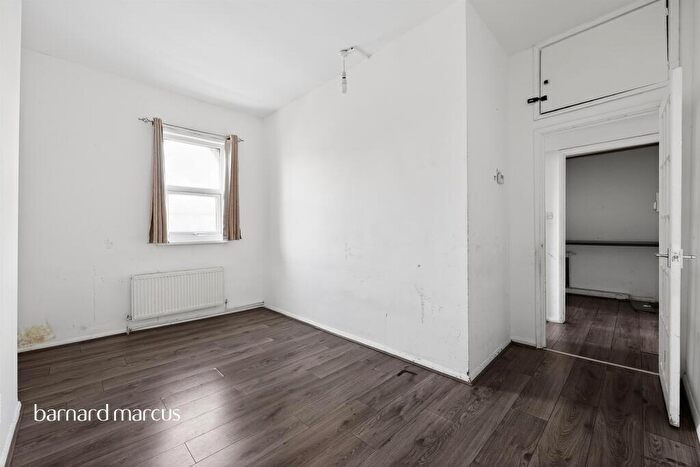
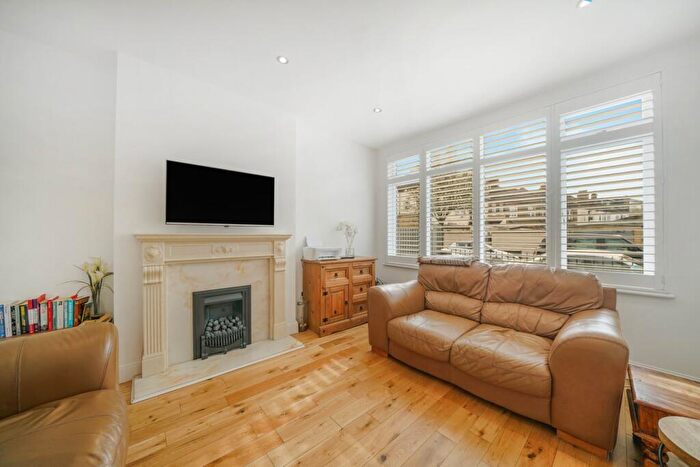
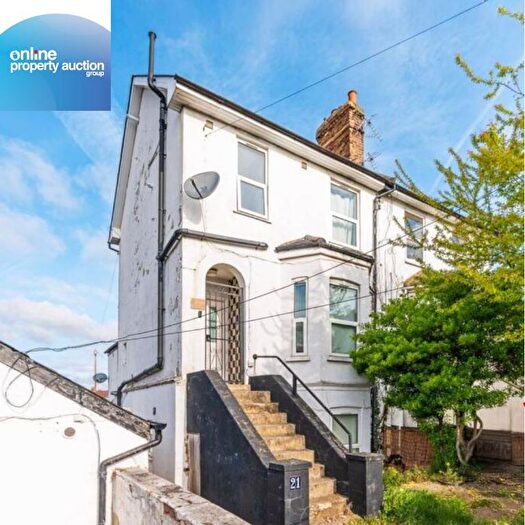
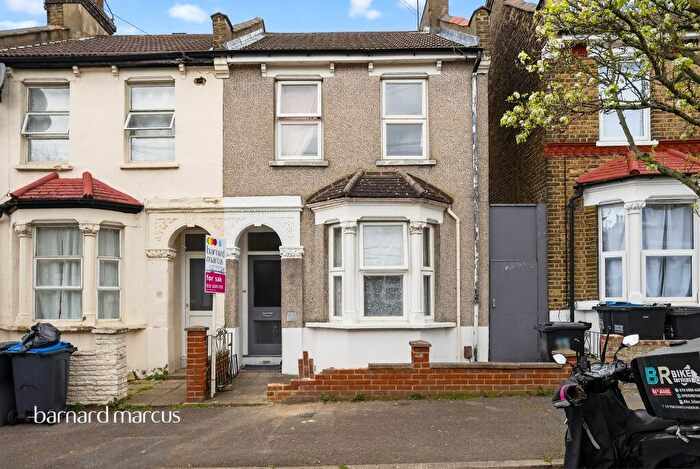
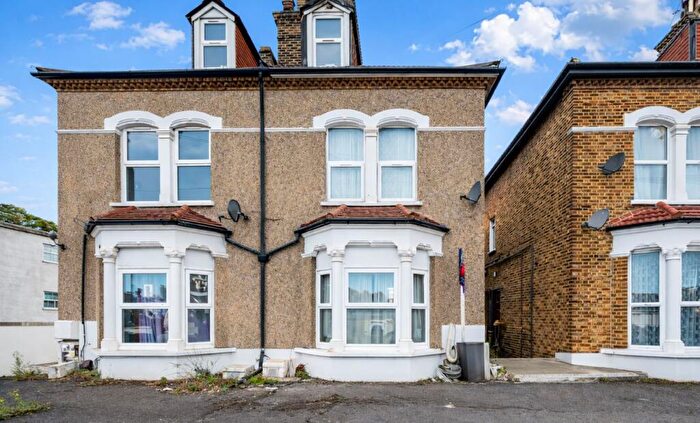
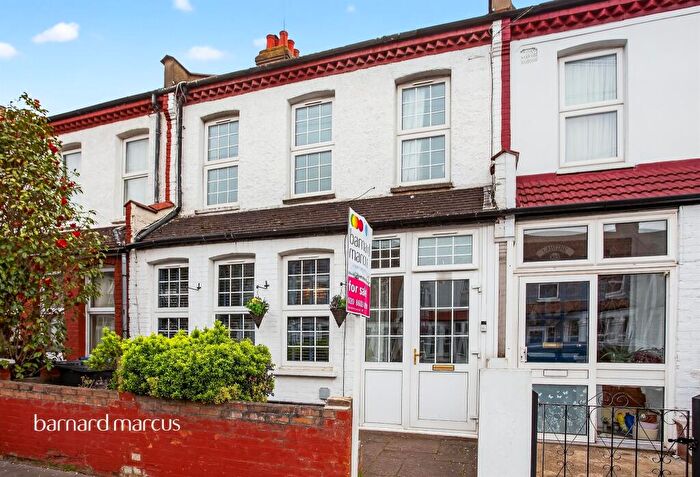
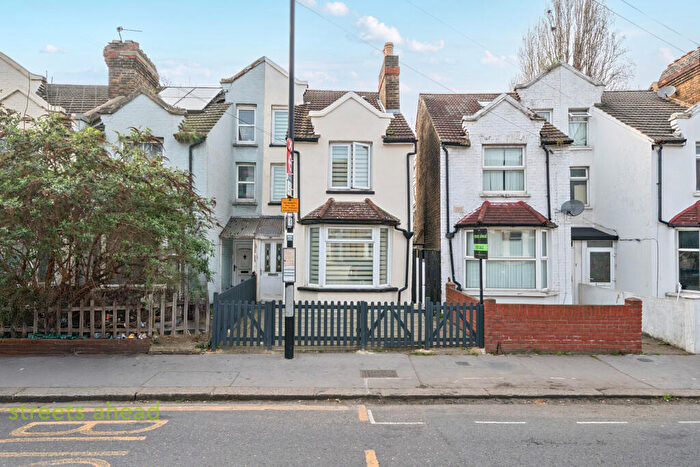
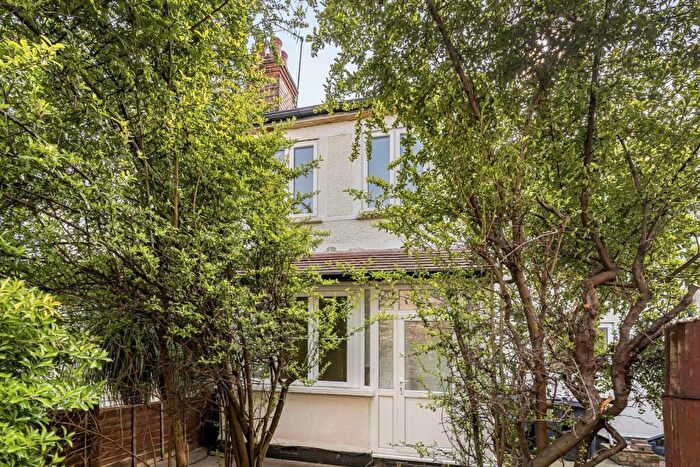
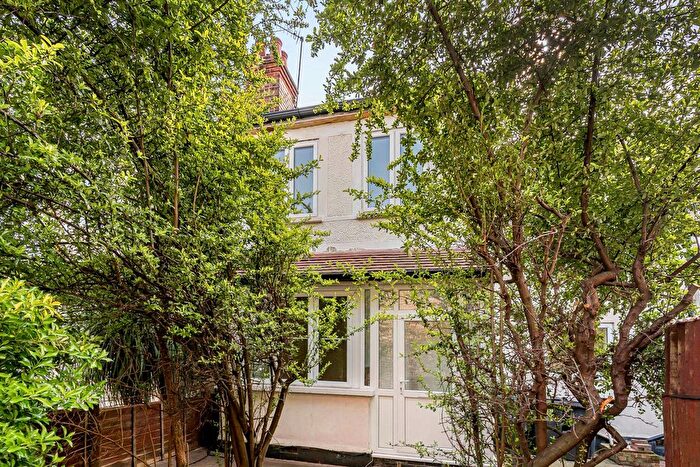
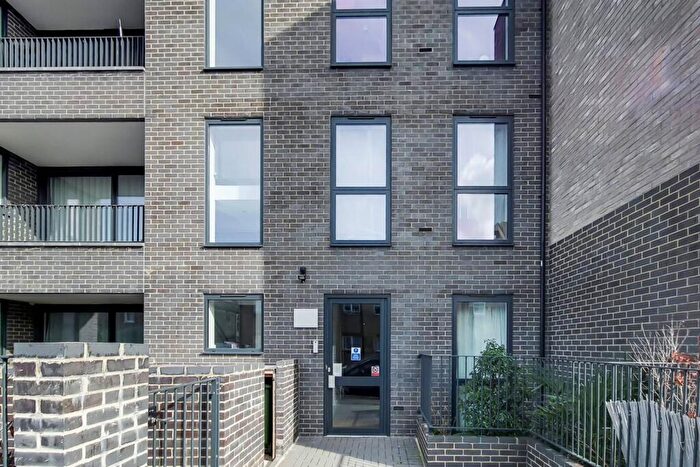
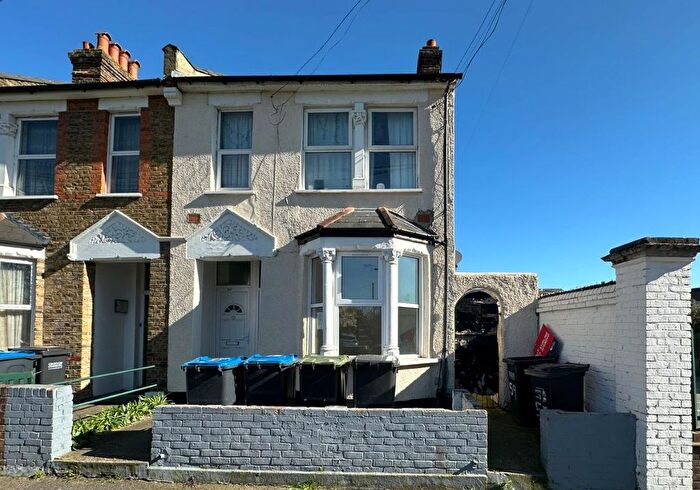
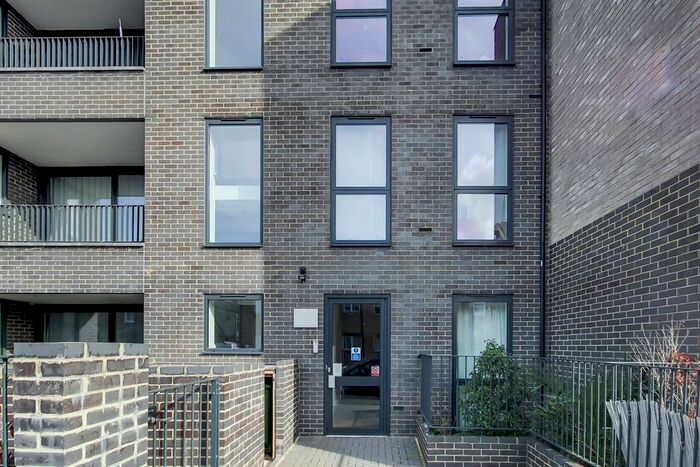
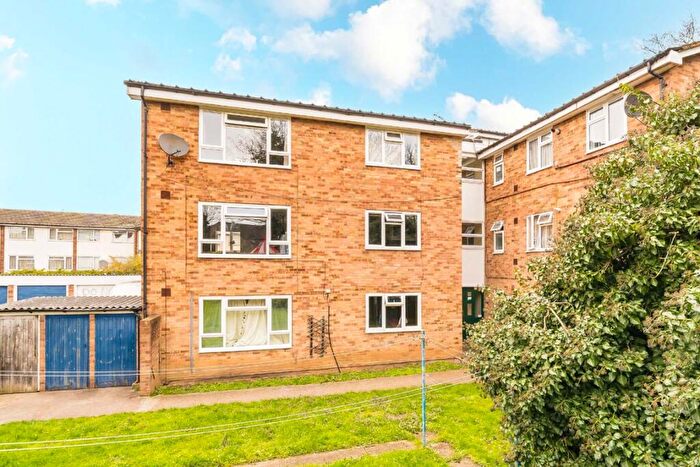
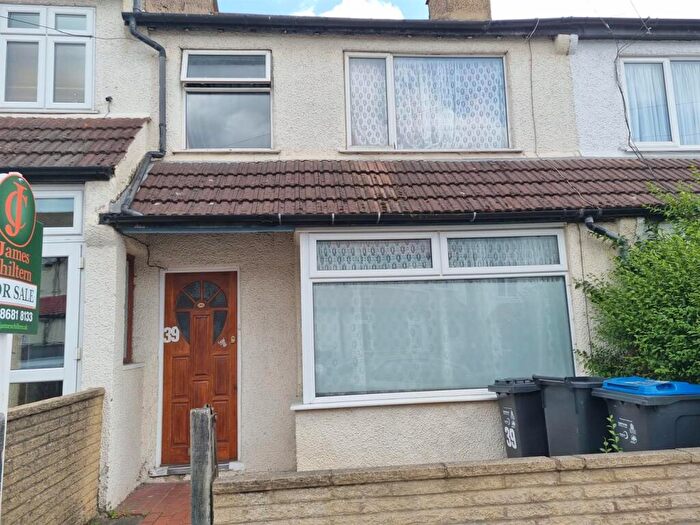
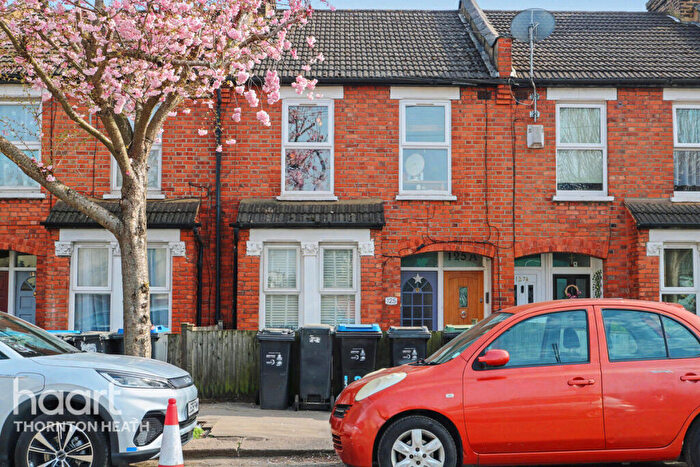
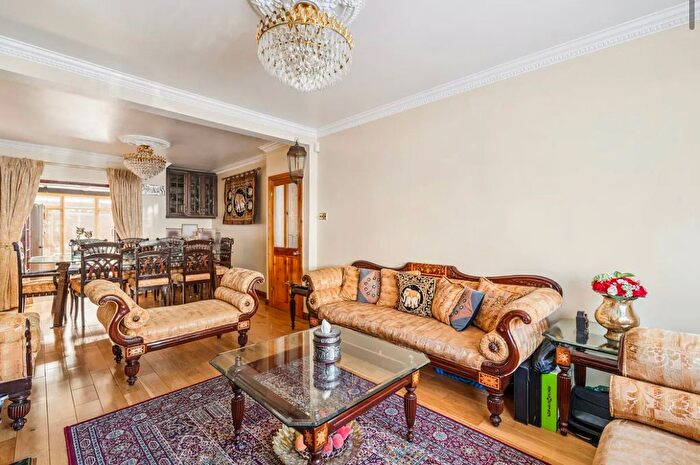
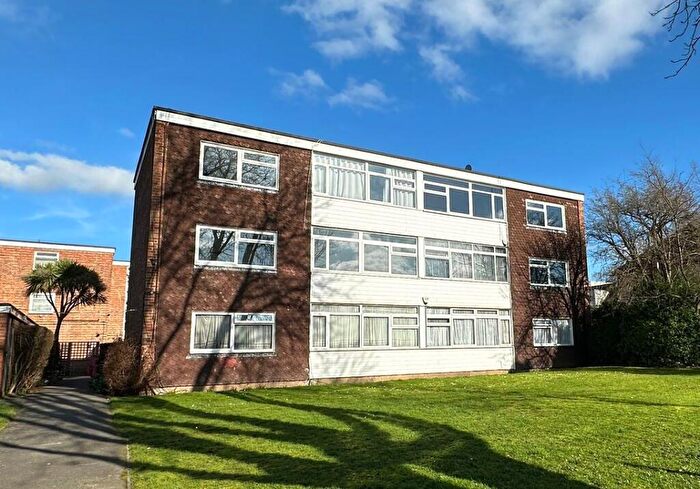
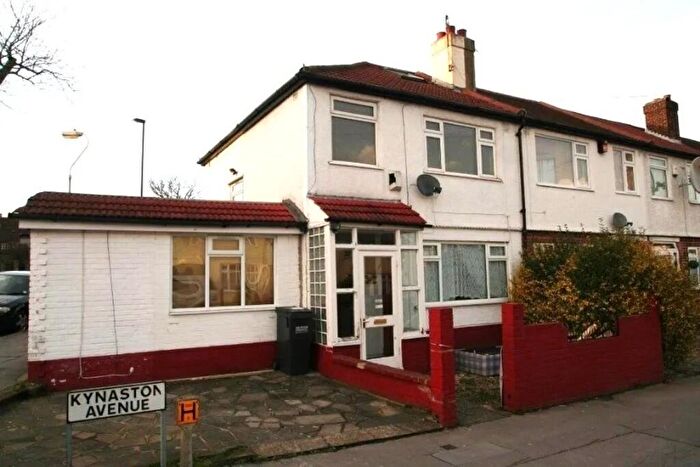
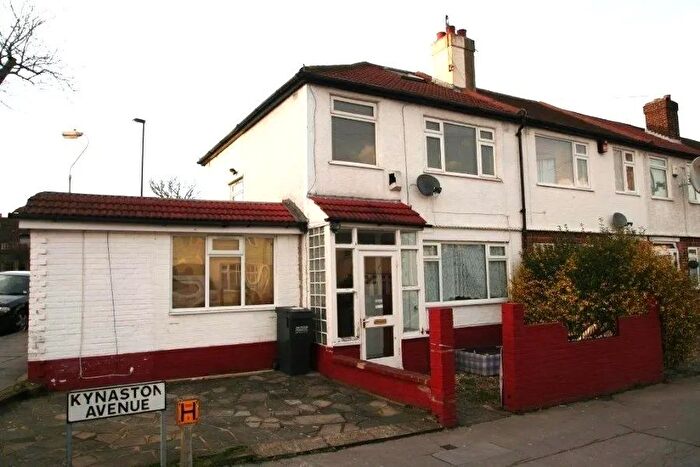
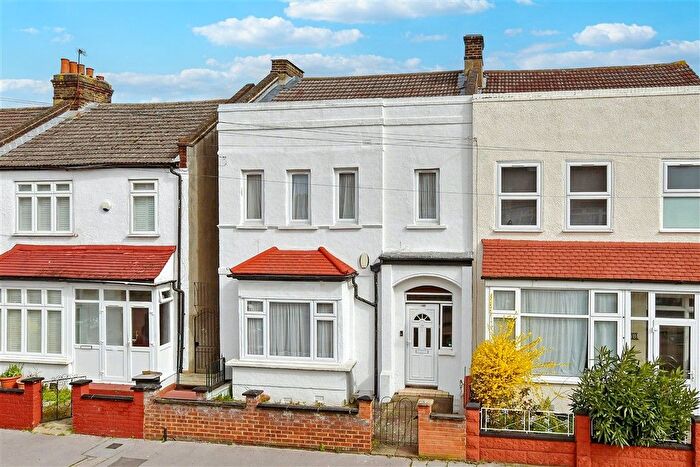
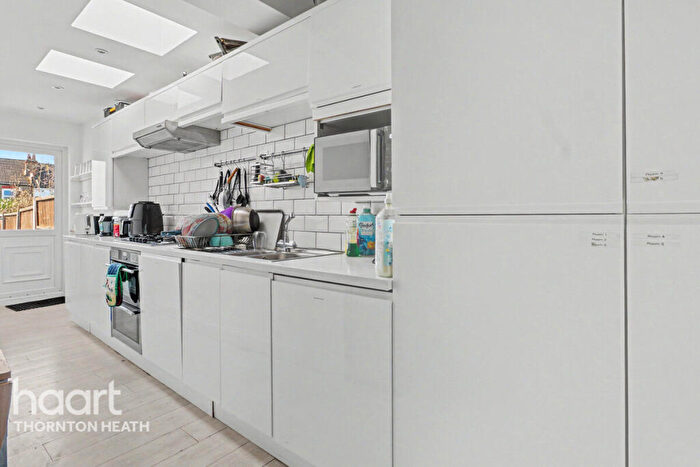
Properties for sale in Bensham Manor
![]()
If you are looking to sell your house, let it out, or receive a property valuation, an expert can help you.
Click the button below to get started.
Roads and Postcodes in Bensham Manor
Navigate through our locations to find the location of your next house in Bensham Manor, Thornton Heath for sale or to rent.
Transport near Bensham Manor
-
 Thornton Heath Station
 -
Selhurst Station
-
Norbury Station
-
 Therapia Lane Station
 -
Ampere Way Station
-
 West Croydon Station
 -
Norwood Junction Station
-
Waddon Marsh Station
-
Centrale Station
-
Reeves Corner Station
- FAQ
- Price Paid By Year
- Property Type Price
Frequently asked questions about Bensham Manor
What is the average price for a property for sale in Bensham Manor?
The average price for a property for sale in Bensham Manor is £375,835. This amount is 0.7% lower than the average price in Thornton Heath. There are 3,612 property listings for sale in Bensham Manor.
What streets have the most expensive properties for sale in Bensham Manor?
The streets with the most expensive properties for sale in Bensham Manor are Colliers Water Lane at an average of £595,000, Stratford Road at an average of £475,714 and Linden Avenue at an average of £471,666.
What streets have the most affordable properties for sale in Bensham Manor?
The streets with the most affordable properties for sale in Bensham Manor are Bennington Close at an average of £94,000, Warwick Gardens at an average of £198,533 and St Christophers Gardens at an average of £218,900.
Which train stations are available in or near Bensham Manor?
Some of the train stations available in or near Bensham Manor are Thornton Heath, Selhurst and Norbury.
Property Price Paid in Bensham Manor by Year
The average sold property price by year was:
| Year | Average Sold Price | Price Change |
Sold Properties
|
|---|---|---|---|
| 2026 | £391,500 | 3% |
2 Properties |
| 2025 | £380,494 | 2% |
122 Properties |
| 2024 | £371,136 | -1% |
142 Properties |
| 2023 | £376,362 | -4% |
128 Properties |
| 2022 | £392,638 | 8% |
134 Properties |
| 2021 | £360,293 | 7% |
203 Properties |
| 2020 | £336,753 | 2% |
123 Properties |
| 2019 | £331,639 | 3% |
152 Properties |
| 2018 | £323,022 | -7% |
127 Properties |
| 2017 | £346,737 | 8% |
139 Properties |
| 2016 | £320,141 | 15% |
187 Properties |
| 2015 | £272,738 | 13% |
199 Properties |
| 2014 | £237,453 | 9% |
210 Properties |
| 2013 | £217,036 | 5% |
132 Properties |
| 2012 | £206,262 | 2% |
107 Properties |
| 2011 | £201,821 | 4% |
86 Properties |
| 2010 | £193,057 | 1% |
119 Properties |
| 2009 | £191,401 | -14% |
84 Properties |
| 2008 | £217,780 | 1% |
151 Properties |
| 2007 | £215,782 | 8% |
303 Properties |
| 2006 | £198,264 | 7% |
262 Properties |
| 2005 | £183,606 | 2% |
235 Properties |
| 2004 | £179,423 | 8% |
304 Properties |
| 2003 | £164,496 | 9% |
355 Properties |
| 2002 | £150,040 | 21% |
350 Properties |
| 2001 | £119,245 | 12% |
193 Properties |
| 2000 | £104,830 | 18% |
206 Properties |
| 1999 | £86,097 | 10% |
281 Properties |
| 1998 | £77,569 | 18% |
292 Properties |
| 1997 | £63,849 | 9% |
287 Properties |
| 1996 | £58,042 | 10% |
293 Properties |
| 1995 | £52,241 | - |
228 Properties |
Property Price per Property Type in Bensham Manor
Here you can find historic sold price data in order to help with your property search.
The average Property Paid Price for specific property types in the last three years are:
| Property Type | Average Sold Price | Sold Properties |
|---|---|---|
| Flat | £247,533.00 | 101 Flats |
| Semi Detached House | £454,863.00 | 26 Semi Detached Houses |
| Detached House | £584,250.00 | 4 Detached Houses |
| Terraced House | £414,124.00 | 263 Terraced Houses |