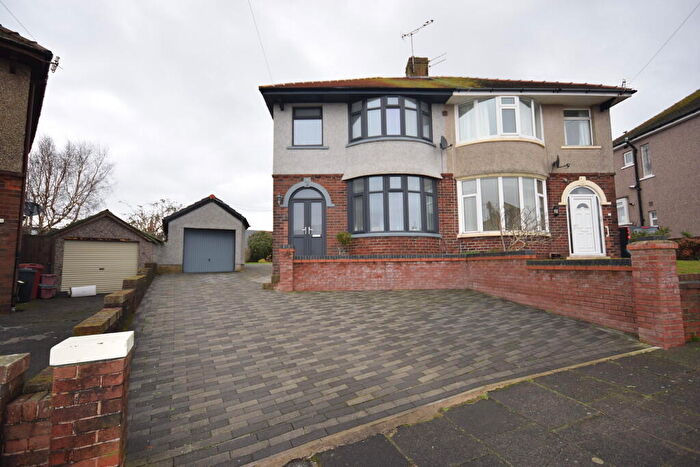
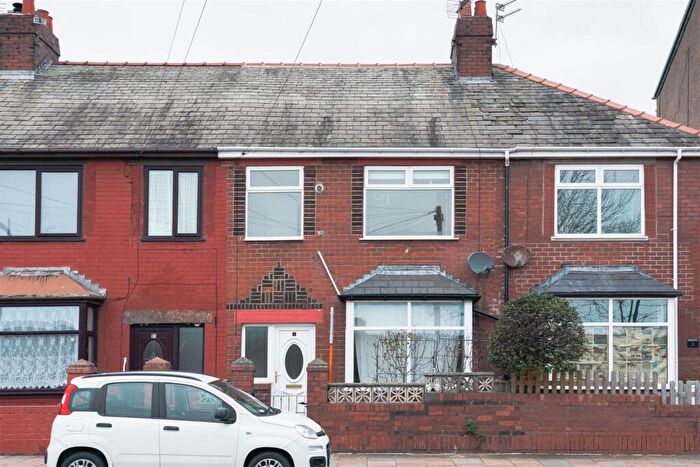
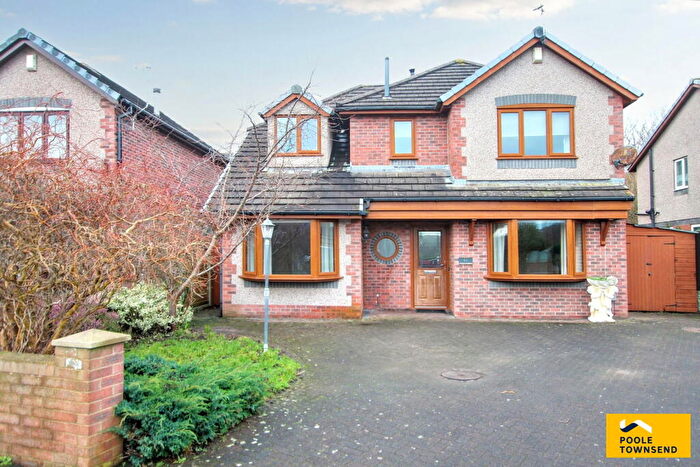
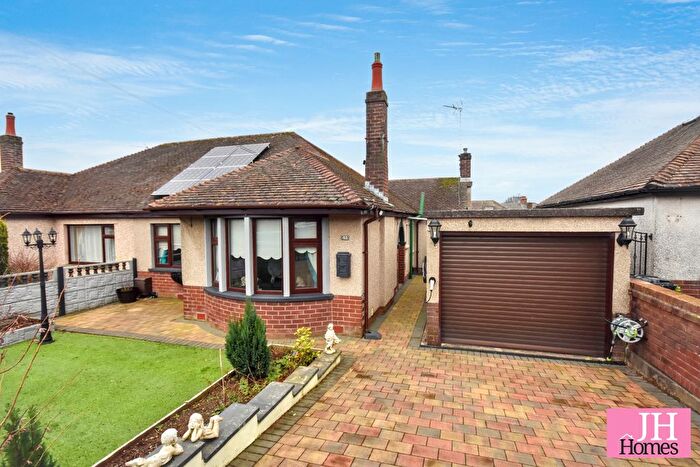
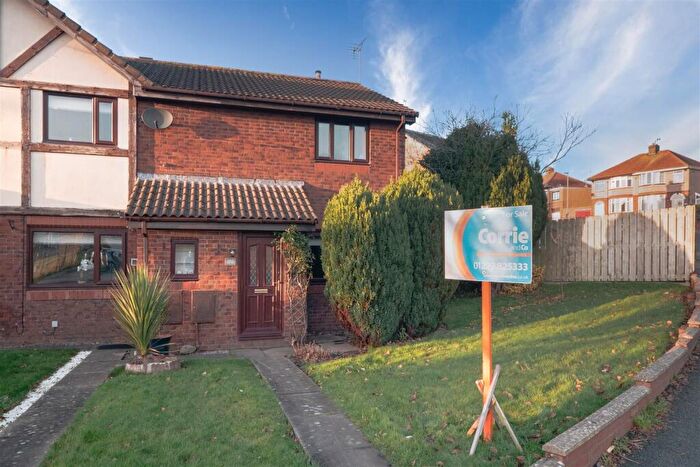
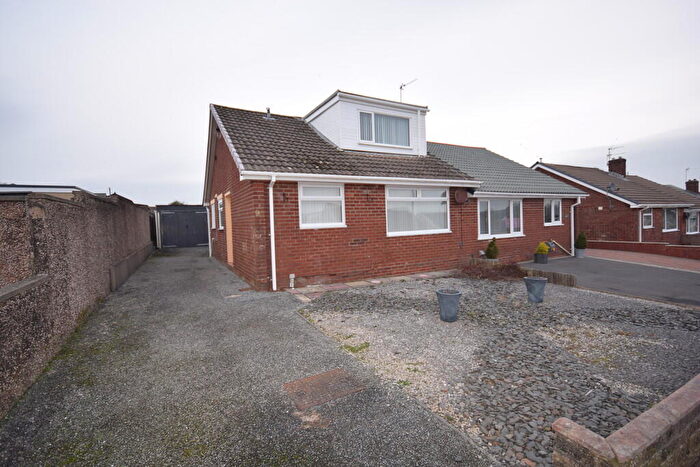
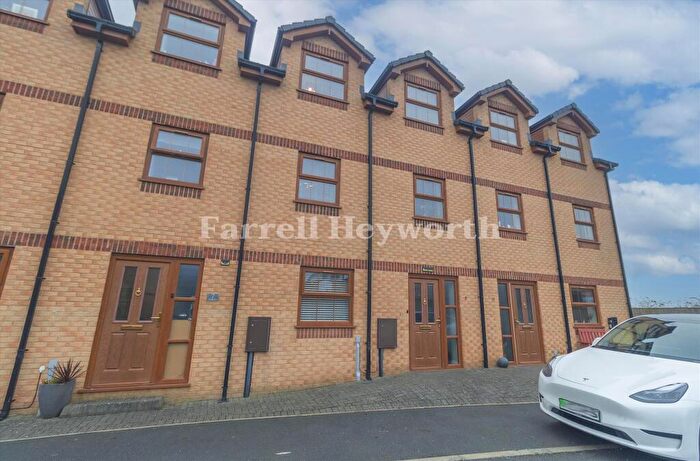
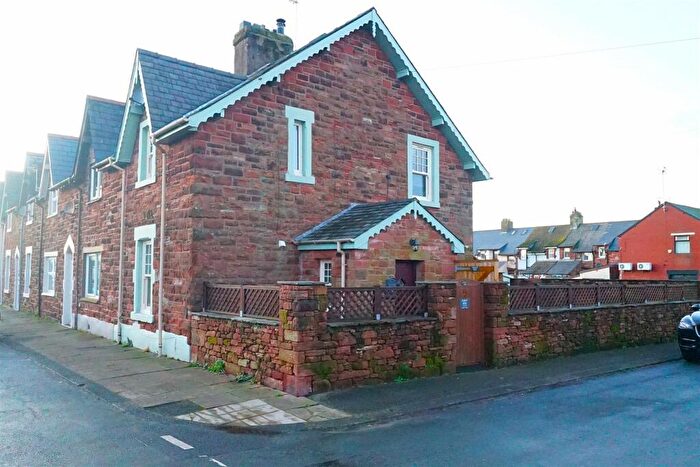
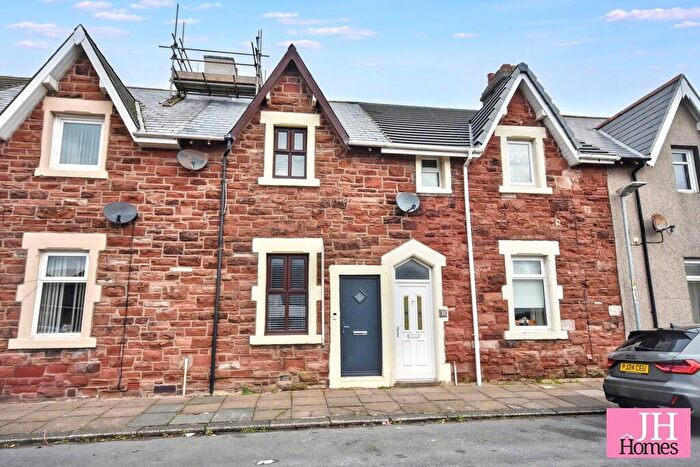
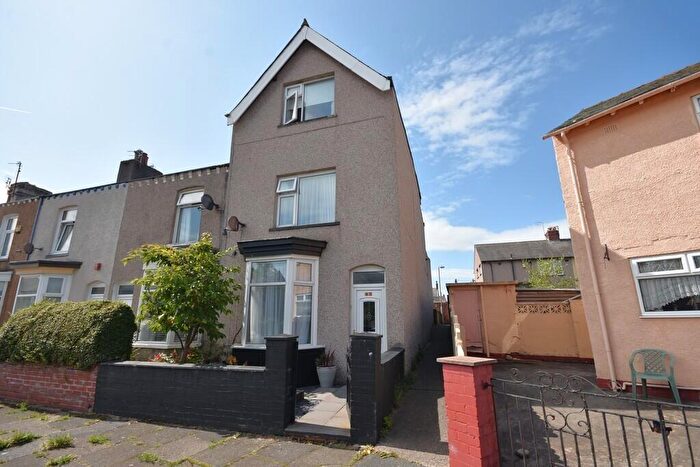
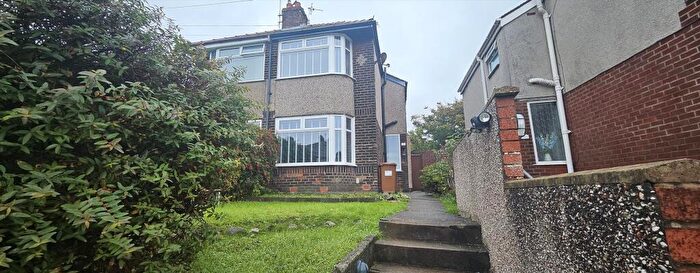
Houses for sale & to rent in Roosecote, Barrow-in-furness
House Prices in Roosecote
Properties in Roosecote have an average house price of £240,894.00 and had 212 Property Transactions within the last 3 years¹.
Roosecote is an area in Barrow-in-furness, Cumbria with 2,052 households², where the most expensive property was sold for £755,000.00.
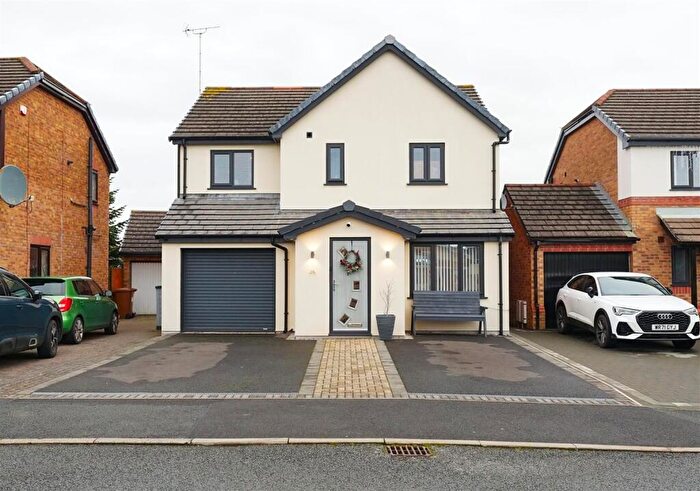
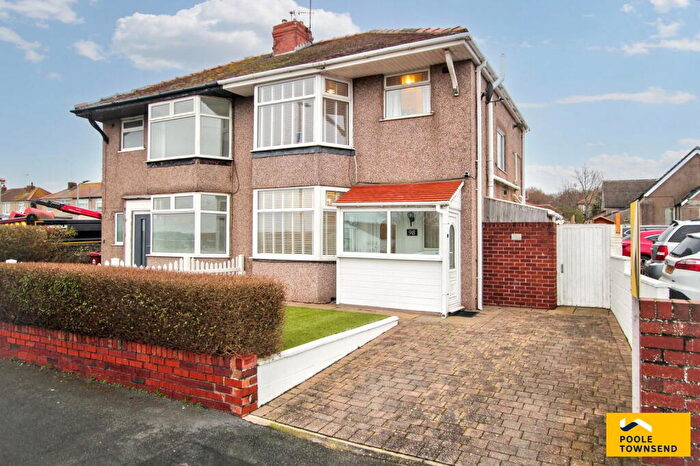
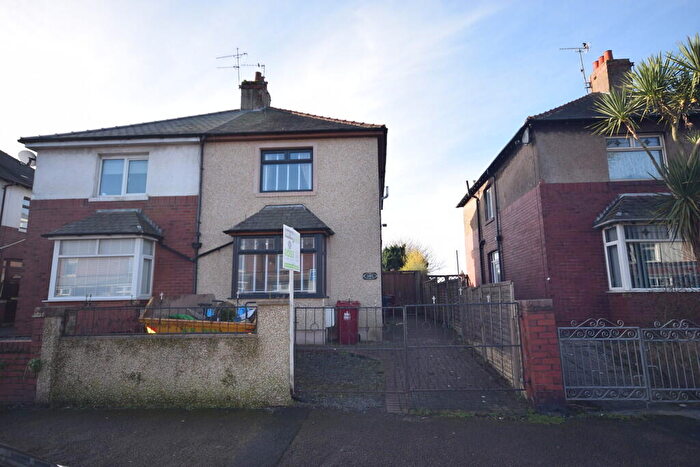
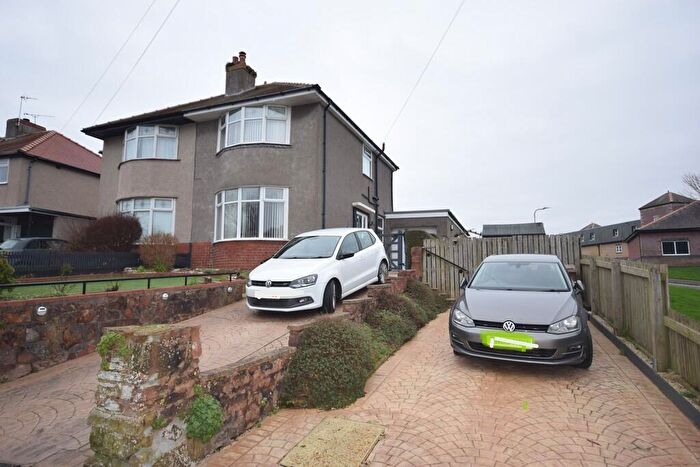
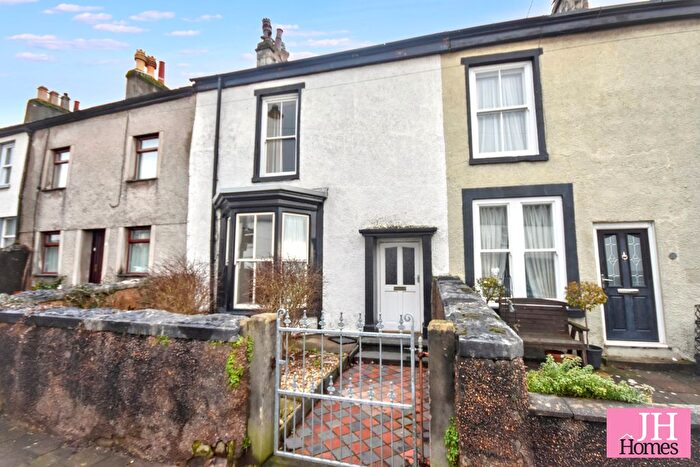
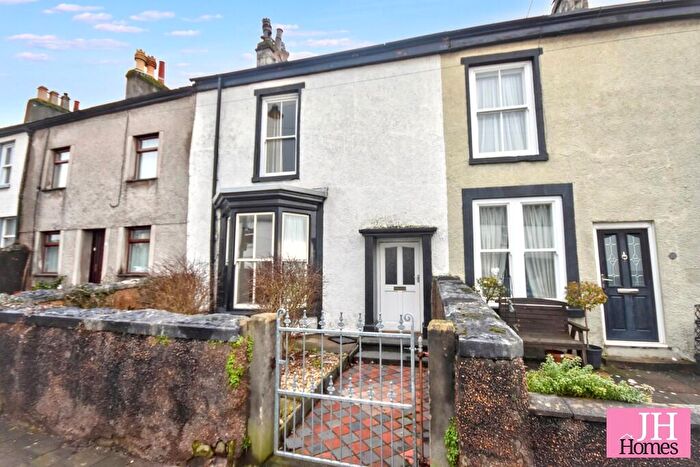
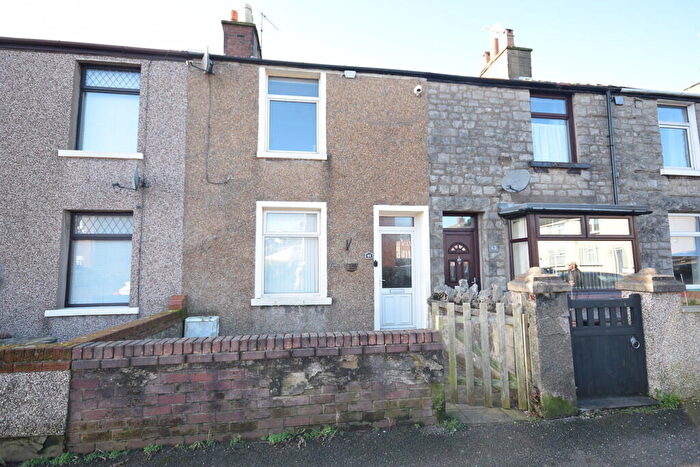
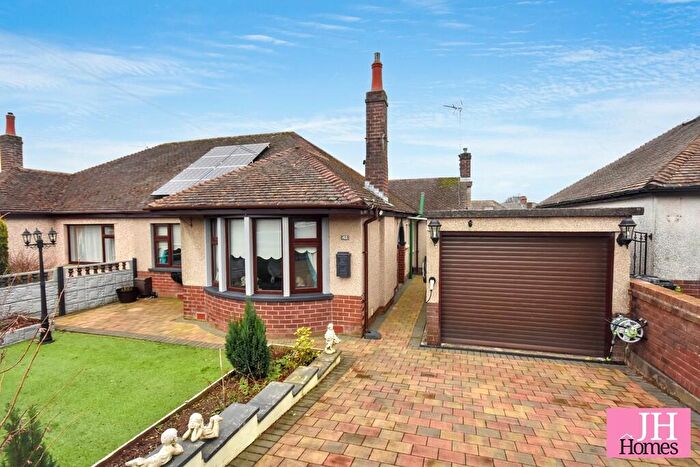
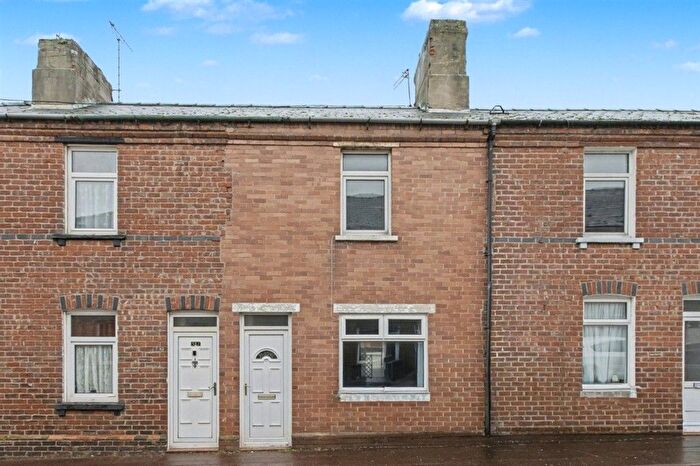
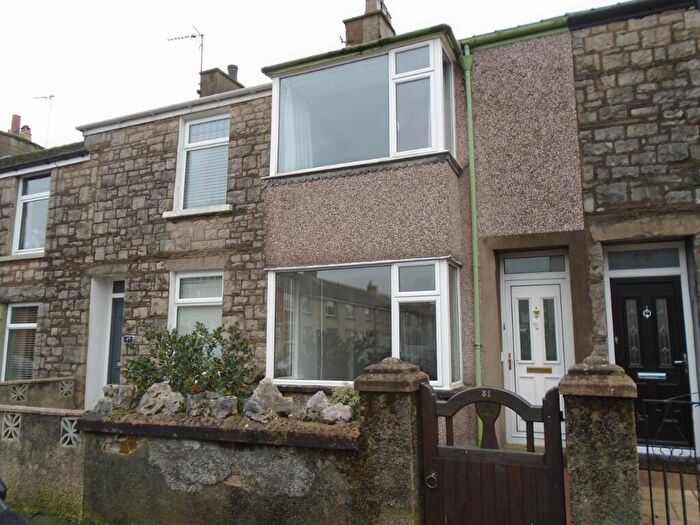
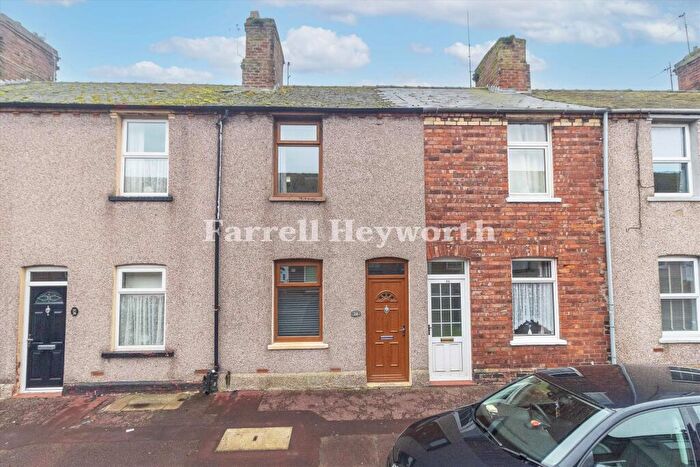
Properties for sale in Roosecote
Roads and Postcodes in Roosecote
Navigate through our locations to find the location of your next house in Roosecote, Barrow-in-furness for sale or to rent.
| Streets | Postcodes |
|---|---|
| Abbey Approach | LA13 0PJ |
| Abbots Wood | LA13 0PH |
| Acacia Close | LA13 0JJ |
| Acorn Bank | LA13 0RP |
| Almond Walk | LA13 0RJ |
| Apple Tree Drive | LA13 0LA |
| Armon Close | LA13 0SY |
| Arundel Drive | LA13 0HT |
| Ashdown Road | LA13 0JP LA13 0JR |
| Aspen Drive | LA13 0RL |
| Azalea Walk | LA13 0RA |
| Balmoral Drive | LA13 0HX LA13 0HY |
| Barwood Grove | LA13 0RZ |
| Belvedere Road | LA13 0HS LA13 0HZ |
| Birch Close | LA13 0RQ |
| Birchfields | LA13 0JL |
| Bow Windows Avenue | LA13 0SF |
| Brennan Close | LA13 0TD |
| Briar Court | LA13 0RS |
| Carisbrooke Crescent | LA13 0HU LA13 0JA |
| Carmelite Way | LA13 0TP |
| Cherry Tree Way | LA13 0LG |
| Chestnut Walk | LA13 0JB |
| Coast Road | LA13 0QW |
| Concle Terrace | LA13 0QF |
| Crofters Crescent | LA13 0UD |
| Cypress Walk | LA13 0JY |
| Dowie Close | LA13 0SZ |
| Dungeon Lane | LA13 0QY |
| Fir Tree Rise | LA13 0RY |
| Grey Friar Close | LA13 0TW |
| Hall Garth | LA13 0QT |
| Hawthorn Drive | LA13 0RF LA13 0RU |
| Heather Bank | LA13 0RT |
| Holbeck Park Avenue | LA13 0LQ LA13 0RE LA13 0RG LA13 0SB LA13 0UA |
| Holebeck Road | LA13 0HR |
| Hornbeam Crescent | LA13 0JS |
| Kempas Avenue | LA13 0UE |
| Lancewood Crescent | LA13 0UG |
| Larch Rise | LA13 0JZ |
| Laurel Drive | LA13 0RD |
| Leece Lane | LA13 0JH LA13 0JQ LA13 0LN LA13 0EB LA13 0JG |
| Liddle Close | LA13 0SW |
| Marine Terrace | LA13 0QQ |
| Moorhead Cottages | LA13 0PS |
| Mulberry Way | LA13 0RH LA13 0RR |
| North Row | LA13 0HE LA13 0HF LA13 0HG LA13 0HQ |
| Oakwood Drive | LA13 0UB |
| Old Rampside Road | LA13 0TA |
| Old Roose | LA13 0ET |
| Overbeck Drive | LA13 0HD |
| Peartree Bank | LA13 0LF |
| Peasholmes Lane | LA13 0PZ LA13 0QA LA13 0QB |
| Piel Island Cottages | LA13 0QN |
| Piel Street | LA13 0QJ LA13 0QL |
| Poplar Bank | LA13 0RB |
| Princewood Drive | LA13 0RX |
| Rampside | LA13 0PU LA13 0PX LA13 0PY LA13 0QR |
| Rampside Road | LA13 0HN LA13 0HP LA13 0PT LA13 0PP LA13 0QS LA13 0QU LA13 0QZ |
| Redoak Avenue | LA13 0JT LA13 0JU LA13 0LE LA13 0LJ LA13 0RN LA13 0LH |
| Redshaw Avenue | LA13 0SU |
| Roa Island Road | LA13 0PN |
| Roose Farm Lane | LA13 0HB |
| Roose Road | LA13 0EP |
| Roosecote Terrace | LA13 0TB |
| Rosewood Grove | LA13 0UF |
| Rowan Drive | LA13 0JN LA13 0JW |
| Salthouse Mills Industrial Estate | LA13 0DH |
| Sandalwood Close | LA13 0SD |
| Sedgefield Road | LA13 0TN |
| South Row | LA13 0HJ LA13 0HL |
| Spruce Rise | LA13 0RW |
| St Michaels Road | LA13 0QD |
| Stank Lane | LA13 0LR |
| Stone Dyke | LA13 0LW |
| Stone Dyke Lane | LA13 0HH |
| Stoneham Close | LA13 0SX |
| Tower Street | LA13 0QH |
| Trinity Terrace | LA13 0QG |
| Walnut Hill | LA13 0JX |
| Waver Court | LA13 0PR |
| West Row | LA13 0HW |
| Whitebeam Gardens | LA13 0LB |
| Woodhill Crescent | LA13 0QE |
| Yarlside Crescent | LA13 0EZ |
| Yarlside Road | LA13 0ER LA13 0ES LA13 0EU LA13 0EX LA13 0EY LA13 0HA |
| LA13 0LS |
Transport near Roosecote
- FAQ
- Price Paid By Year
- Property Type Price
Frequently asked questions about Roosecote
What is the average price for a property for sale in Roosecote?
The average price for a property for sale in Roosecote is £240,894. This amount is 54% higher than the average price in Barrow-in-furness. There are 4,208 property listings for sale in Roosecote.
What streets have the most expensive properties for sale in Roosecote?
The streets with the most expensive properties for sale in Roosecote are Abbots Wood at an average of £740,000, Peasholmes Lane at an average of £640,000 and Hall Garth at an average of £430,833.
What streets have the most affordable properties for sale in Roosecote?
The streets with the most affordable properties for sale in Roosecote are Piel Island Cottages at an average of £50,000, Briar Court at an average of £110,000 and Old Roose at an average of £114,000.
Which train stations are available in or near Roosecote?
Some of the train stations available in or near Roosecote are Roose, Barrow-In-Furness and Dalton.
Property Price Paid in Roosecote by Year
The average sold property price by year was:
| Year | Average Sold Price | Price Change |
Sold Properties
|
|---|---|---|---|
| 2025 | £281,018 | 19% |
71 Properties |
| 2024 | £228,786 | 10% |
91 Properties |
| 2023 | £205,956 | -10% |
50 Properties |
| 2022 | £226,442 | 1% |
85 Properties |
| 2021 | £224,840 | 14% |
136 Properties |
| 2020 | £194,447 | 0,1% |
68 Properties |
| 2019 | £194,325 | -1% |
102 Properties |
| 2018 | £196,760 | 2% |
90 Properties |
| 2017 | £192,623 | 5% |
88 Properties |
| 2016 | £183,905 | 2% |
98 Properties |
| 2015 | £180,676 | 1% |
91 Properties |
| 2014 | £178,844 | 9% |
88 Properties |
| 2013 | £162,678 | -4% |
87 Properties |
| 2012 | £169,969 | 3% |
63 Properties |
| 2011 | £164,623 | 6% |
74 Properties |
| 2010 | £155,475 | -2% |
71 Properties |
| 2009 | £158,468 | -8% |
74 Properties |
| 2008 | £171,804 | -2% |
59 Properties |
| 2007 | £175,088 | 8% |
116 Properties |
| 2006 | £161,623 | 5% |
124 Properties |
| 2005 | £153,468 | 14% |
113 Properties |
| 2004 | £131,510 | 24% |
113 Properties |
| 2003 | £100,437 | 10% |
129 Properties |
| 2002 | £90,476 | 17% |
141 Properties |
| 2001 | £75,358 | 15% |
106 Properties |
| 2000 | £64,064 | 1% |
85 Properties |
| 1999 | £63,388 | 13% |
101 Properties |
| 1998 | £54,985 | 2% |
87 Properties |
| 1997 | £54,098 | 9% |
73 Properties |
| 1996 | £49,437 | 2% |
73 Properties |
| 1995 | £48,401 | - |
79 Properties |
Property Price per Property Type in Roosecote
Here you can find historic sold price data in order to help with your property search.
The average Property Paid Price for specific property types in the last three years are:
| Property Type | Average Sold Price | Sold Properties |
|---|---|---|
| Semi Detached House | £239,543.00 | 89 Semi Detached Houses |
| Detached House | £305,676.00 | 68 Detached Houses |
| Terraced House | £168,652.00 | 48 Terraced Houses |
| Flat | £124,135.00 | 7 Flats |

