
Houses for sale in Cumbria, England
House Prices in Cumbria
Properties in Cumbria have
an average house price of
£224k
and had 25,450 Property Transactions
within the last 3 years.¹
Cumbria is a location in
England with
229,810 households², where the most expensive property was sold for £8.1M.
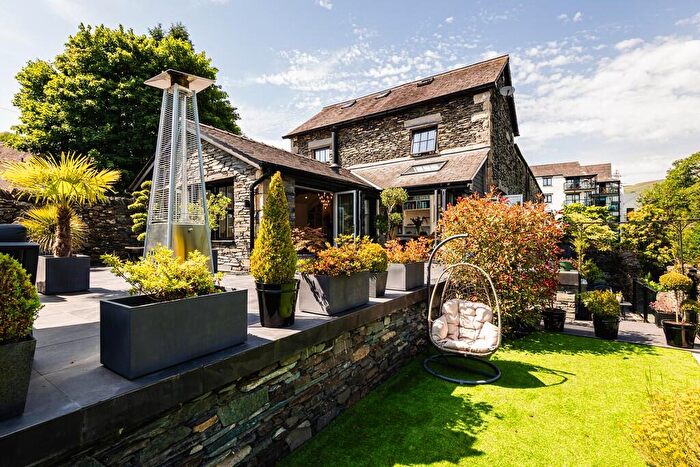
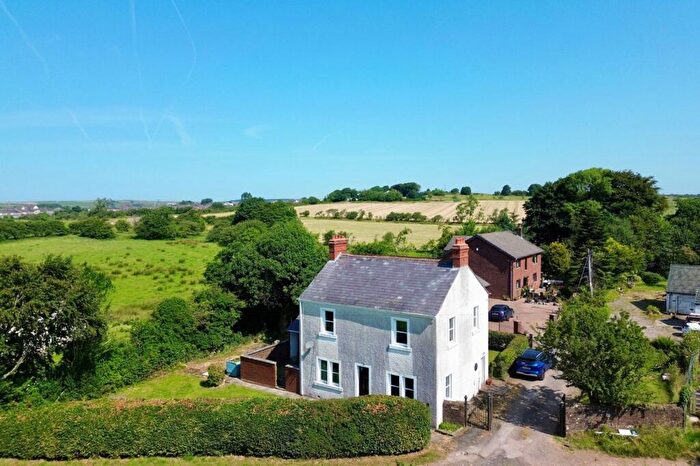
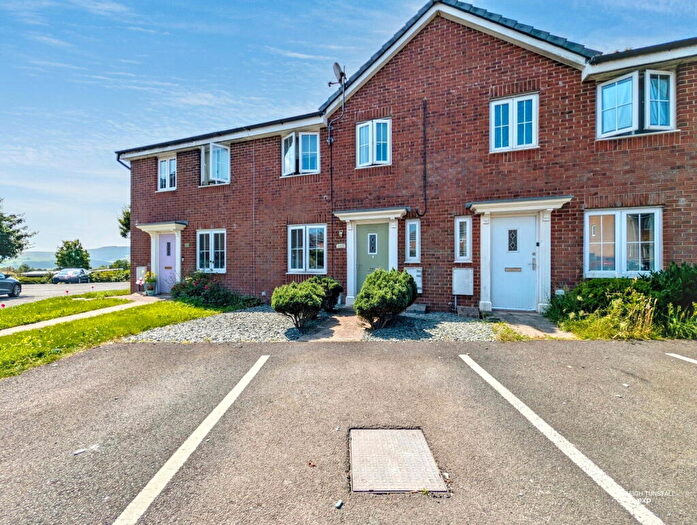
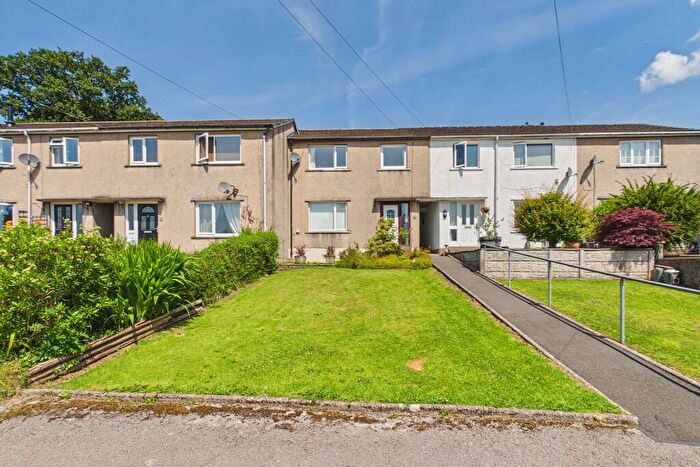
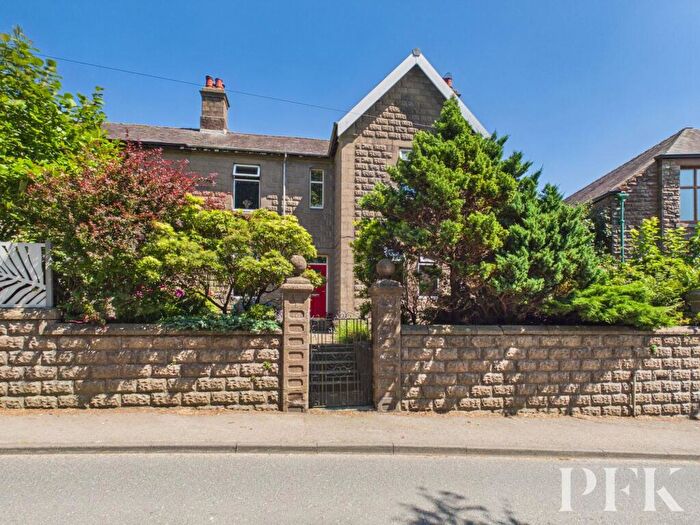
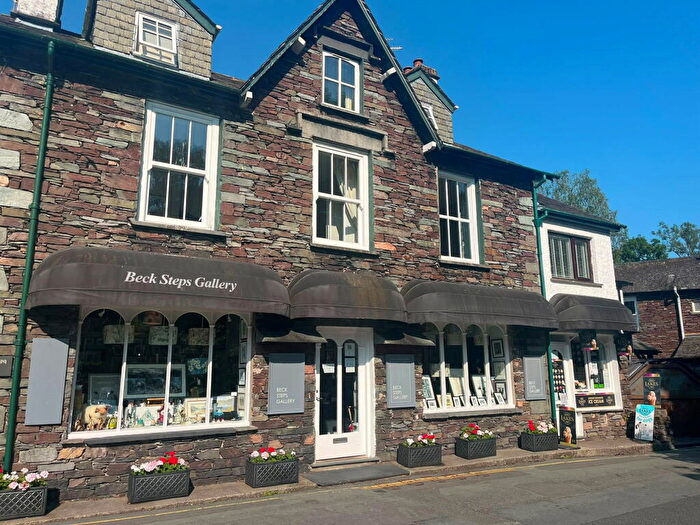
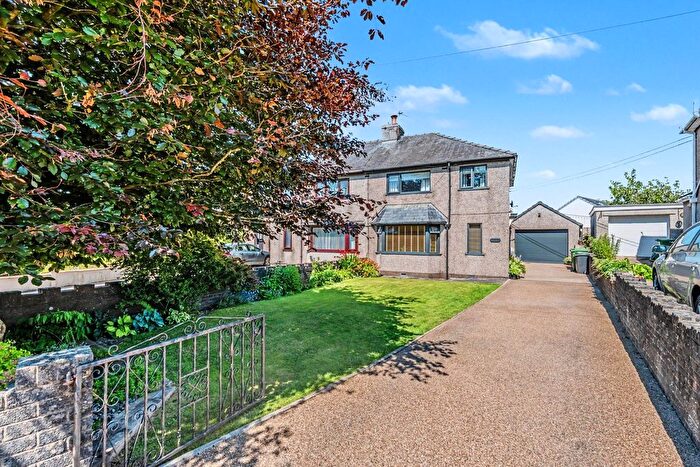
Properties for sale in Cumbria
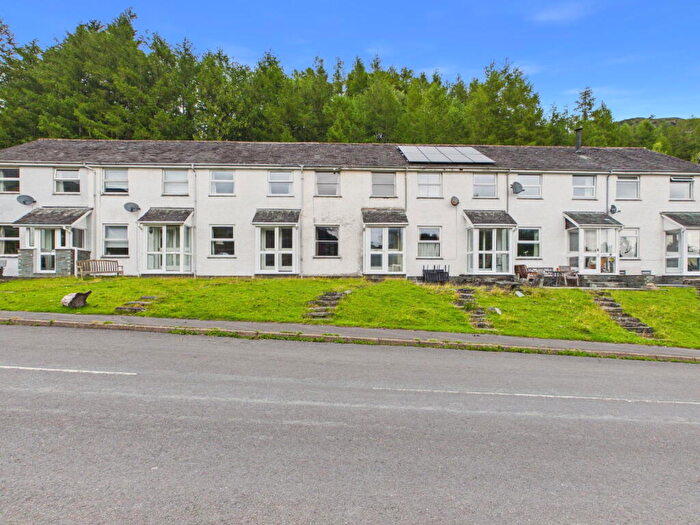
![]()
If you are looking to sell your house, let it out, or receive a property valuation, an expert can help you.
Click the button below to get started.


Towns in Cumbria
Navigate through our locations to find the location of your next house in Cumbria, England for sale or to rent.
- Ulverston
- Coniston
- Newcastleton
- Penrith
- Egremont
- Cleator Moor
- Whitehaven
- Grange-over-sands
- Moor Row
- Workington
- Millom
- Maryport
- Broughton-in-furness
- Seascale
- Beckermet
- St Bees
- Carnforth
- Kirkby Stephen
- Kendal
- Milnthorpe
- Dalton-in-furness
- Sedbergh
- Ravenglass
- Alston
- Appleby-in-westmorland
- Carlisle
- Brampton
- Keswick
- Askam-in-furness
- Holmrook
- Cockermouth
- Cleator
- Ambleside
- Wigton
- Windermere
- Kirkby-in-furness
- Barrow-in-furness
- Frizington
- Gretna
Property price trends in Cumbria
According to the latest Land Registry data, the average home in Cumbria sold for £223,087 in 2026. That figure comes from a substantial record of 281,886 sales logged over the past 31 years.
Prices have held fairly steady over the last three years. Compared with 2023, when the typical sale came in around £220,735, values are broadly unchanged.
Looking back five years, average prices are up about 4.2% since 2021, a gain of around £9,078 in cash terms.
Zoom out to the past decade for the fuller picture. Back in 2016, homes here averaged £178,501, so the typical sold price has climbed about 25% since then, roughly 2.3% a year. Stretch the view to fifteen years and that annual pace holds at about 2.1%.
Frequently asked questions about Cumbria
What is the average price for a property for sale in Cumbria?
The average price for a property for sale in Cumbria is £224,148. This amount is 38% lower than the average price in England. There are more than 10,000 property listings for sale in Cumbria.
What locations have the most expensive properties for sale in Cumbria?
The locations with the most expensive properties for sale in Cumbria are Ambleside at an average of £560,676, Windermere at an average of £487,548 and Coniston at an average of £465,915.
What locations have the most affordable properties for sale in Cumbria?
The locations with the most affordable properties for sale in Cumbria are Moor Row at an average of £117,453, Millom at an average of £138,833 and Cleator at an average of £144,194.
Which train stations are available in or near Cumbria?
Some of the train stations available in or near Cumbria are Windermere, Penrith and Staveley (Cumbria).
Property Price Paid in Cumbria by Year
The average sold property price by year was:
| Year | Average Sold Price | Price Change |
Sold Properties
|
|---|---|---|---|
| 2026 | £223,087 | -1% |
1,587 Properties |
| 2025 | £226,294 | 0,3% |
8,032 Properties |
| 2024 | £225,558 | 2% |
7,977 Properties |
| 2023 | £220,735 | -2% |
7,854 Properties |
| 2022 | £224,241 | 5% |
9,112 Properties |
| 2021 | £214,009 | 5% |
11,394 Properties |
| 2020 | £203,088 | 4% |
8,399 Properties |
| 2019 | £193,976 | 2% |
9,263 Properties |
| 2018 | £190,437 | 2% |
9,426 Properties |
| 2017 | £187,575 | 5% |
9,433 Properties |
Property Price per Property Type in Cumbria
Here you can find historic sold price data in order to help with your property search.
The average Property Paid Price for specific property types in the last three years are:
| Property Type | Average Sold Price | Sold Properties |
|---|---|---|
| Semi Detached House | £213,078.00 | 7,487 Semi Detached Houses |
| Terraced House | £149,857.00 | 10,015 Terraced Houses |
| Detached House | £385,597.00 | 5,960 Detached Houses |
| Flat | £156,071.00 | 1,988 Flats |
Transport in Cumbria
Please see below transportation links in this area:
