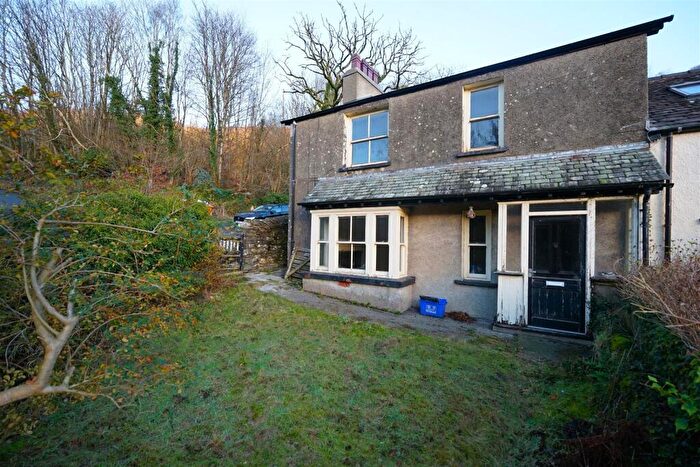
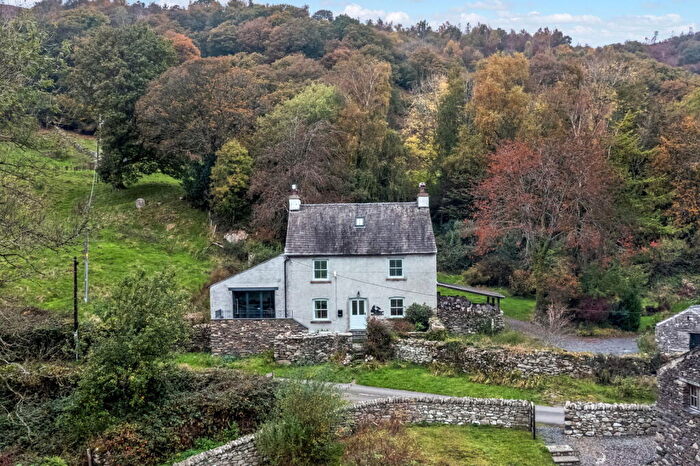
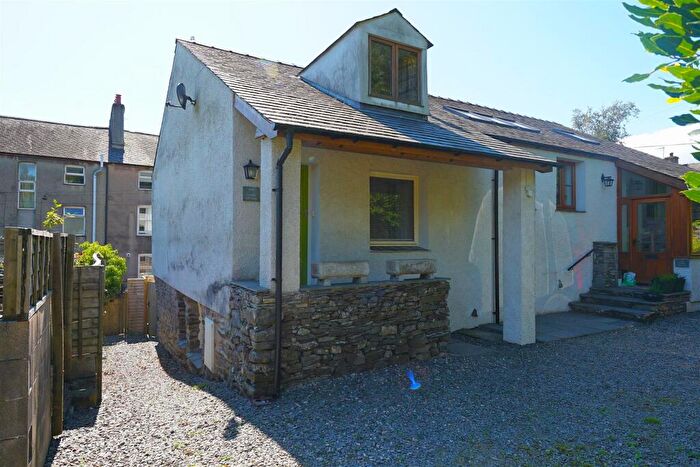
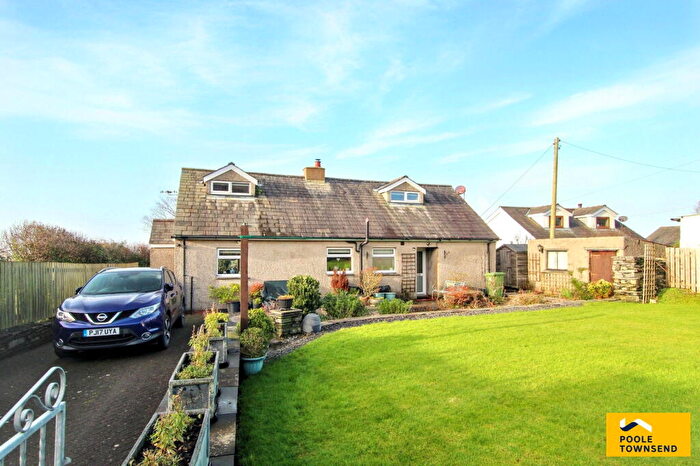
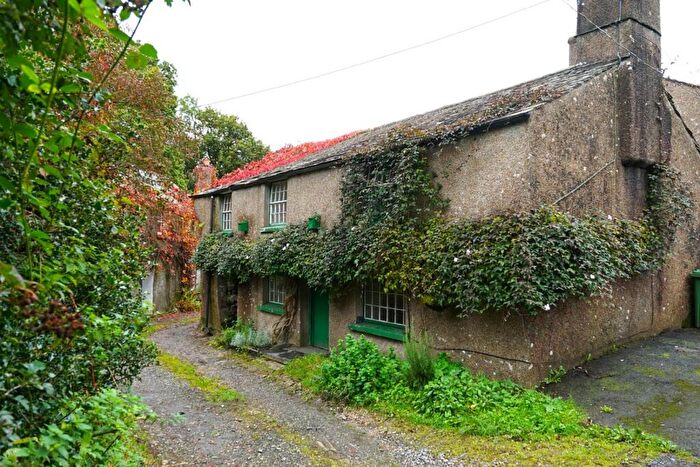
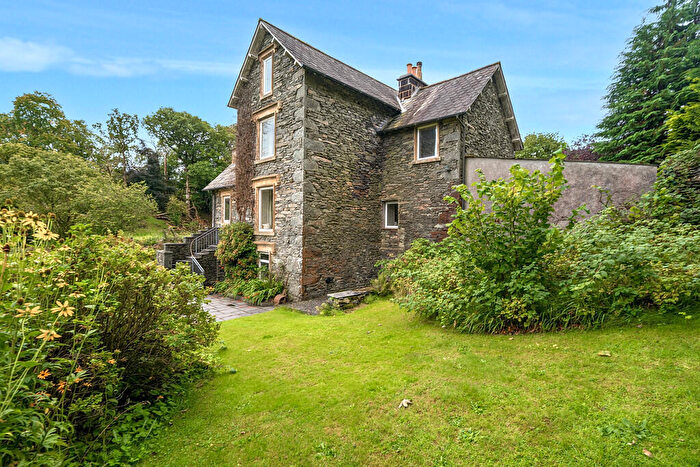
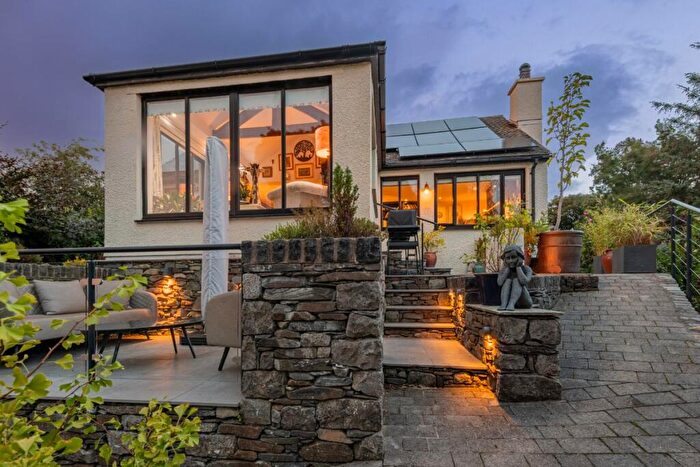
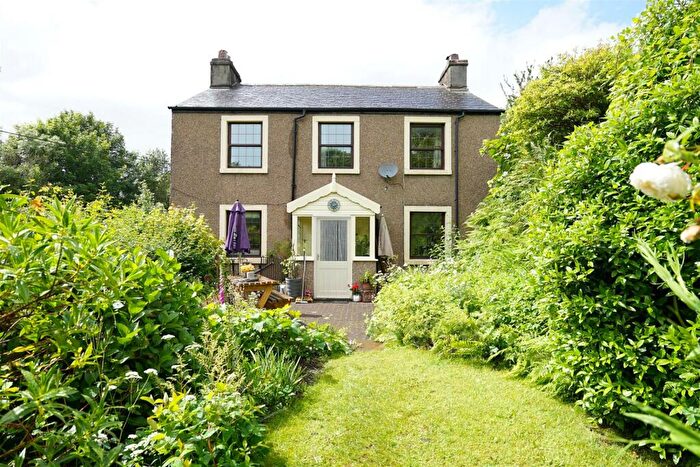
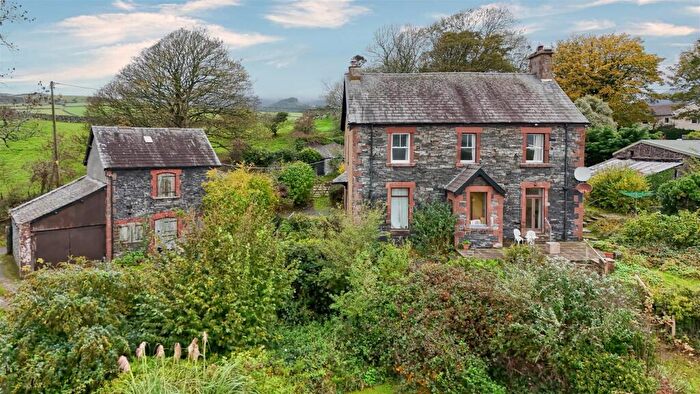
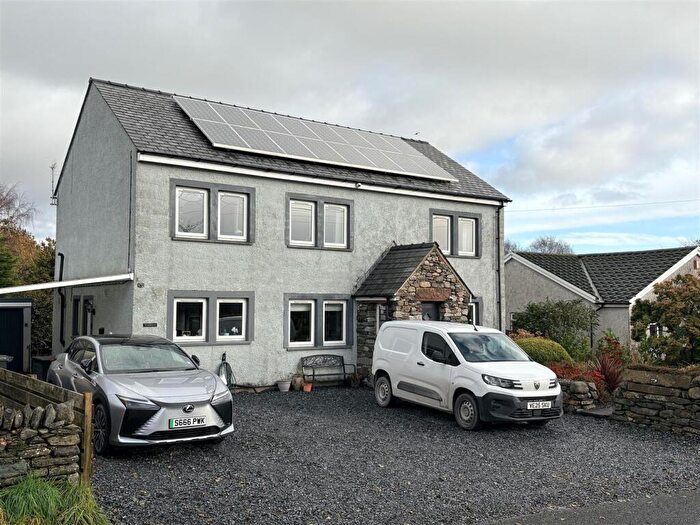
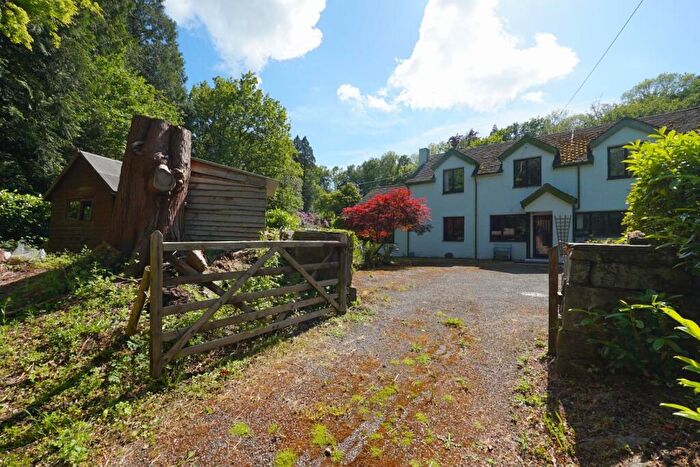
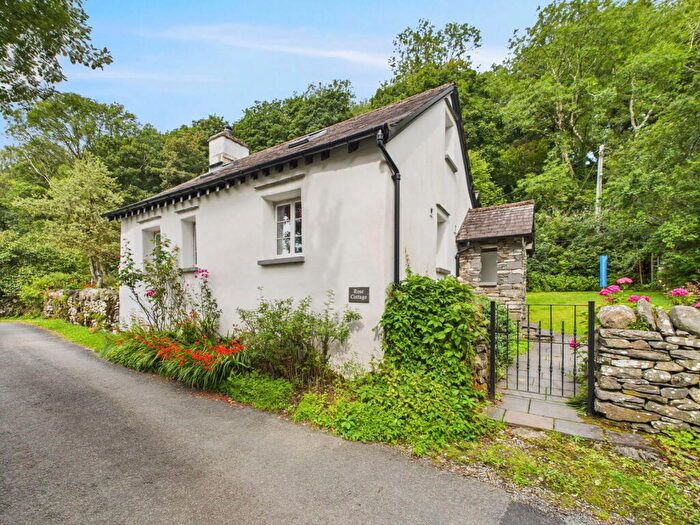
Houses for sale & to rent in Broughton, Broughton-in-furness
House Prices in Broughton
Properties in Broughton have an average house price of £344,914.00 and had 40 Property Transactions within the last 3 years¹.
Broughton is an area in Broughton-in-furness, Cumbria with 427 households², where the most expensive property was sold for £995,000.00.
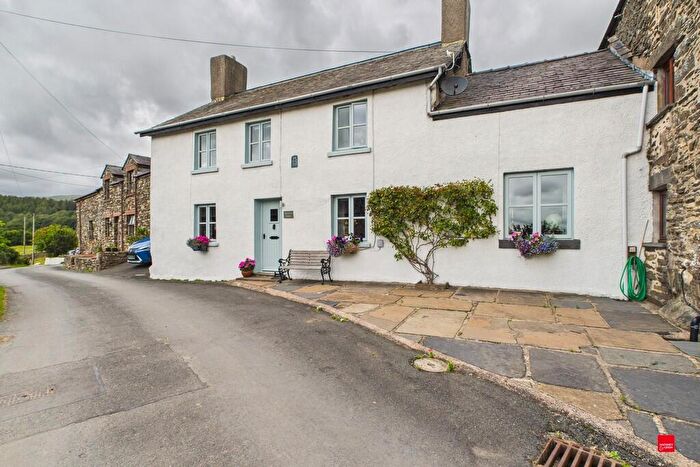
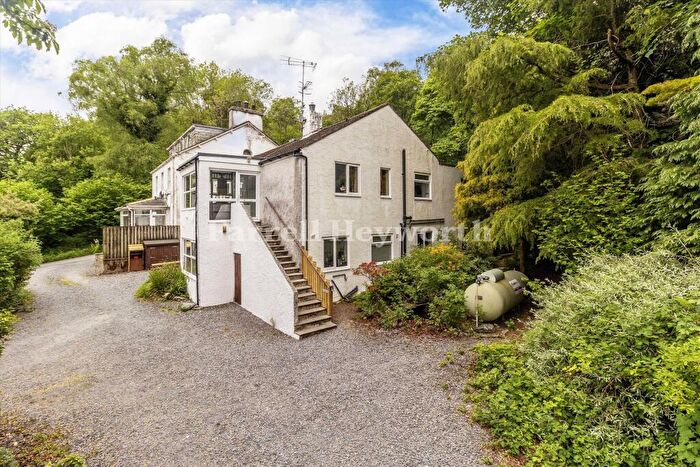
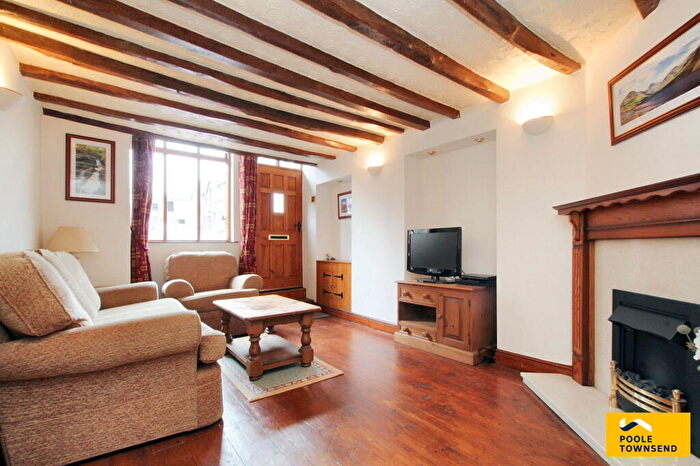
Properties for sale in Broughton
Roads and Postcodes in Broughton
Navigate through our locations to find the location of your next house in Broughton, Broughton-in-furness for sale or to rent.
| Streets | Postcodes |
|---|---|
| Bank End | LA20 6DR |
| Brade Street | LA20 6HG |
| Broom Close | LA20 6JG |
| Broughton Mills | LA20 6AX LA20 6AY |
| Broughton Park | LA20 6HB |
| Church Street | LA20 6ER LA20 6HA LA20 6HJ |
| Cinder Hill | LA20 6HS |
| Copper Rigg | LA20 6AJ |
| Duddon Mews | LA20 6BE |
| Foxfield Road | LA20 6EZ |
| Griffin Street | LA20 6HH |
| High Kepplewray | LA20 6BL |
| Kepplewray Hill | LA20 6BH |
| Knott Lane | LA20 6HT |
| Laurel Cottage | LA20 6HU |
| Long House Cottages | LA20 6EE |
| Market Street | LA20 6HP |
| New Street | LA20 6JD |
| Occupation Lane | LA20 6HD |
| Princes Street | LA20 6HQ |
| Sawrey Court | LA20 6JQ |
| Station Road | LA20 6HN |
| The Square | LA20 6HY LA20 6HZ LA20 6JA LA20 6JB LA20 6JF |
| Timber Hill | LA20 6HX |
| Ulpha Bridge Houses | LA20 6DT |
| Woodland | LA20 6AE LA20 6AG LA20 6AQ LA20 6DF LA20 6DG LA20 6DJ |
| LA20 6AA LA20 6AD LA20 6AR LA20 6AT LA20 6BA LA20 6BD LA20 6BP LA20 6BS LA20 6BT LA20 6BU LA20 6BW LA20 6BX LA20 6BY LA20 6DS LA20 6EB LA20 6ED LA20 6ES LA20 6JE |
Transport near Broughton
- FAQ
- Price Paid By Year
- Property Type Price
Frequently asked questions about Broughton
What is the average price for a property for sale in Broughton?
The average price for a property for sale in Broughton is £344,914. This amount is 9% lower than the average price in Broughton-in-furness. There are 228 property listings for sale in Broughton.
What streets have the most expensive properties for sale in Broughton?
The streets with the most expensive properties for sale in Broughton are Ulpha Bridge Houses at an average of £650,000, Bank End at an average of £390,000 and Laurel Cottage at an average of £355,000.
What streets have the most affordable properties for sale in Broughton?
The streets with the most affordable properties for sale in Broughton are High Kepplewray at an average of £197,500, Brade Street at an average of £208,333 and Princes Street at an average of £243,000.
Which train stations are available in or near Broughton?
Some of the train stations available in or near Broughton are Foxfield, Green Road and Kirkby-In-Furness.
Property Price Paid in Broughton by Year
The average sold property price by year was:
| Year | Average Sold Price | Price Change |
Sold Properties
|
|---|---|---|---|
| 2025 | £360,300 | 13% |
10 Properties |
| 2024 | £313,333 | -23% |
6 Properties |
| 2023 | £386,586 | 19% |
11 Properties |
| 2022 | £312,395 | 4% |
13 Properties |
| 2021 | £299,451 | -2% |
29 Properties |
| 2020 | £306,088 | -9% |
18 Properties |
| 2019 | £333,653 | 23% |
13 Properties |
| 2018 | £256,416 | 4% |
12 Properties |
| 2017 | £247,071 | 5% |
21 Properties |
| 2016 | £235,245 | -1% |
20 Properties |
| 2015 | £238,553 | 24% |
15 Properties |
| 2014 | £181,560 | -44% |
19 Properties |
| 2013 | £260,834 | 30% |
16 Properties |
| 2012 | £182,756 | -50% |
14 Properties |
| 2011 | £274,241 | -24% |
13 Properties |
| 2010 | £341,200 | 40% |
15 Properties |
| 2009 | £206,359 | -17% |
16 Properties |
| 2008 | £240,584 | -43% |
25 Properties |
| 2007 | £344,908 | 24% |
17 Properties |
| 2006 | £262,090 | 15% |
16 Properties |
| 2005 | £223,576 | 11% |
13 Properties |
| 2004 | £199,630 | 2% |
30 Properties |
| 2003 | £195,076 | 27% |
19 Properties |
| 2002 | £142,279 | 13% |
12 Properties |
| 2001 | £123,492 | 1% |
21 Properties |
| 2000 | £122,715 | 8% |
43 Properties |
| 1999 | £112,403 | 29% |
13 Properties |
| 1998 | £79,837 | 25% |
23 Properties |
| 1997 | £59,482 | -4% |
14 Properties |
| 1996 | £61,583 | -12% |
21 Properties |
| 1995 | £69,144 | - |
17 Properties |
Property Price per Property Type in Broughton
Here you can find historic sold price data in order to help with your property search.
The average Property Paid Price for specific property types in the last three years are:
| Property Type | Average Sold Price | Sold Properties |
|---|---|---|
| Semi Detached House | £344,666.00 | 6 Semi Detached Houses |
| Detached House | £491,821.00 | 14 Detached Houses |
| Terraced House | £244,505.00 | 16 Terraced Houses |
| Flat | £232,750.00 | 4 Flats |

