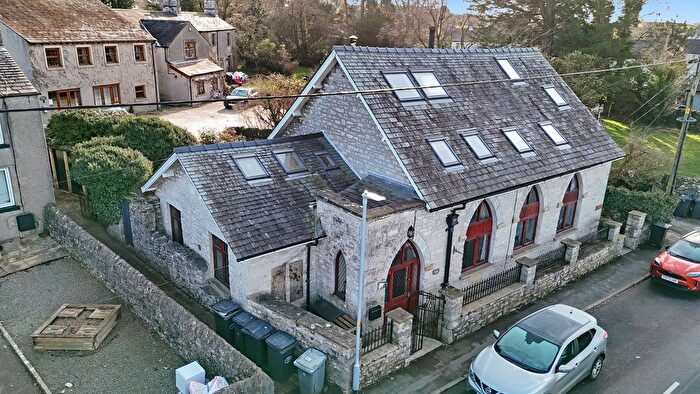
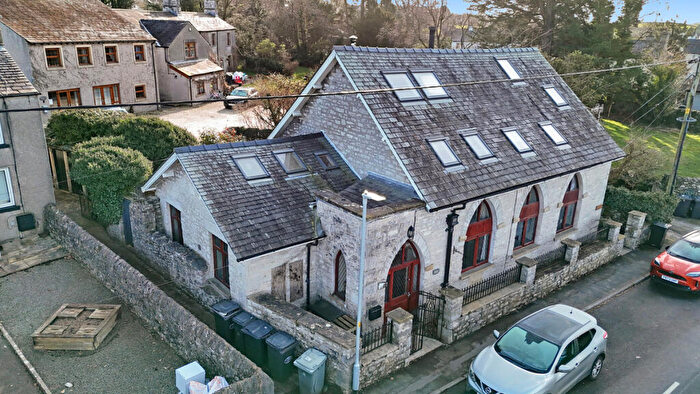
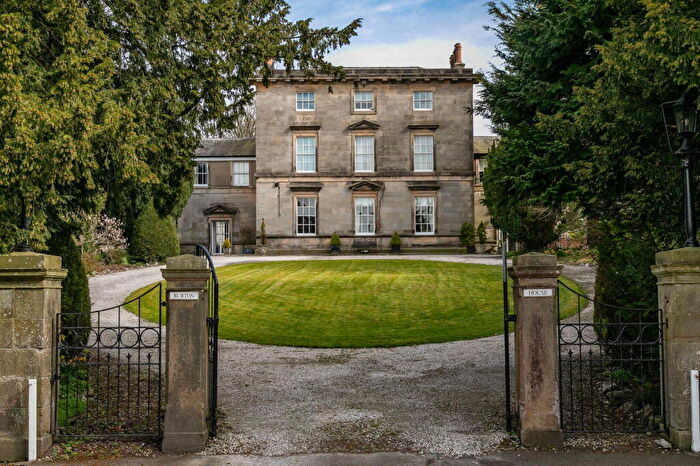
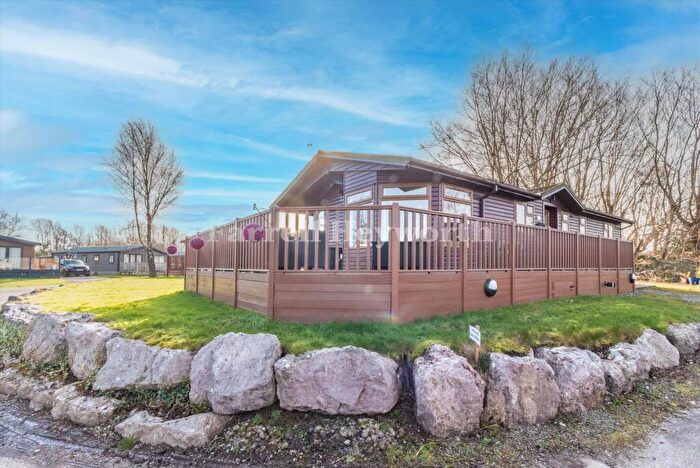
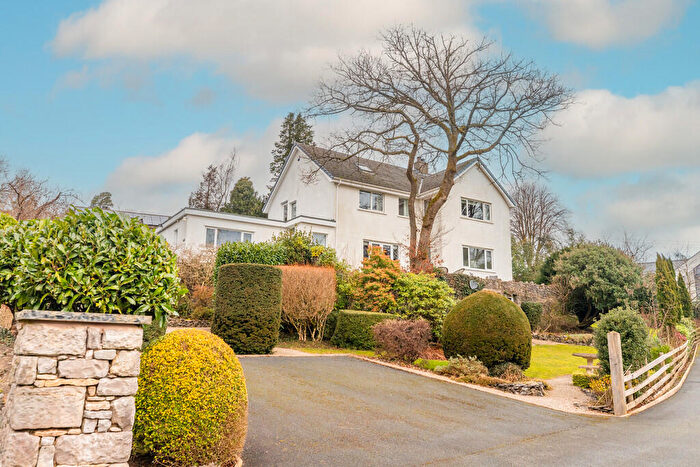
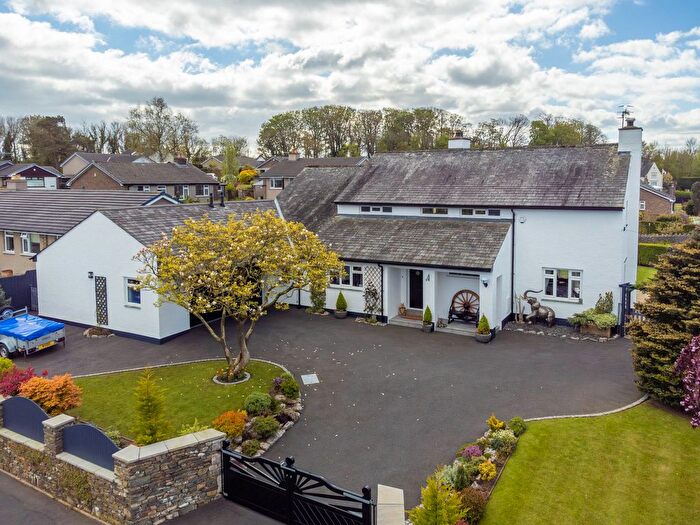
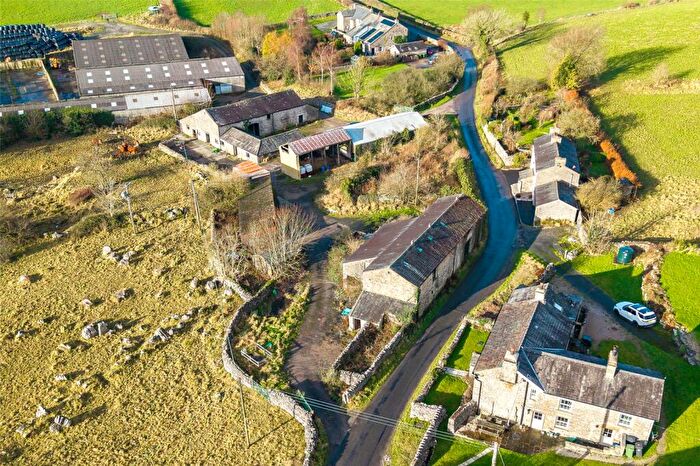
Houses for sale & to rent in Burton And Holme, Carnforth
House Prices in Burton And Holme
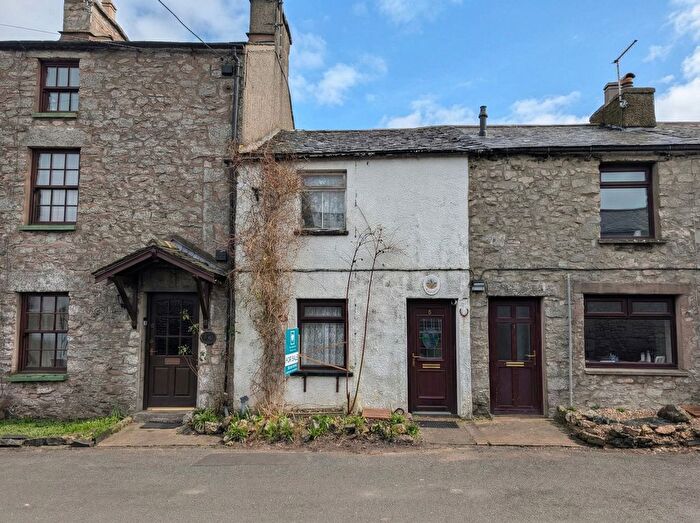
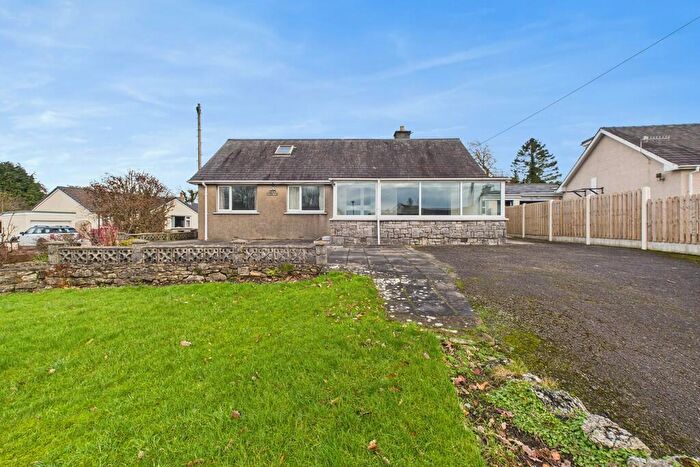
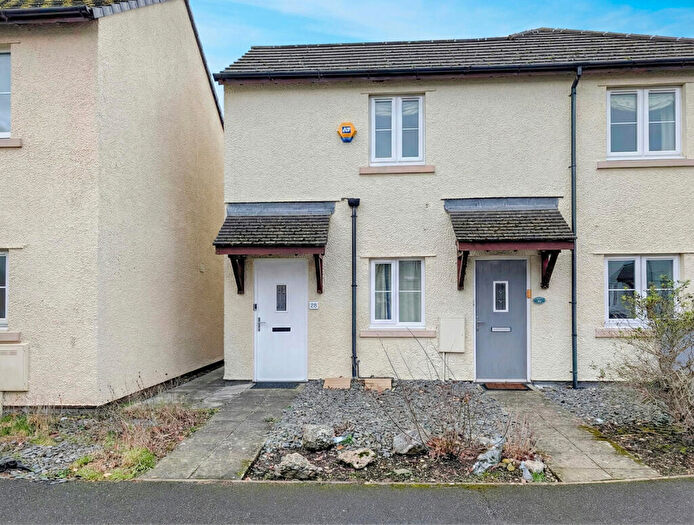
Properties in Burton And Holme have an average house price of £302,841.00 and had 158 Property Transactions within the last 3 years¹.
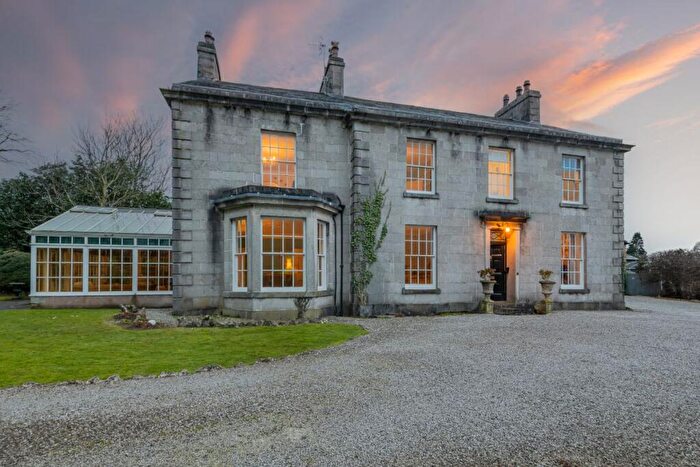
Burton And Holme is an area in Carnforth, Cumbria with 1,445 households², where the most expensive property was sold for £1,650,000.00.
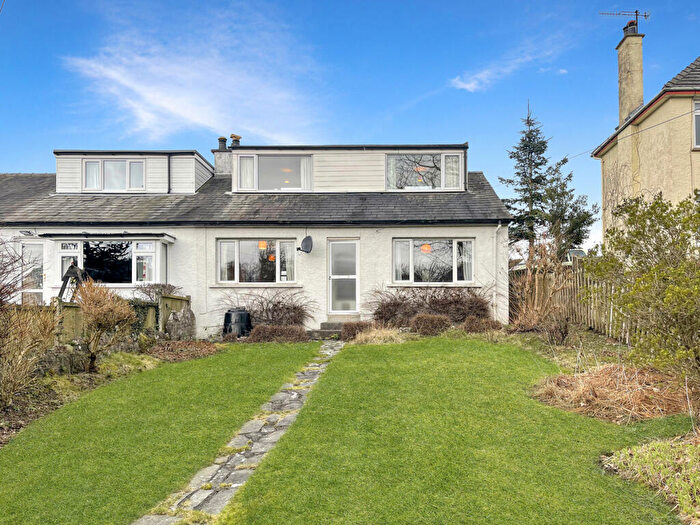
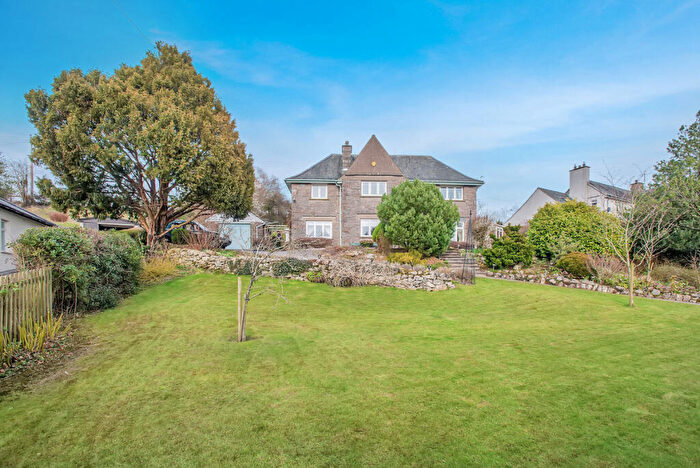
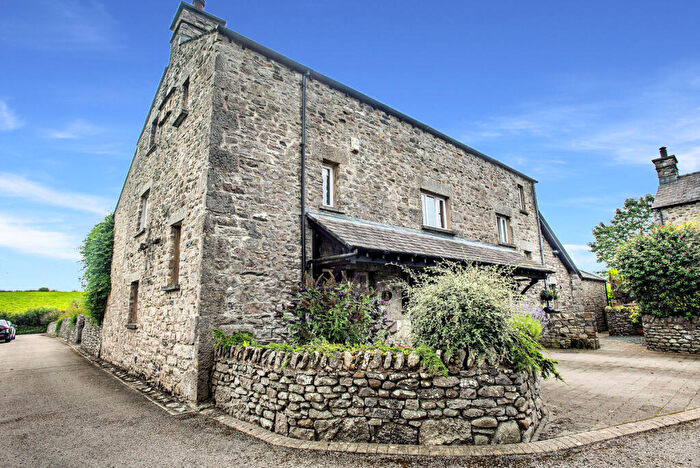
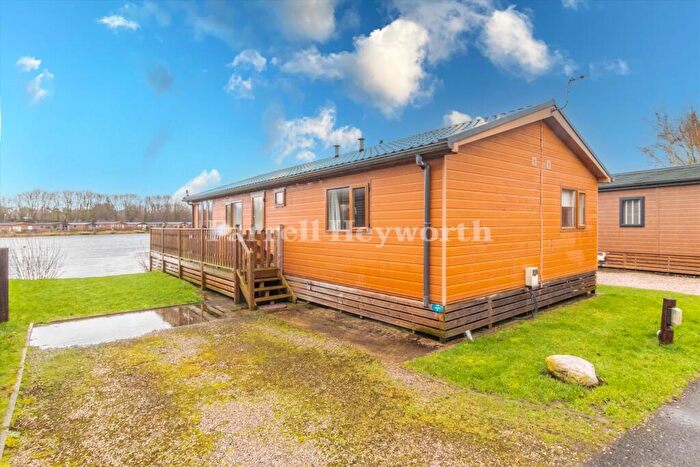
Properties for sale in Burton And Holme
Roads and Postcodes in Burton And Holme
Navigate through our locations to find the location of your next house in Burton And Holme, Carnforth for sale or to rent.
| Streets | Postcodes |
|---|---|
| Barker Close | LA6 1LA |
| Barker Terrace | LA6 1JD |
| Barton Row | LA6 1LL |
| Boon Town | LA6 1LN |
| Boon Walks | LA6 1NB |
| Brookfield Close | LA6 1QW |
| Burton Park | LA6 1JB |
| Burton Road | LA6 1QS LA6 1QT |
| Canal Close | LA6 1GY |
| Chester Terrace | LA6 1LS |
| Chestnut Close | LA6 1RW LA6 1RX |
| Church Bank Gardens | LA6 1NT |
| Church Stile | LA6 1SF |
| City O Pinch | LA6 1QP |
| Cocking Yard | LA6 1LZ |
| Cow Brow | LA6 1PE LA6 1PF LA6 1PG LA6 1PH LA6 1PJ LA6 1PQ |
| Dalton Lane | LA6 1NG |
| Drovers Way | LA6 1HU |
| Duke Street | LA6 1PY |
| Farleton View | LA6 1QU |
| Forestry Houses | LA6 1NN |
| Garden Place | LA6 1LF |
| Glebe Close | LA6 1PL |
| Green Close | LA6 2QH |
| Green Garth | LA6 1RF |
| Hill Side | LA6 1QD |
| Holme Field | LA6 1RY |
| Holme Mills Cottages | LA6 1RB |
| Hutton Close | LA6 1NR |
| Joness Yard | LA6 1LP |
| Lodge Close | LA6 1QN |
| Lowther Court | LA6 2QL |
| Main Street | LA6 1LH LA6 1LQ LA6 1LR LA6 1LT LA6 1LW LA6 1LY LA6 1NA LA6 1ND LA6 1NS LA6 1FU |
| Malt Kiln Cottages | LA6 1QE |
| Mayfield Avenue | LA6 1PT |
| Meadow Close | LA6 1FX |
| Meadowcroft | LA6 1QQ |
| Milnthorpe Road | LA6 1PS LA6 1PX LA6 1RS |
| Morewood Drive | LA6 1NE |
| Moss Lane | LA6 1RH LA6 1RR |
| Mount Pleasant | LA6 1QR |
| Mowbray Drive | LA6 1NF |
| Neddy Hill | LA6 1JE |
| North Road | LA6 1QA LA6 1QG LA6 1QJ |
| Oddfellows Row | LA6 1QH |
| Old Riggs Yard | LA6 1LJ |
| Orchard Close | LA6 1PN |
| Oxlands | LA6 1RG |
| Paddock Close | LA6 1BJ |
| Park Lane | LA6 1RZ |
| Pear Tree Park | LA6 1PP LA6 1SD |
| Pinders Lane | LA6 1PW |
| Queens Terrace | LA6 1QB |
| Sheernest | LA6 1QX |
| Springfield | LA6 1QZ |
| St James's Drive | LA6 1HY |
| Station Lane | LA6 1HS LA6 1HT |
| Station Road | LA6 1QY LA6 1RE LA6 1RQ |
| Tanpits Lane | LA6 1HX LA6 1HZ LA6 1JA |
| The Crescent | LA6 1PU |
| The Globe | LA6 1LU |
| The Square | LA6 1LX |
| Thornleigh Drive | LA6 1NQ |
| Toll Bar Court | LA6 1LD |
| Town Head Fold | LA6 1SE |
| Trinity Drive | LA6 1QL |
| Turners Close | LA6 1RT |
| Twinter Bank | LA6 1TB |
| Vicarage Close | LA6 1NP |
| Vicarage Lane | LA6 1NW |
| Yew Tree Close | LA6 1QF |
| LA6 1HR LA6 1LG LA6 1NL LA6 1NU LA6 1NX LA6 1PA LA6 1PZ LA6 2PE LA6 2PF LA6 2PG LA6 2PH LA6 2PJ LA6 2PL LA6 2PN LA6 2PP LA6 2PR LA6 2PW LA6 2PX LA6 2QB |
Transport near Burton And Holme
-
Silverdale Station
-
Arnside Station
-
Carnforth Station
-
Wennington Station
-
Oxenholme Lake District Station
-
Grange-Over-Sands Station
-
Kents Bank Station
-
Kendal Station
-
Bare Lane Station
- FAQ
- Price Paid By Year
- Property Type Price
Frequently asked questions about Burton And Holme
What is the average price for a property for sale in Burton And Holme?
The average price for a property for sale in Burton And Holme is £302,841. This amount is 17% lower than the average price in Carnforth. There are 1,466 property listings for sale in Burton And Holme.
What streets have the most expensive properties for sale in Burton And Holme?
The streets with the most expensive properties for sale in Burton And Holme are Thornleigh Drive at an average of £527,500, Town Head Fold at an average of £449,333 and Joness Yard at an average of £405,000.
What streets have the most affordable properties for sale in Burton And Holme?
The streets with the most affordable properties for sale in Burton And Holme are Barton Row at an average of £43,500, The Globe at an average of £141,000 and Chestnut Close at an average of £148,166.
Which train stations are available in or near Burton And Holme?
Some of the train stations available in or near Burton And Holme are Silverdale, Arnside and Carnforth.
Property Price Paid in Burton And Holme by Year
The average sold property price by year was:
| Year | Average Sold Price | Price Change |
Sold Properties
|
|---|---|---|---|
| 2025 | £280,712 | -6% |
54 Properties |
| 2024 | £296,621 | -13% |
58 Properties |
| 2023 | £336,662 | 15% |
46 Properties |
| 2022 | £287,479 | -5% |
69 Properties |
| 2021 | £301,636 | 21% |
89 Properties |
| 2020 | £238,011 | -11% |
53 Properties |
| 2019 | £263,888 | 20% |
75 Properties |
| 2018 | £211,813 | -20% |
60 Properties |
| 2017 | £253,705 | 13% |
61 Properties |
| 2016 | £221,677 | 0,1% |
63 Properties |
| 2015 | £221,446 | 1% |
66 Properties |
| 2014 | £218,517 | -5% |
54 Properties |
| 2013 | £229,078 | 7% |
50 Properties |
| 2012 | £212,730 | 3% |
39 Properties |
| 2011 | £205,329 | -6% |
37 Properties |
| 2010 | £218,019 | -12% |
49 Properties |
| 2009 | £244,428 | 1% |
47 Properties |
| 2008 | £242,834 | 5% |
55 Properties |
| 2007 | £231,565 | 3% |
75 Properties |
| 2006 | £225,439 | -5% |
99 Properties |
| 2005 | £235,678 | 12% |
72 Properties |
| 2004 | £206,601 | 24% |
95 Properties |
| 2003 | £156,104 | 13% |
86 Properties |
| 2002 | £135,974 | 23% |
99 Properties |
| 2001 | £104,076 | 11% |
96 Properties |
| 2000 | £92,997 | -4% |
78 Properties |
| 1999 | £96,810 | 22% |
83 Properties |
| 1998 | £75,674 | 4% |
69 Properties |
| 1997 | £72,757 | 8% |
79 Properties |
| 1996 | £67,021 | -8% |
65 Properties |
| 1995 | £72,407 | - |
41 Properties |
Property Price per Property Type in Burton And Holme
Here you can find historic sold price data in order to help with your property search.
The average Property Paid Price for specific property types in the last three years are:
| Property Type | Average Sold Price | Sold Properties |
|---|---|---|
| Semi Detached House | £273,586.00 | 47 Semi Detached Houses |
| Detached House | £425,157.00 | 54 Detached Houses |
| Terraced House | £221,159.00 | 50 Terraced Houses |
| Flat | £139,142.00 | 7 Flats |

