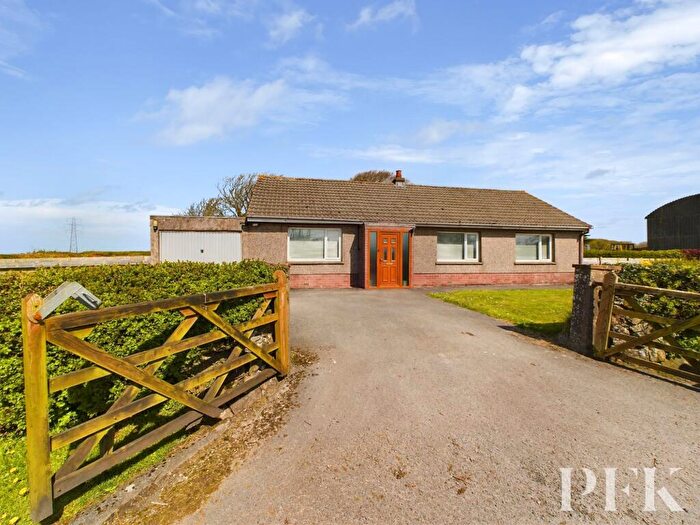
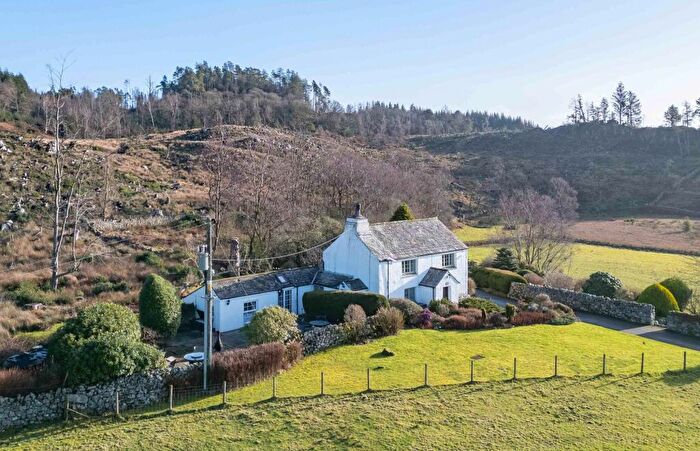
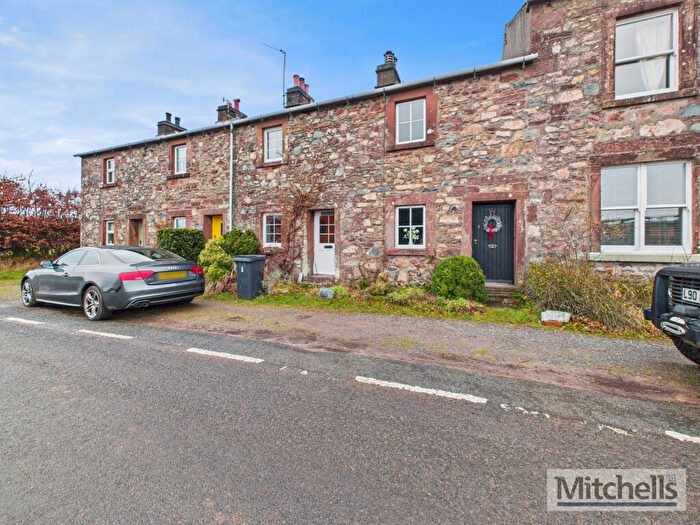
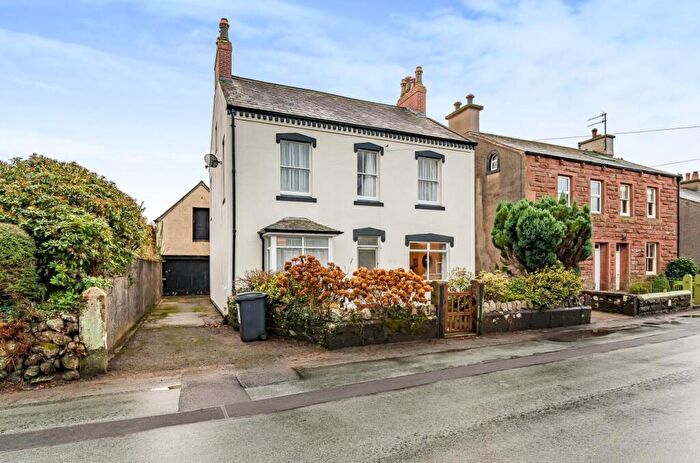
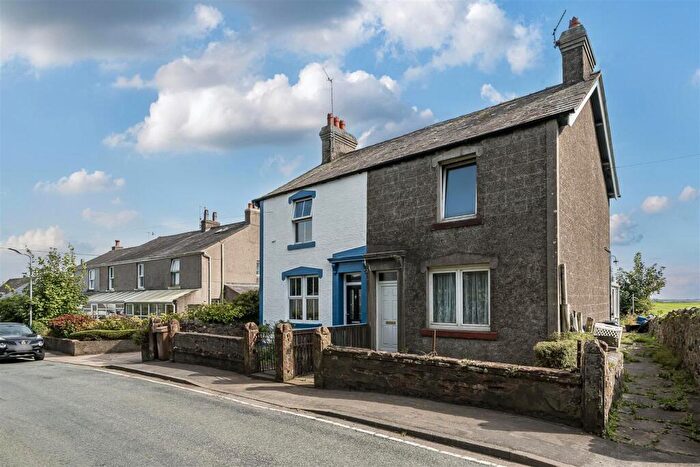
Houses for sale & to rent in Seascale, Holmrook
House Prices in Seascale
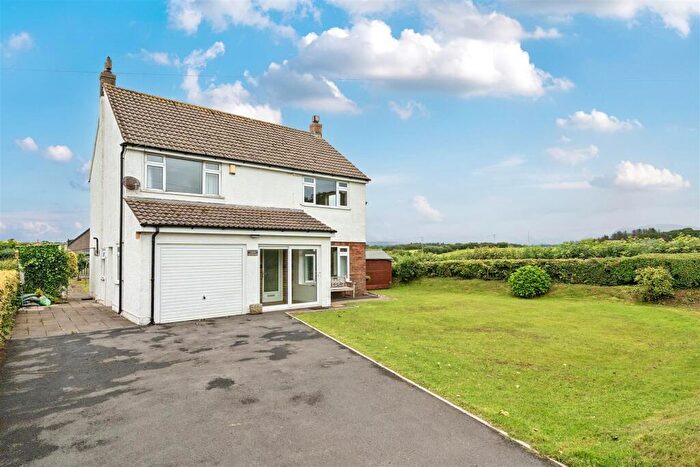
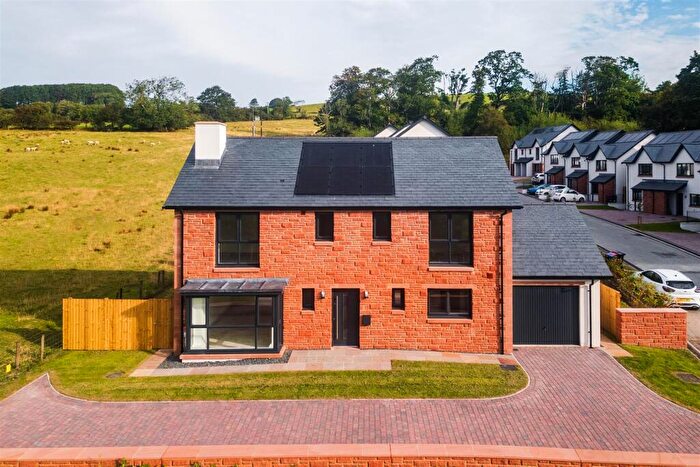
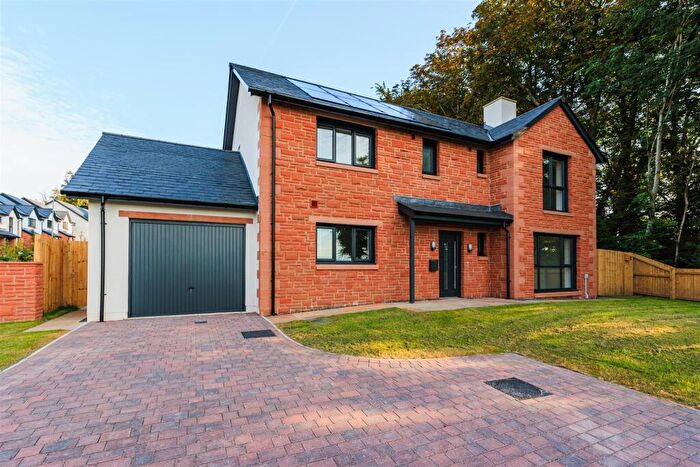
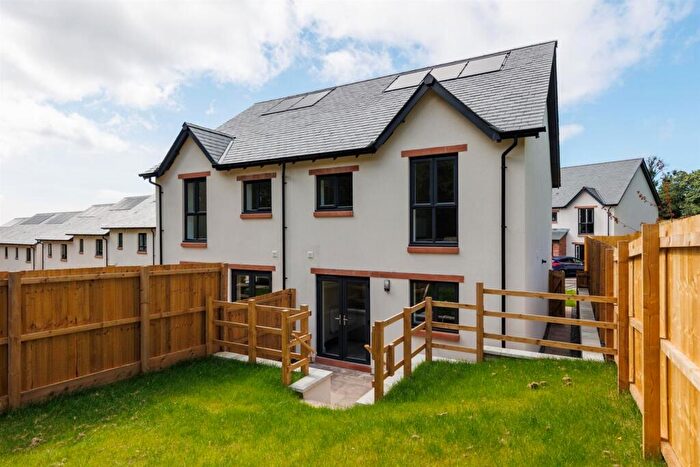
Properties in Seascale have an average house price of £366,773.00 and had 32 Property Transactions within the last 3 years¹.
Seascale is an area in Holmrook, Cumbria with 408 households², where the most expensive property was sold for £820,000.00.
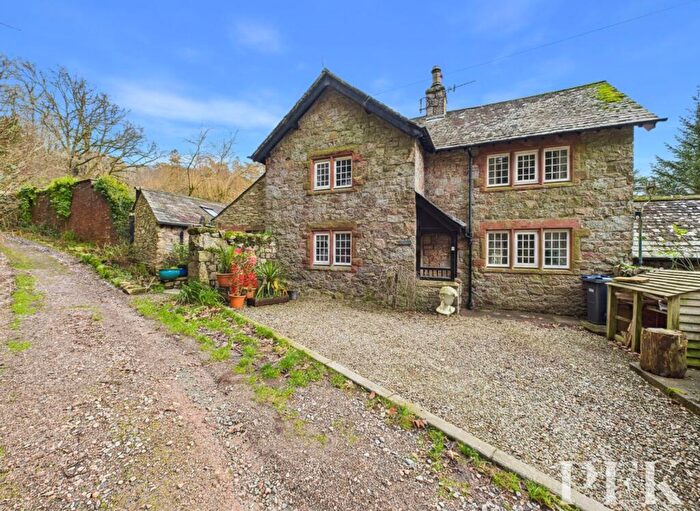
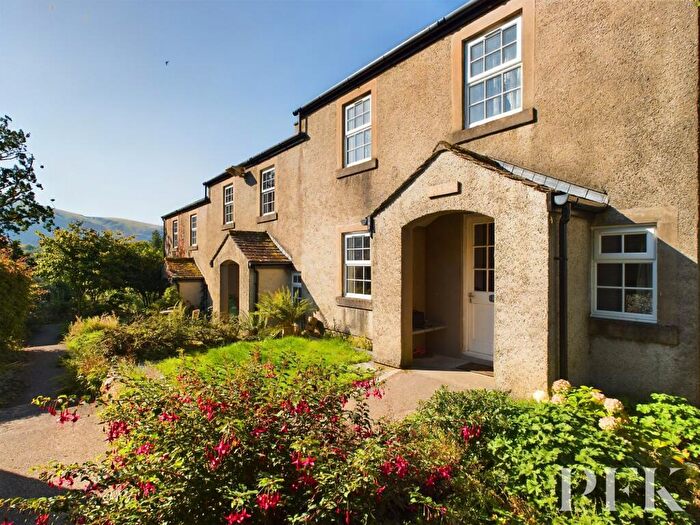
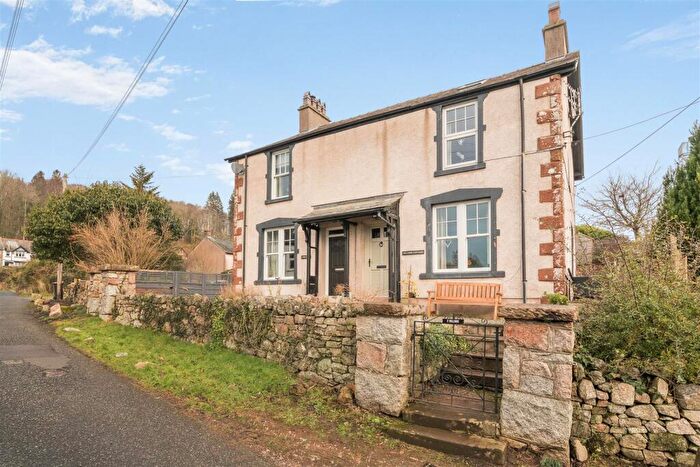
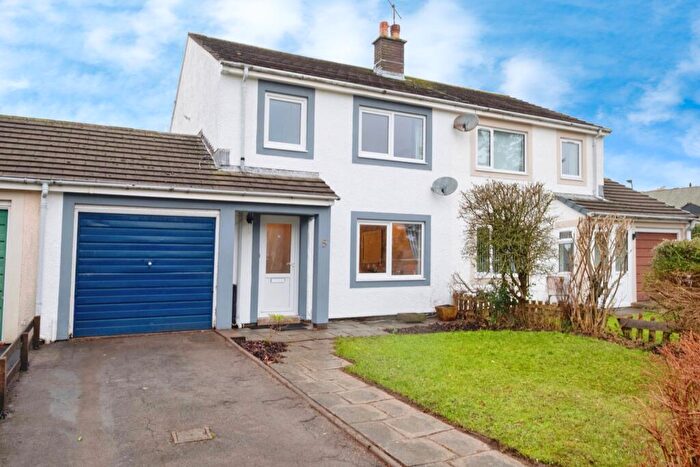
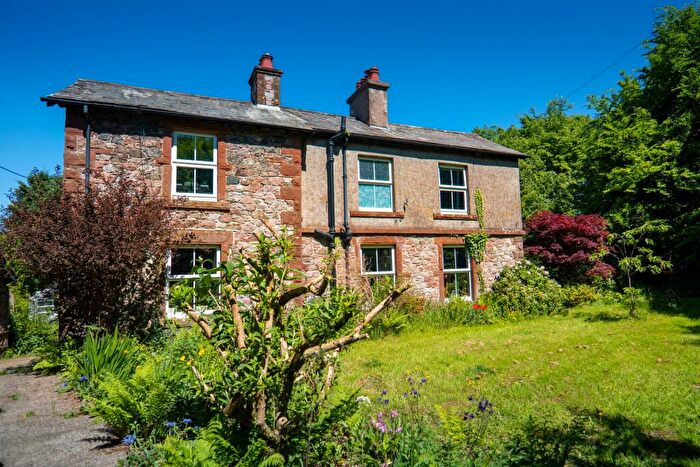
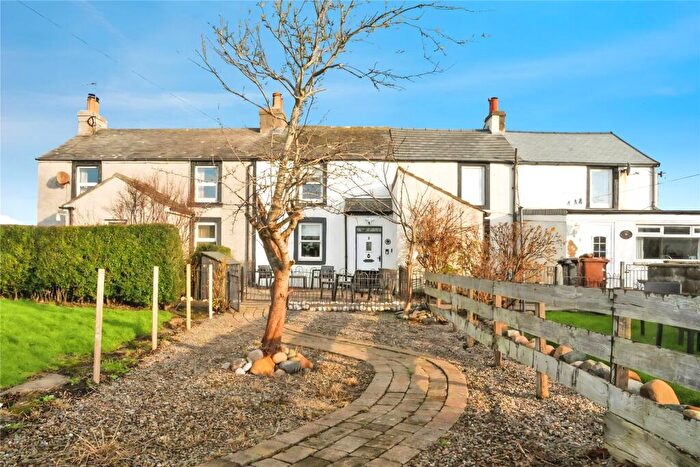
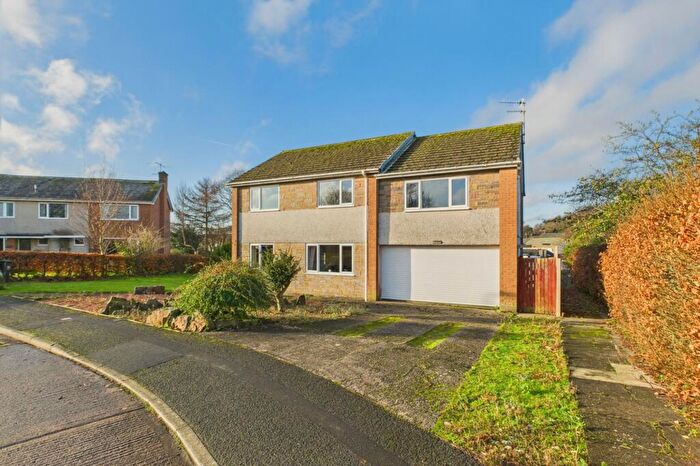
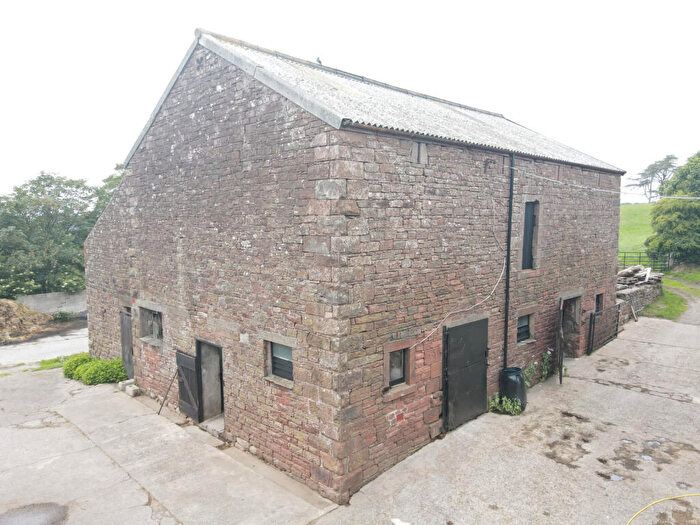
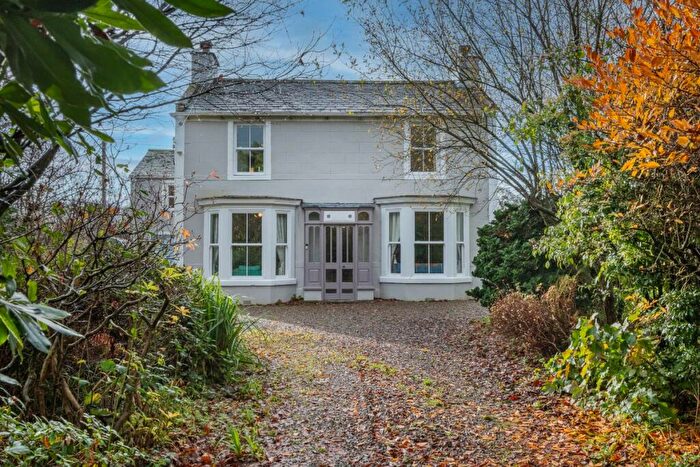
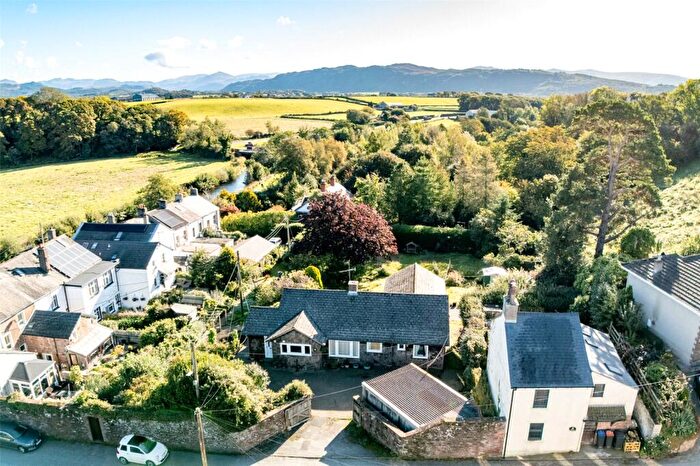
Properties for sale in Seascale
Roads and Postcodes in Seascale
Navigate through our locations to find the location of your next house in Seascale, Holmrook for sale or to rent.
| Streets | Postcodes |
|---|---|
| Gatesyde Place | CA19 1UD |
| Hill Terrace | CA19 1UG |
| Irton Hall | CA19 1TA |
| Low Moor | CA19 1XZ |
| Meadow View | CA19 1YF |
| Old Shore Road | CA19 1XP |
| Orange Hill Cottages | CA19 1TG |
| Santon Bridge | CA19 1UY |
| Santon Cottages | CA19 1UT |
| Santon Village | CA19 1UN |
| Shore Road | CA19 1XL |
| Smithy Banks | CA19 1TP |
| Station Road | CA19 1XH CA19 1XQ |
| Stubble Green | CA19 1XT |
| Summer View | CA19 1XX |
| The Square | CA19 1UQ |
| Wray Head | CA19 1XR |
| CA19 1TD CA19 1TF CA19 1TH CA19 1TL CA19 1TS CA19 1TW CA19 1TX CA19 1TY CA19 1TZ CA19 1UA CA19 1UE CA19 1UH CA19 1UJ CA19 1UL CA19 1UU CA19 1UZ CA19 1XA CA19 1XD CA19 1XE CA19 1XF CA19 1XG CA19 1XS CA19 1YA CA19 1YG CA19 1YH CA19 1YQ CA19 1YR CA19 1YT CA19 1YX CA19 1YY |
Transport near Seascale
- FAQ
- Price Paid By Year
- Property Type Price
Frequently asked questions about Seascale
What is the average price for a property for sale in Seascale?
The average price for a property for sale in Seascale is £366,773. This amount is 2% lower than the average price in Holmrook. There are 245 property listings for sale in Seascale.
What streets have the most expensive properties for sale in Seascale?
The streets with the most expensive properties for sale in Seascale are Santon Bridge at an average of £600,000, Orange Hill Cottages at an average of £540,000 and Santon Cottages at an average of £460,000.
What streets have the most affordable properties for sale in Seascale?
The streets with the most affordable properties for sale in Seascale are Stubble Green at an average of £160,000, Wray Head at an average of £172,500 and Old Shore Road at an average of £185,000.
Which train stations are available in or near Seascale?
Some of the train stations available in or near Seascale are Drigg, Ravenglass and Seascale.
Property Price Paid in Seascale by Year
The average sold property price by year was:
| Year | Average Sold Price | Price Change |
Sold Properties
|
|---|---|---|---|
| 2025 | £314,116 | -22% |
15 Properties |
| 2024 | £382,875 | -15% |
8 Properties |
| 2023 | £440,222 | 42% |
9 Properties |
| 2022 | £254,863 | -31% |
11 Properties |
| 2021 | £334,026 | 21% |
28 Properties |
| 2020 | £265,000 | 13% |
13 Properties |
| 2019 | £229,857 | -6% |
7 Properties |
| 2018 | £242,791 | -1% |
12 Properties |
| 2017 | £245,722 | 2% |
9 Properties |
| 2016 | £241,000 | 27% |
8 Properties |
| 2015 | £175,765 | -72% |
13 Properties |
| 2014 | £302,067 | 19% |
14 Properties |
| 2013 | £245,571 | 14% |
14 Properties |
| 2012 | £211,545 | -30% |
11 Properties |
| 2011 | £274,428 | 8% |
7 Properties |
| 2010 | £251,785 | -2% |
14 Properties |
| 2009 | £255,963 | 6% |
15 Properties |
| 2008 | £241,846 | 5% |
11 Properties |
| 2007 | £229,780 | 12% |
23 Properties |
| 2006 | £203,231 | -4% |
15 Properties |
| 2005 | £211,530 | 10% |
15 Properties |
| 2004 | £189,391 | 18% |
28 Properties |
| 2003 | £154,607 | 26% |
20 Properties |
| 2002 | £115,161 | 7% |
33 Properties |
| 2001 | £107,176 | 9% |
17 Properties |
| 2000 | £97,505 | 15% |
20 Properties |
| 1999 | £82,478 | -8% |
25 Properties |
| 1998 | £89,477 | 10% |
11 Properties |
| 1997 | £80,408 | 4% |
17 Properties |
| 1996 | £77,063 | 15% |
18 Properties |
| 1995 | £65,611 | - |
18 Properties |
Property Price per Property Type in Seascale
Here you can find historic sold price data in order to help with your property search.
The average Property Paid Price for specific property types in the last three years are:
| Property Type | Average Sold Price | Sold Properties |
|---|---|---|
| Semi Detached House | £244,361.00 | 9 Semi Detached Houses |
| Detached House | £435,184.00 | 19 Detached Houses |
| Terraced House | £289,666.00 | 3 Terraced Houses |
| Flat | £400,000.00 | 1 Flat |

