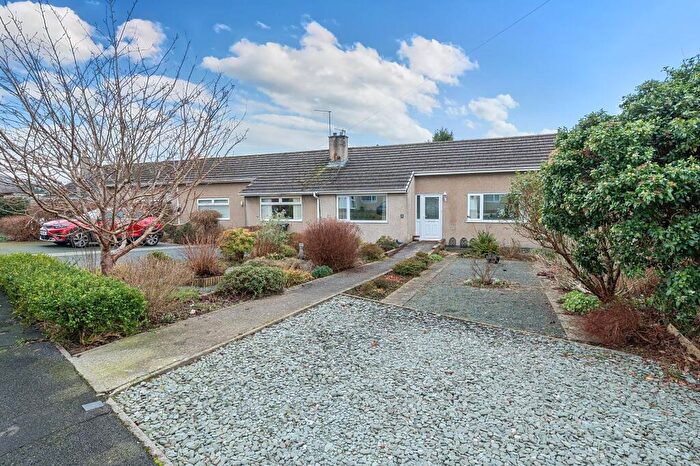
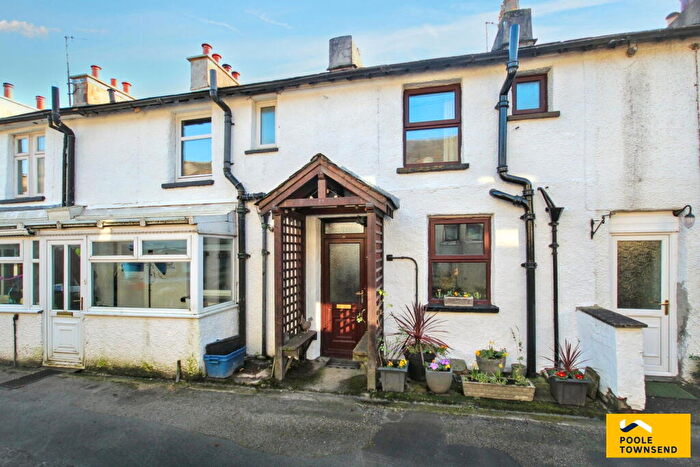
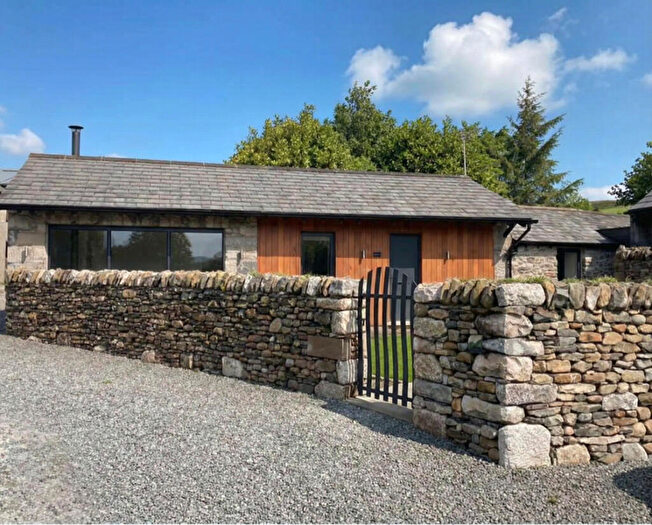
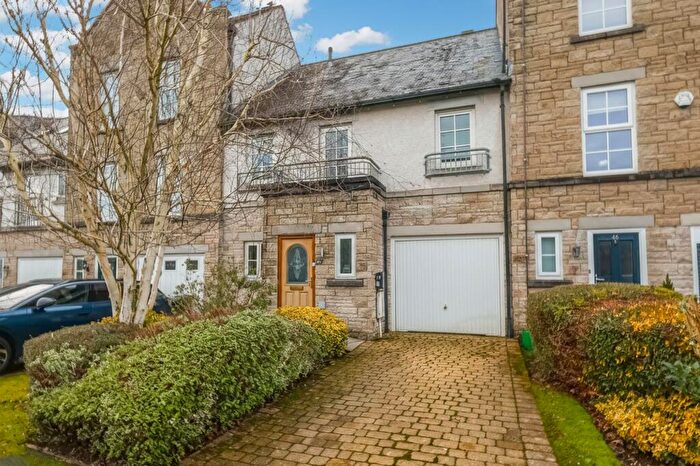
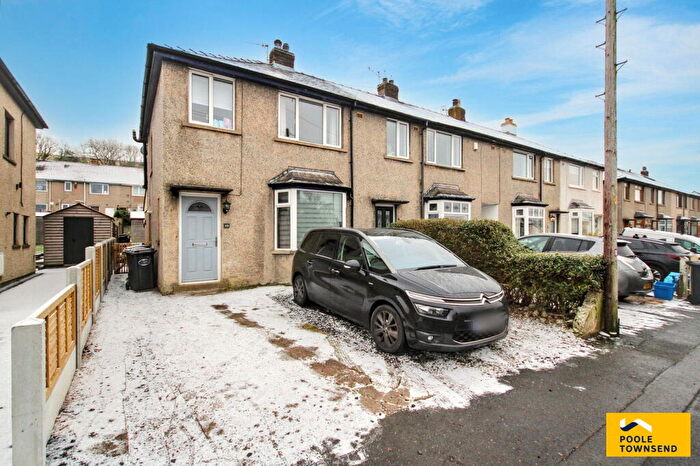
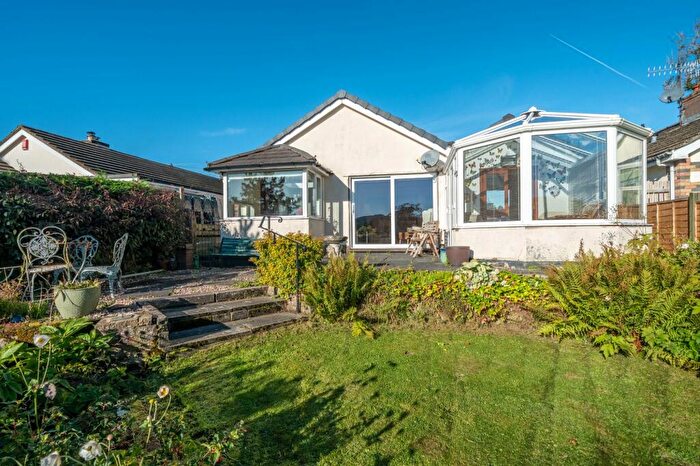
Houses for sale & to rent in Crooklands, Kendal
House Prices in Crooklands
Properties in Crooklands have an average house price of £367,400.00 and had 66 Property Transactions within the last 3 years¹.
Crooklands is an area in Kendal, Cumbria with 766 households², where the most expensive property was sold for £940,000.00.
Properties for sale in Crooklands
Roads and Postcodes in Crooklands
Navigate through our locations to find the location of your next house in Crooklands, Kendal for sale or to rent.
| Streets | Postcodes |
|---|---|
| Alexander Drive | LA8 0EF |
| Barrows Green | LA8 0AA LA8 0JG |
| Birchfield | LA8 0JA |
| Castle View | LA8 0JL |
| Dove Nest Lane | LA8 0EY |
| Elm Close | LA8 0EA |
| Enyeat Road | LA8 0HD |
| Eskrigg Lane | LA8 0EG |
| Gatebeck Lane | LA8 0EQ LA8 0HN |
| Gatebeck Road | LA8 0HH LA8 0HL |
| Greenways Drive | LA8 0EL |
| High Birkrigg Park | LA8 0DY |
| Hill Close | LA8 0JR |
| Humphrey Cottages | LA8 0AD |
| Lillesden | LA8 0LN |
| Longwood | LA8 0ES |
| Low Cottages | LA8 0HB |
| Low Park Lane | LA8 0EH |
| Main Street | LA8 0EU |
| Meadowside Close | LA8 0EJ |
| Millbridge Lane | LA8 0DU |
| Moorside Road | LA8 0EN |
| Moss Lea | LA8 0JB |
| Natland Road | LA8 0JN |
| Orchard Close | LA8 0LJ |
| Riverside Terrace | LA8 0JZ |
| Shyreakes Lane | LA8 0AB |
| Stainton Court | LA8 0LQ |
| Stainton Cross | LA8 0LG |
| Sycamore Close | LA8 0NY |
| The Walled Garden | LA8 0LW |
| Wakefield Meadow | LA8 0JD |
| Warwick Drive | LA8 0EE |
| Wellheads Lane | LA8 0JS LA8 0JT |
| Weston Houses | LA8 0HA |
| Wharf Lane | LA8 0JW |
| Woodbank | LA8 0HG |
| Woodbank Crescent | LA8 0HF |
| Woodlands Close | LA8 0EZ |
| Woodside Close | LA8 0HP |
| Woodside Road | LA8 0HE LA8 0HQ |
| LA8 0DX LA8 0ED LA8 0EP LA8 0ET LA8 0EW LA8 0JJ LA8 0JP LA8 0JU LA8 0JX LA8 0LE LA8 0LF LA8 0LH LA8 0LR |
Transport near Crooklands
-
Oxenholme Lake District Station
-
Kendal Station
-
Burneside Station
-
Arnside Station
-
Silverdale Station
-
Staveley (Cumbria) Station
-
Grange-Over-Sands Station
-
Carnforth Station
- FAQ
- Price Paid By Year
- Property Type Price
Frequently asked questions about Crooklands
What is the average price for a property for sale in Crooklands?
The average price for a property for sale in Crooklands is £367,400. This amount is 22% higher than the average price in Kendal. There are 657 property listings for sale in Crooklands.
What streets have the most expensive properties for sale in Crooklands?
The streets with the most expensive properties for sale in Crooklands are Millbridge Lane at an average of £780,000, Wellheads Lane at an average of £465,000 and Barrows Green at an average of £449,450.
What streets have the most affordable properties for sale in Crooklands?
The streets with the most affordable properties for sale in Crooklands are Main Street at an average of £171,250, Woodbank at an average of £174,000 and Elm Close at an average of £212,500.
Which train stations are available in or near Crooklands?
Some of the train stations available in or near Crooklands are Oxenholme Lake District, Kendal and Burneside.
Property Price Paid in Crooklands by Year
The average sold property price by year was:
| Year | Average Sold Price | Price Change |
Sold Properties
|
|---|---|---|---|
| 2025 | £347,375 | -5% |
18 Properties |
| 2024 | £365,687 | -6% |
26 Properties |
| 2023 | £385,809 | 13% |
22 Properties |
| 2022 | £336,397 | 12% |
34 Properties |
| 2021 | £297,501 | 6% |
38 Properties |
| 2020 | £279,022 | -7% |
33 Properties |
| 2019 | £298,851 | 17% |
27 Properties |
| 2018 | £249,047 | -6% |
20 Properties |
| 2017 | £263,310 | 1% |
32 Properties |
| 2016 | £259,840 | 5% |
22 Properties |
| 2015 | £247,855 | -2% |
27 Properties |
| 2014 | £251,801 | -3% |
28 Properties |
| 2013 | £258,916 | 2% |
24 Properties |
| 2012 | £253,650 | 16% |
25 Properties |
| 2011 | £214,306 | -17% |
23 Properties |
| 2010 | £249,812 | 7% |
16 Properties |
| 2009 | £232,188 | -21% |
21 Properties |
| 2008 | £281,535 | 1% |
14 Properties |
| 2007 | £278,361 | 11% |
42 Properties |
| 2006 | £247,662 | 15% |
23 Properties |
| 2005 | £211,508 | -3% |
24 Properties |
| 2004 | £218,861 | 13% |
39 Properties |
| 2003 | £190,210 | 35% |
38 Properties |
| 2002 | £123,993 | 10% |
43 Properties |
| 2001 | £110,991 | 4% |
40 Properties |
| 2000 | £106,021 | 6% |
39 Properties |
| 1999 | £99,607 | 9% |
67 Properties |
| 1998 | £90,513 | 7% |
60 Properties |
| 1997 | £84,528 | 19% |
53 Properties |
| 1996 | £68,470 | -29% |
27 Properties |
| 1995 | £88,505 | - |
19 Properties |
Property Price per Property Type in Crooklands
Here you can find historic sold price data in order to help with your property search.
The average Property Paid Price for specific property types in the last three years are:
| Property Type | Average Sold Price | Sold Properties |
|---|---|---|
| Semi Detached House | £311,250.00 | 11 Semi Detached Houses |
| Detached House | £434,962.00 | 35 Detached Houses |
| Terraced House | £275,888.00 | 18 Terraced Houses |
| Flat | £317,500.00 | 2 Flats |

