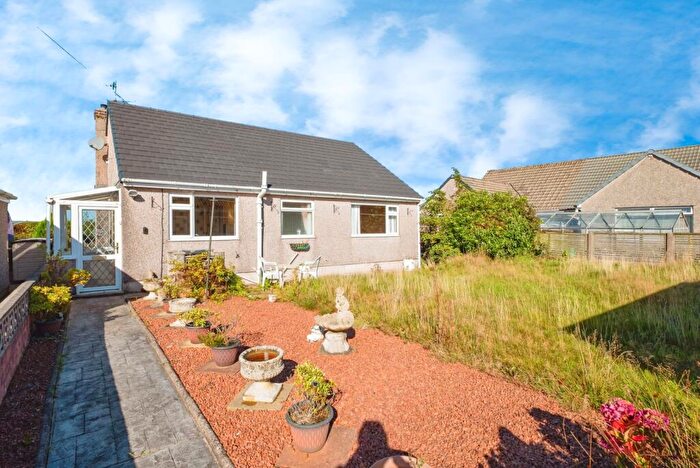
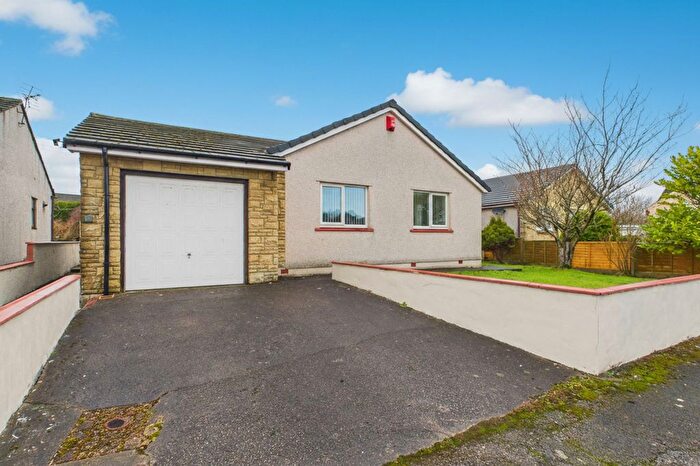
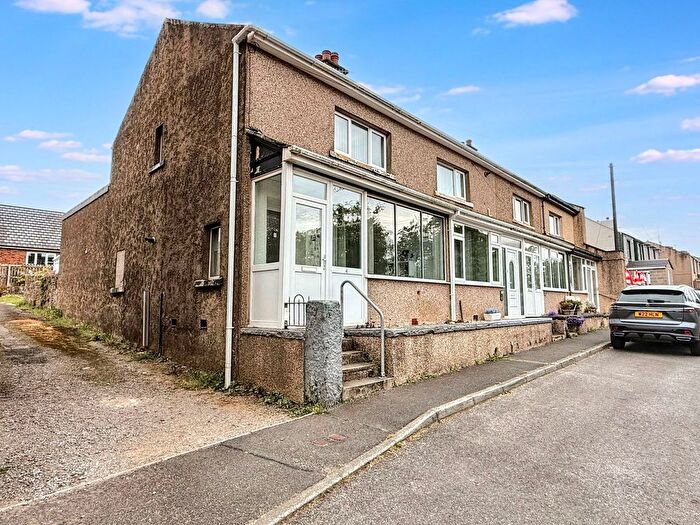
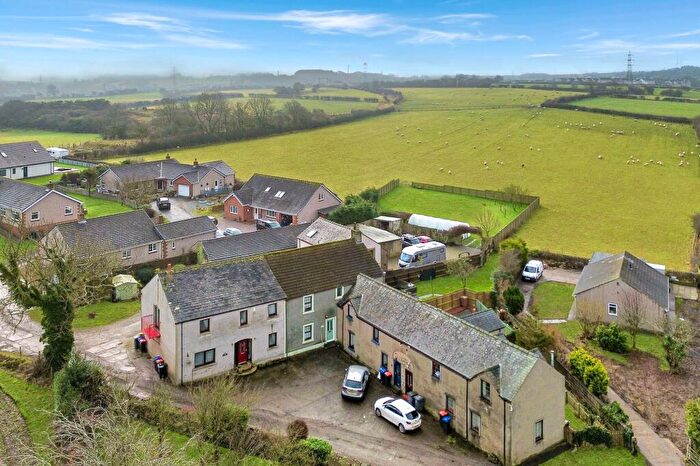
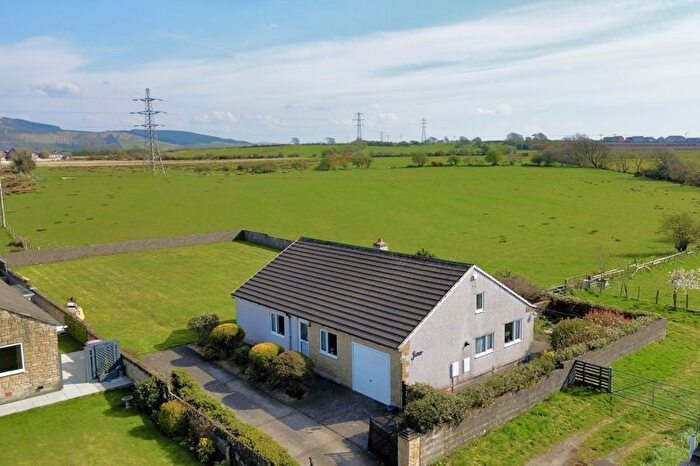
Houses for sale & to rent in Egremont North, Moor Row
House Prices in Egremont North
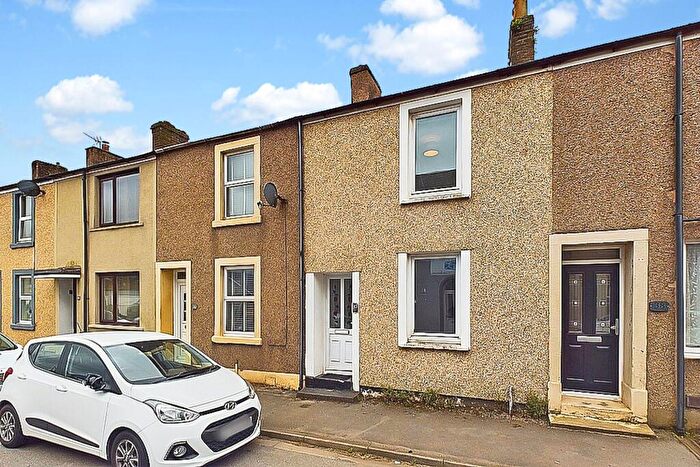
Properties in Egremont North have an average house price of £108,946.00 and had 40 Property Transactions within the last 3 years¹.
Egremont North is an area in Moor Row, Cumbria with 402 households², where the most expensive property was sold for £300,000.00.
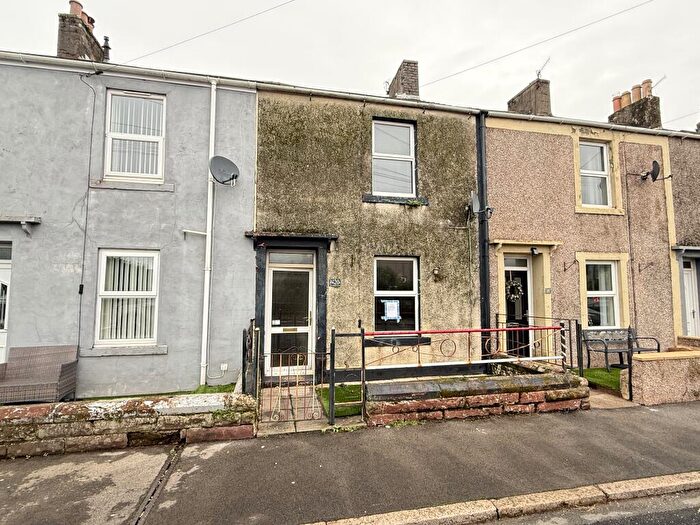
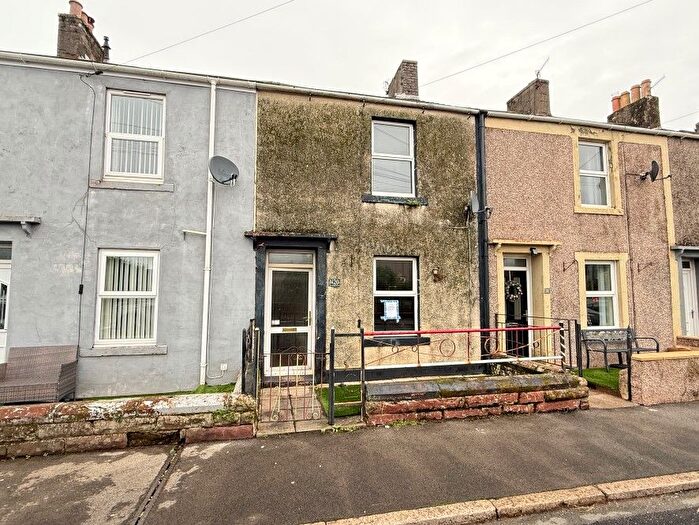
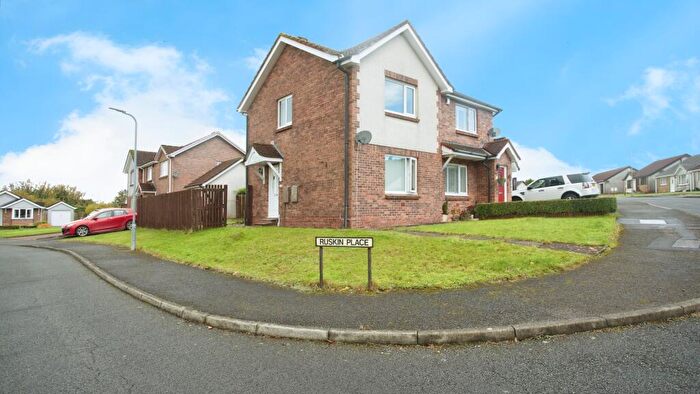
Properties for sale in Egremont North
Previously listed properties in Egremont North
Roads and Postcodes in Egremont North
Navigate through our locations to find the location of your next house in Egremont North, Moor Row for sale or to rent.
| Streets | Postcodes |
|---|---|
| Church Street | CA24 3JF CA24 3JG CA24 3JJ CA24 3JQ |
| Dalzell Street | CA24 3JP |
| Hollins Park | CA24 3LQ |
| John Street | CA24 3JB CA24 3JD |
| Larch Court | CA24 3LS |
| Montreal Place | CA24 3LJ |
| Pearson Close | CA24 3LH |
| Penzance Street | CA24 3JH |
| Railway Terrace | CA24 3JS |
| Rusper Drive | CA24 3LT |
| Scalegill Place | CA24 3JU |
| Scalegill Road | CA24 3JL CA24 3JN |
| West Spur | CA24 3LG |
| CA24 3JA CA24 3JE CA24 3JX CA24 3LA CA24 3LB |
Transport near Egremont North
- FAQ
- Price Paid By Year
- Property Type Price
Frequently asked questions about Egremont North
What is the average price for a property for sale in Egremont North?
The average price for a property for sale in Egremont North is £108,946. This amount is 9% lower than the average price in Moor Row. There are 136 property listings for sale in Egremont North.
What streets have the most expensive properties for sale in Egremont North?
The streets with the most expensive properties for sale in Egremont North are Rusper Drive at an average of £300,000, Pearson Close at an average of £262,500 and Montreal Place at an average of £215,000.
What streets have the most affordable properties for sale in Egremont North?
The streets with the most affordable properties for sale in Egremont North are John Street at an average of £66,000, Penzance Street at an average of £82,990 and Church Street at an average of £85,000.
Which train stations are available in or near Egremont North?
Some of the train stations available in or near Egremont North are St.Bees, Corkickle and Whitehaven.
Property Price Paid in Egremont North by Year
The average sold property price by year was:
| Year | Average Sold Price | Price Change |
Sold Properties
|
|---|---|---|---|
| 2025 | £129,873 | 14% |
13 Properties |
| 2024 | £112,200 | 27% |
15 Properties |
| 2023 | £82,208 | -44% |
12 Properties |
| 2022 | £118,168 | -5% |
27 Properties |
| 2021 | £123,712 | 19% |
25 Properties |
| 2020 | £100,346 | 1% |
16 Properties |
| 2019 | £99,535 | -13% |
14 Properties |
| 2018 | £112,186 | 24% |
19 Properties |
| 2017 | £85,380 | -39% |
13 Properties |
| 2016 | £118,450 | 16% |
23 Properties |
| 2015 | £99,167 | -41% |
24 Properties |
| 2014 | £139,785 | 29% |
14 Properties |
| 2013 | £99,156 | -2% |
16 Properties |
| 2012 | £101,546 | -11% |
14 Properties |
| 2011 | £112,280 | -12% |
14 Properties |
| 2010 | £125,629 | 24% |
20 Properties |
| 2009 | £95,425 | -4% |
14 Properties |
| 2008 | £99,041 | -13% |
12 Properties |
| 2007 | £111,940 | 17% |
35 Properties |
| 2006 | £92,660 | 15% |
42 Properties |
| 2005 | £78,846 | 37% |
25 Properties |
| 2004 | £49,412 | 6% |
31 Properties |
| 2003 | £46,621 | 31% |
32 Properties |
| 2002 | £32,048 | -26% |
31 Properties |
| 2001 | £40,436 | 7% |
23 Properties |
| 2000 | £37,404 | 2% |
23 Properties |
| 1999 | £36,516 | -20% |
15 Properties |
| 1998 | £43,925 | 16% |
14 Properties |
| 1997 | £36,812 | 11% |
20 Properties |
| 1996 | £32,584 | -23% |
19 Properties |
| 1995 | £40,223 | - |
19 Properties |
Property Price per Property Type in Egremont North
Here you can find historic sold price data in order to help with your property search.
The average Property Paid Price for specific property types in the last three years are:
| Property Type | Average Sold Price | Sold Properties |
|---|---|---|
| Semi Detached House | £124,000.00 | 1 Semi Detached House |
| Terraced House | £85,646.00 | 33 Terraced Houses |
| Detached House | £234,583.00 | 6 Detached Houses |

