
Houses for sale in Solway, Wigton
House Prices in Solway
Properties in Solway have an average house price of £277k and had 52 Property Transactions within the last 3 years¹.
Solway is an area in Wigton, Cumbria with 601 households², where the most expensive property was sold for £540k.
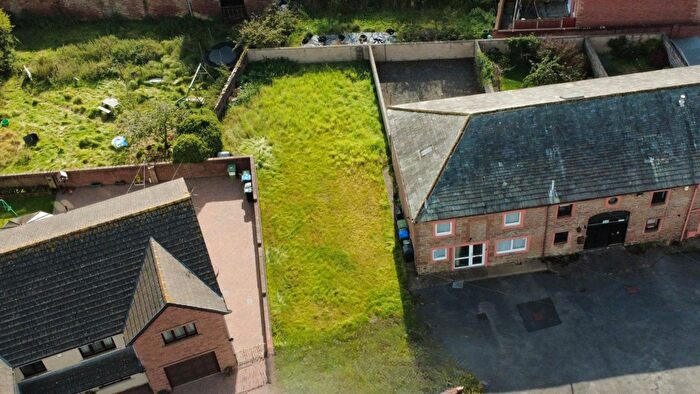
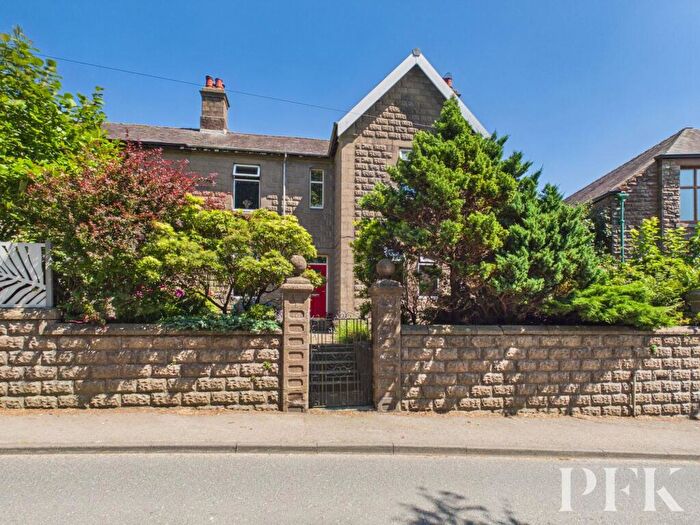
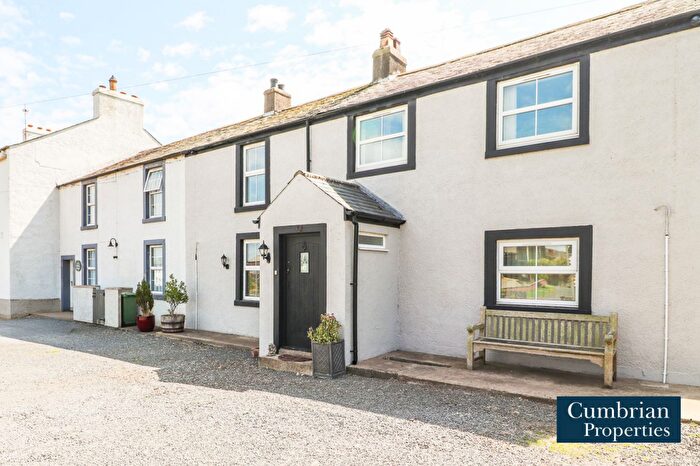
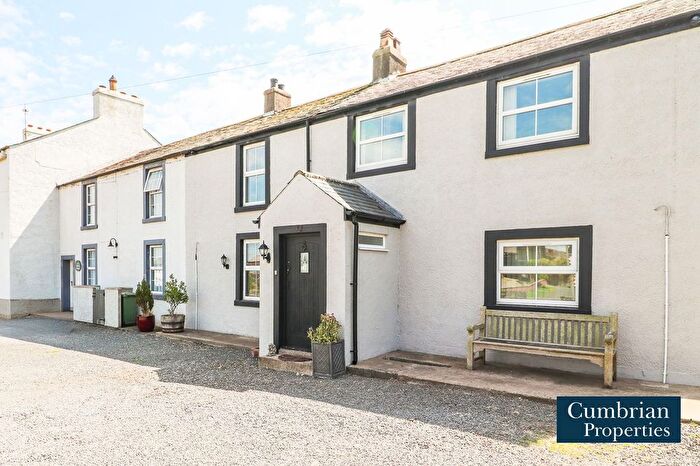
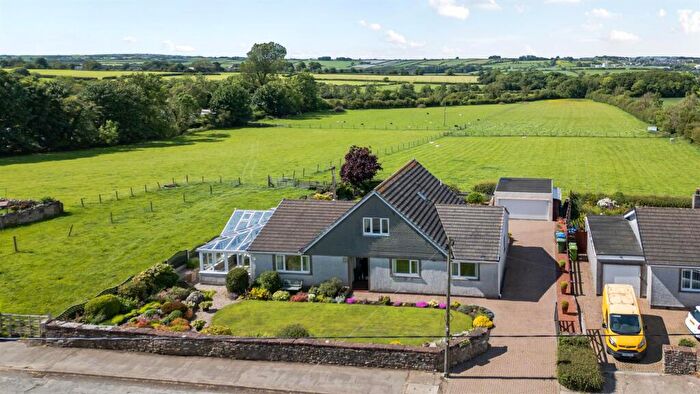
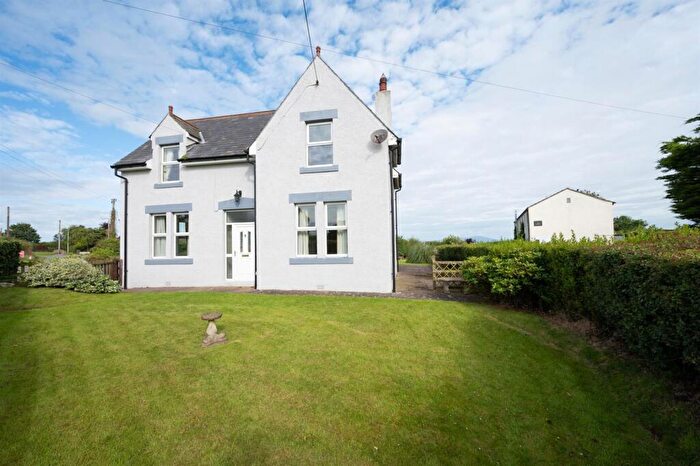
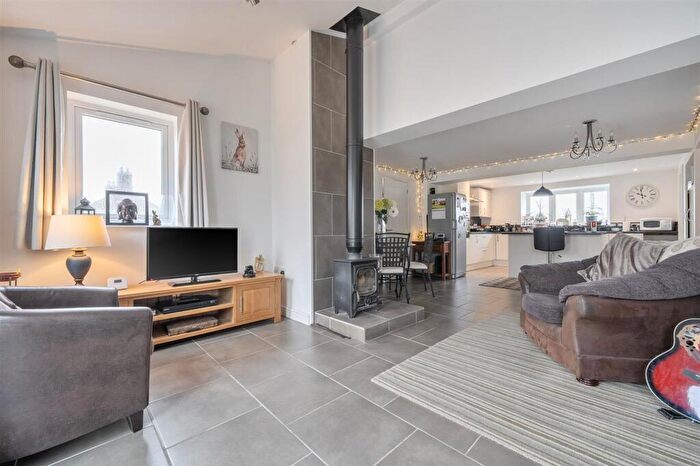
Properties for sale in Solway
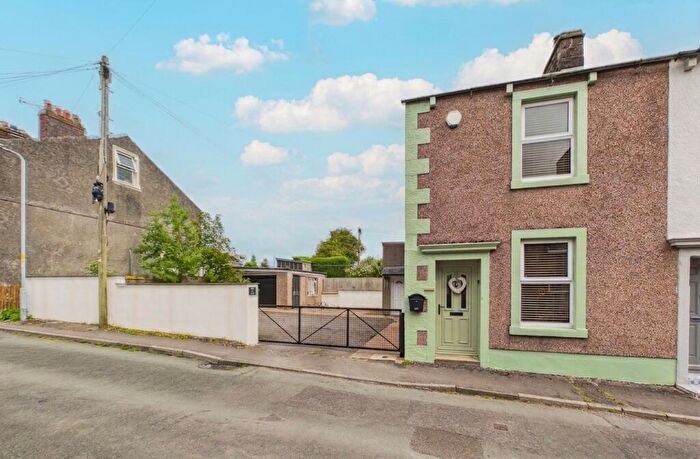
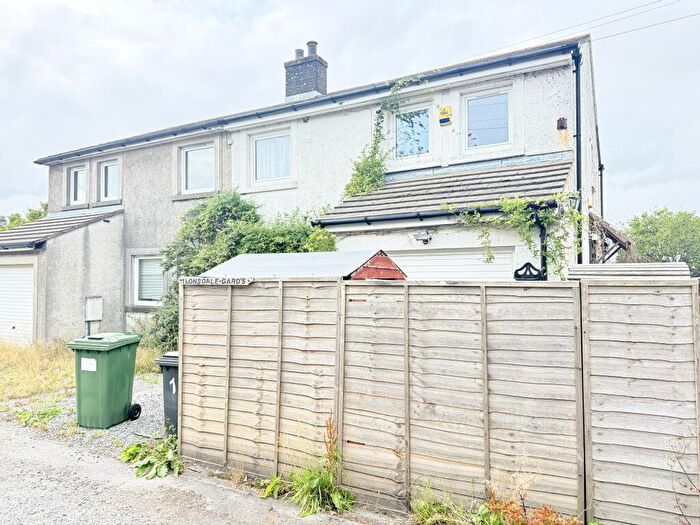
![]()
If you are looking to sell your house, let it out, or receive a property valuation, an expert can help you.
Click the button below to get started.

Roads and Postcodes in Solway
Navigate through our locations to find the location of your next house in Solway, Wigton for sale or to rent.
| Streets | Postcodes |
|---|---|
| Allerby | CA7 2NQ |
| Bankend Cottages | CA7 2ND |
| Beech Hill | CA7 2QA |
| Blencogo Farm Cottages | CA7 0DE |
| Brookside Cottages | CA7 3PA |
| Browns Houses | CA7 2LB |
| Chapel Terrace | CA7 2LU |
| Crookdake | CA7 3SH |
| East View | CA7 2DJ CA7 2LY |
| Gallabarrow | CA7 2PH |
| Garthside Cottages | CA7 3LZ |
| Green Bank Close | CA7 2LL |
| Hayton | CA7 2PA CA7 2PG CA7 2NN CA7 2NW CA7 2PD CA7 2PJ CA7 2PQ |
| Heathfield | CA7 3SN |
| High Scales | CA7 3NG |
| Holly Terrace | CA7 0DG |
| Leegate | CA7 0BW |
| Lime Kiln View | CA7 2PW |
| Low Scales | CA7 3NE |
| Meadow Bank | CA7 2LZ |
| Mealrigg | CA7 3LE |
| Moorside | CA7 2LW |
| New Court | CA7 2NL |
| New Houses Fauld | CA7 2PP |
| New Row | CA7 2PR |
| Oughterside | CA7 2PT CA7 2PY |
| Prospect | CA7 2JY CA7 2LD CA7 2LF CA7 2LN CA7 2LT CA7 2LX |
| Ritson Row | CA7 2NJ |
| Salterwath Close | CA7 2PB |
| Scales | CA7 3NL CA7 3NQ CA7 3NW |
| Scales Terrace | CA7 3NF |
| School Terrace | CA7 2PS |
| Sea View | CA7 2LE |
| Smithy Cottages | CA7 2NR |
| St Matthews Cottages | CA7 3NS |
| The Green | CA7 0DF CA7 2NH |
| The Guards | CA7 3PD |
| Watsons Terrace | CA7 2LS |
| West Moor End | CA7 2NG |
| Yearngill | CA7 3JX CA7 3JY CA7 3JZ |
| CA7 3LJ CA7 0BP CA7 0BT CA7 0BY CA7 0BZ CA7 3LH CA7 3LL CA7 3LN CA7 3LU CA7 3LY CA7 3NA CA7 3NB CA7 3NX CA7 3PB CA7 3PH CA7 3PQ |
Property price trends in Solway
According to the latest Land Registry data, the average home in Solway sold for £235,000 in 2026. That figure comes from 675 sales logged over the past 31 years.
Prices have fallen back over the last three years. Compared with 2023, when the typical sale came in around £274,146, that's a fall of roughly 14.3%.
Looking back five years, average prices are up about 9.4% since 2021, a gain of around £20,160 in cash terms.
Zoom out to the past decade for the fuller picture. Back in 2016, homes here averaged £205,062, so the typical sold price has climbed about 14.6% since then, roughly 1.4% a year. Stretch the view to fifteen years and that annual pace edges up closer to 2.1%.
Frequently asked questions about Solway
What is the average price for a property for sale in Solway?
The average price for a property for sale in Solway is £276,582. This amount is 30% higher than the average price in Wigton. There are 741 property listings for sale in Solway.
What streets have the most expensive properties for sale in Solway?
The streets with the most expensive properties for sale in Solway are Beech Hill at an average of £475,000, Low Scales at an average of £425,000 and High Scales at an average of £423,333.
What streets have the most affordable properties for sale in Solway?
The streets with the most affordable properties for sale in Solway are Holly Terrace at an average of £75,000, Scales Terrace at an average of £127,000 and Prospect at an average of £173,500.
Which train stations are available in or near Solway?
Some of the train stations available in or near Solway are Aspatria, Maryport and Wigton.
Property Price Paid in Solway by Year
The average sold property price by year was:
| Year | Average Sold Price | Price Change |
Sold Properties
|
|---|---|---|---|
| 2026 | £235,000 | 2% |
1 Property |
| 2025 | £230,050 | -37% |
10 Properties |
| 2024 | £314,600 | 13% |
15 Properties |
| 2023 | £274,146 | -1% |
26 Properties |
| 2022 | £277,100 | 22% |
15 Properties |
| 2021 | £214,840 | -19% |
32 Properties |
| 2020 | £255,157 | 21% |
25 Properties |
| 2019 | £202,447 | -4% |
24 Properties |
| 2018 | £210,234 | 8% |
27 Properties |
| 2017 | £193,687 | -6% |
25 Properties |
Property Price per Property Type in Solway
Here you can find historic sold price data in order to help with your property search.
The average Property Paid Price for specific property types in the last three years are:
| Property Type | Average Sold Price | Sold Properties |
|---|---|---|
| Semi Detached House | £218,958.00 | 12 Semi Detached Houses |
| Detached House | £325,633.00 | 30 Detached Houses |
| Terraced House | £198,580.00 | 10 Terraced Houses |
