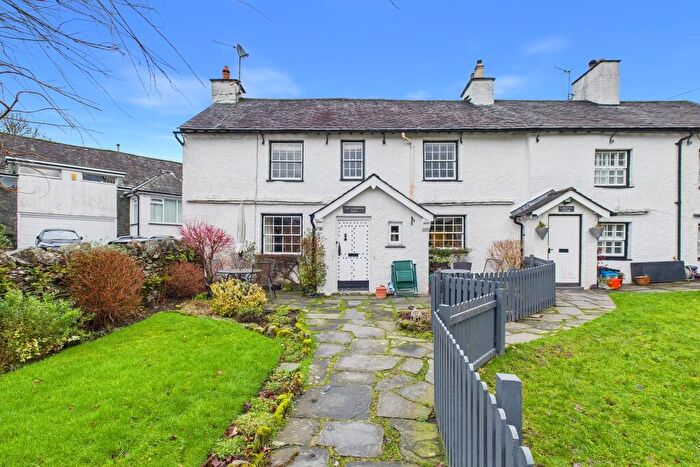
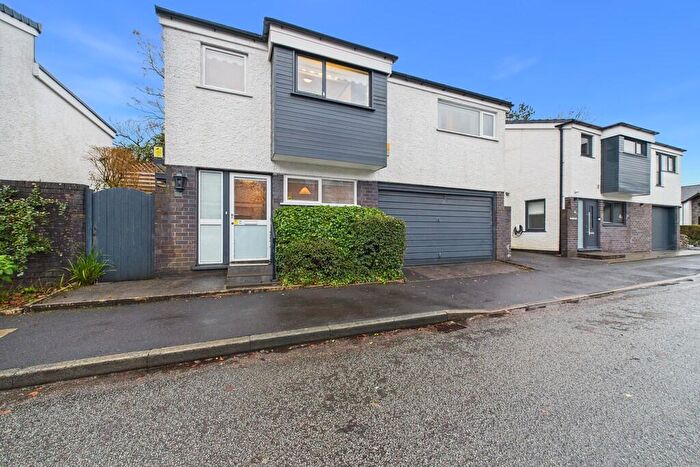
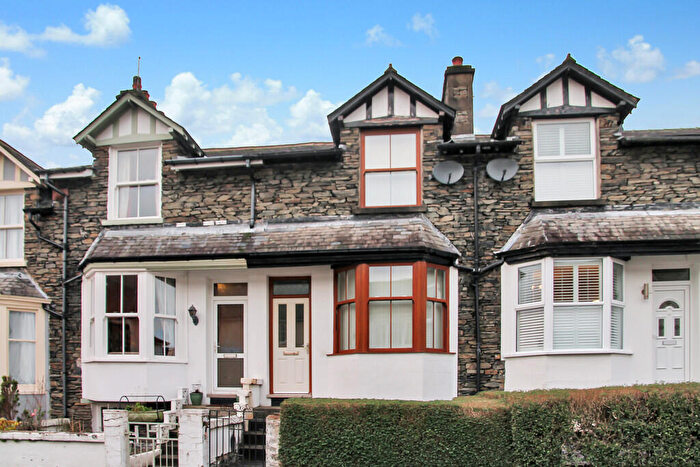
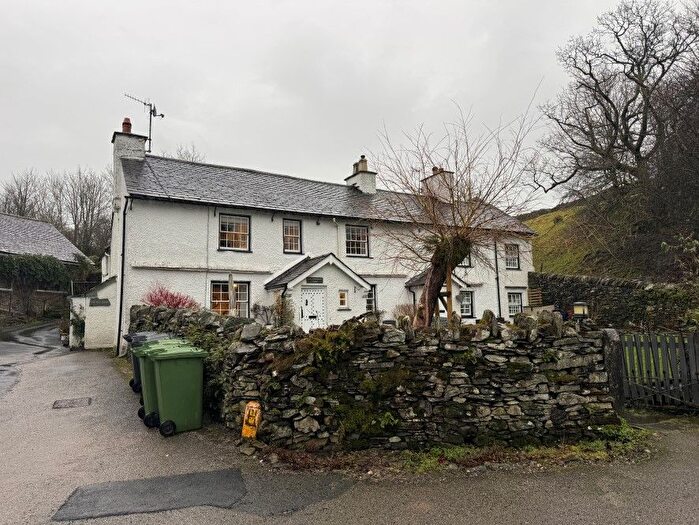
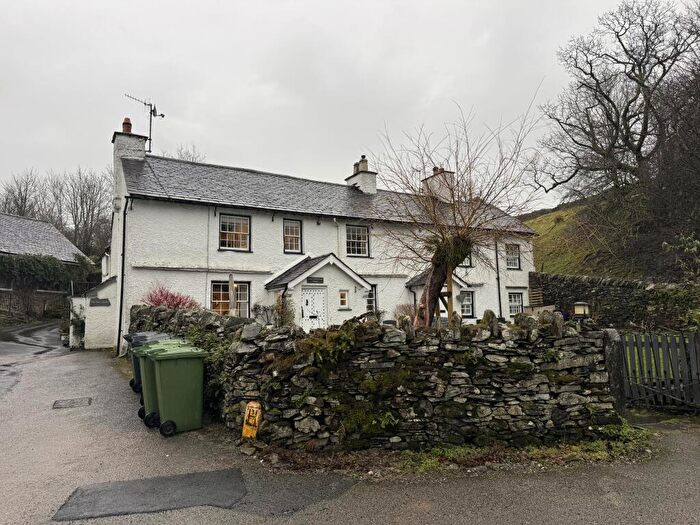
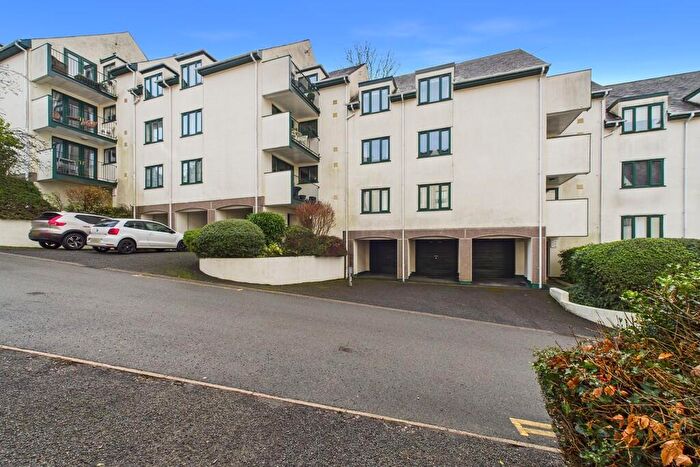
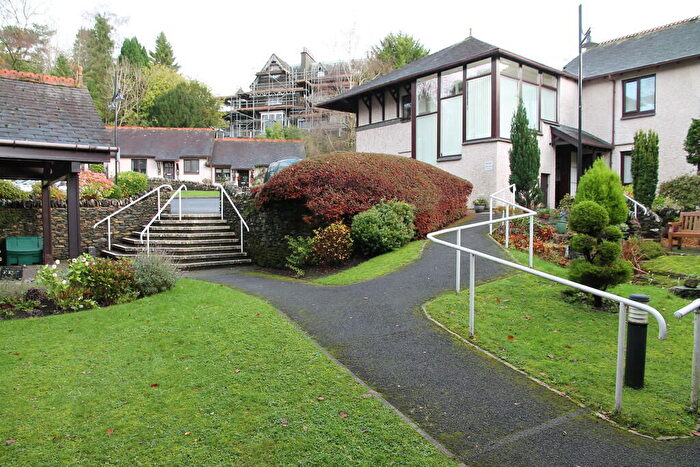
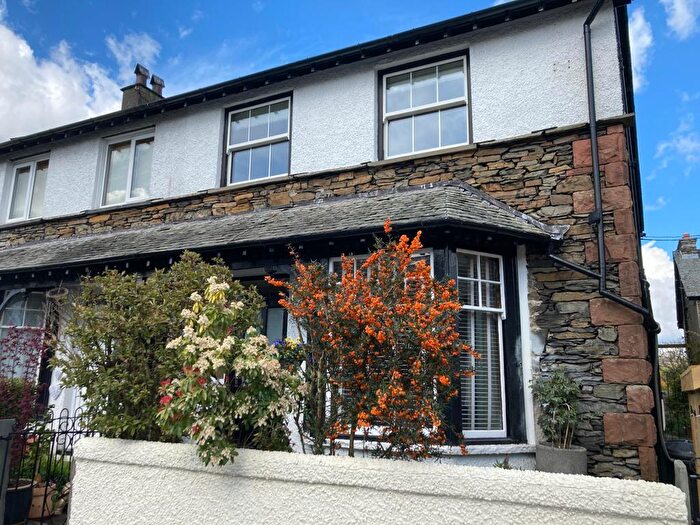
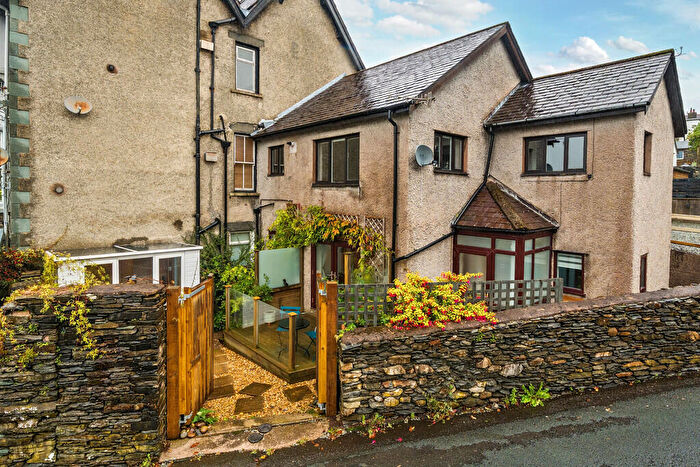
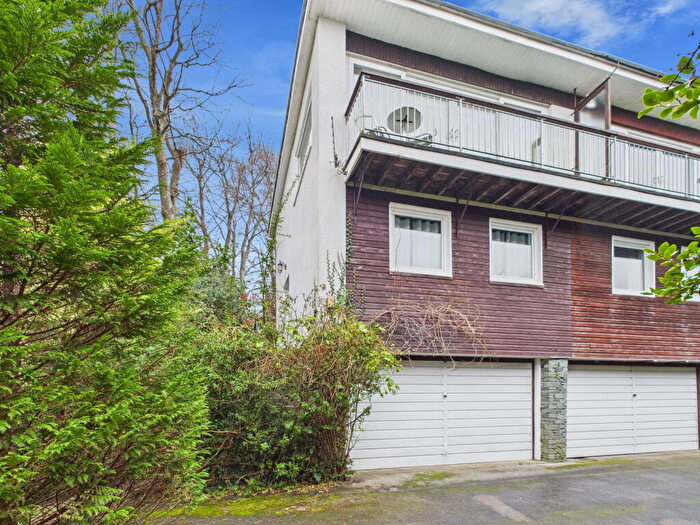
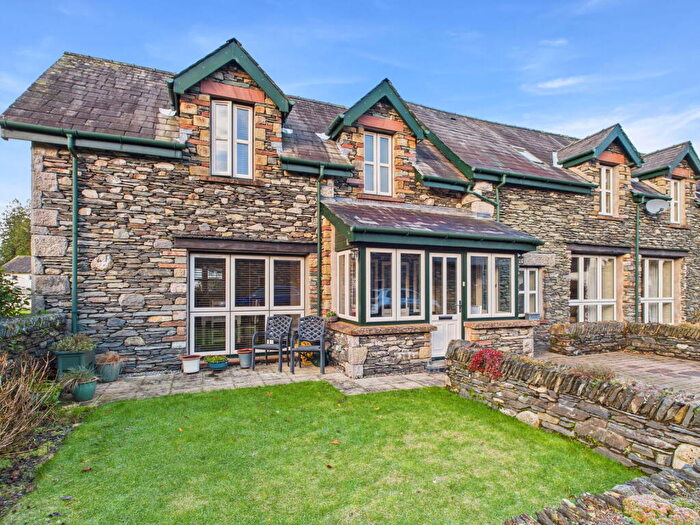
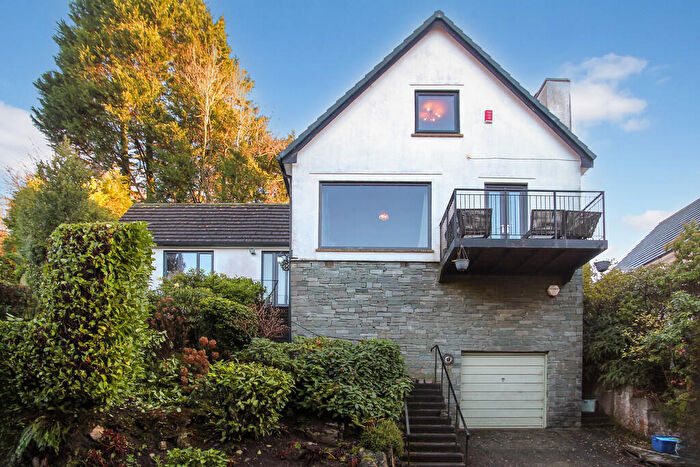
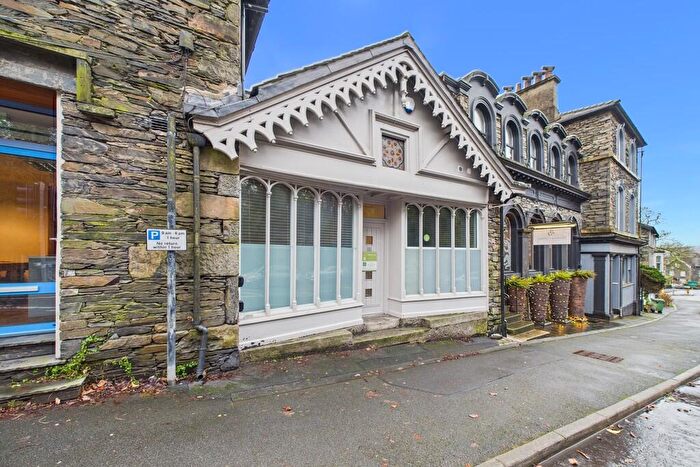
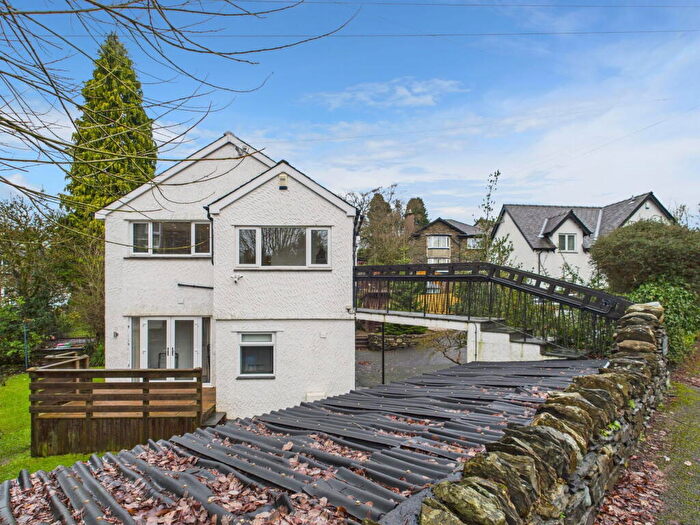
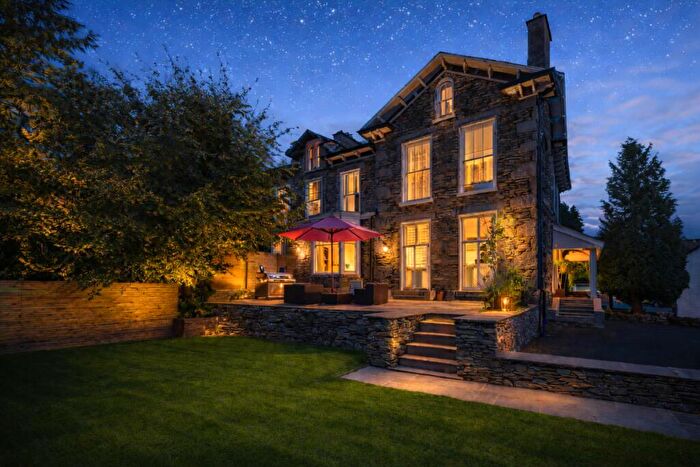
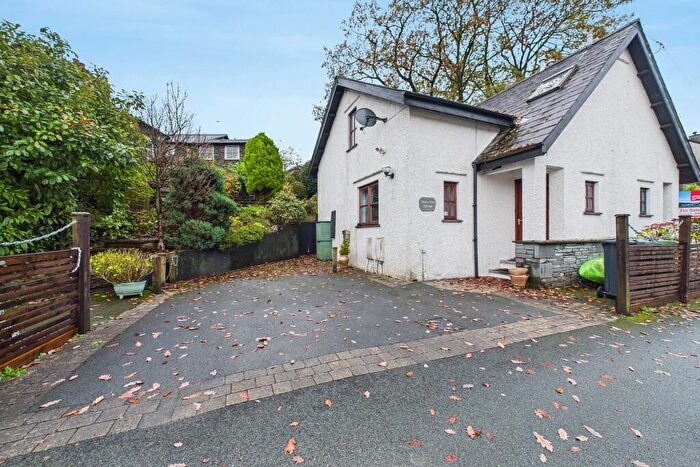
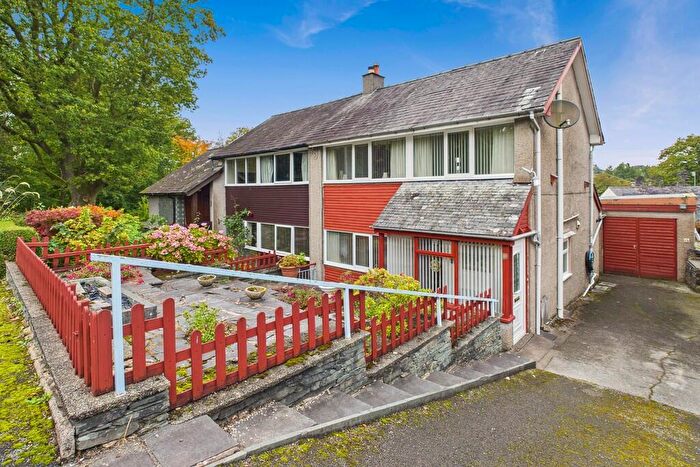
Houses for sale & to rent in Windermere Bowness North, Windermere
House Prices in Windermere Bowness North
Properties in Windermere Bowness North have an average house price of £495,910.00 and had 83 Property Transactions within the last 3 years¹.
Windermere Bowness North is an area in Windermere, Cumbria with 861 households², where the most expensive property was sold for £2,488,150.00.
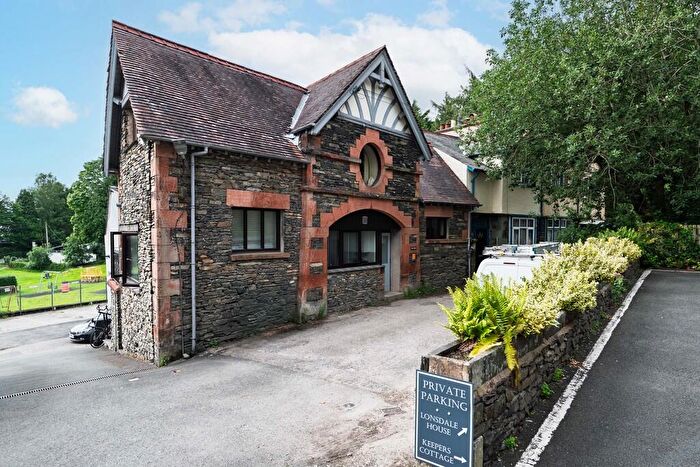
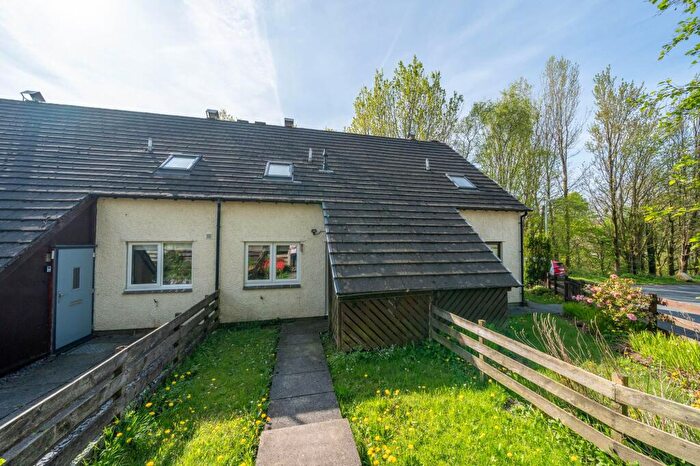
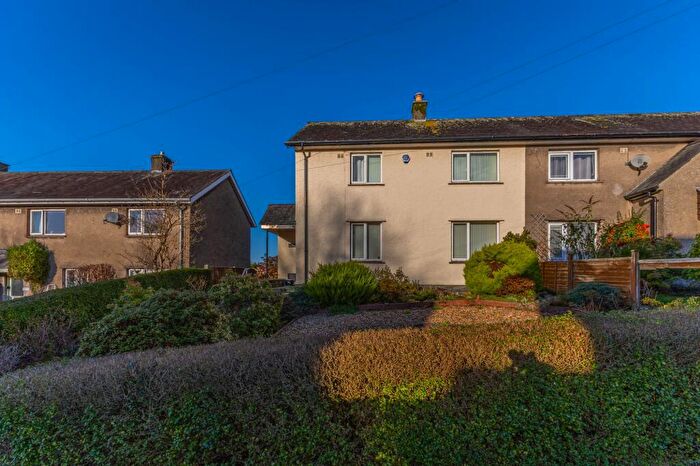
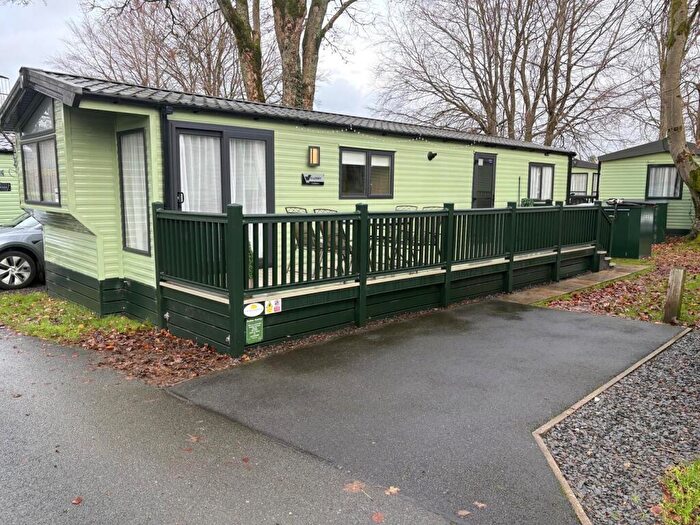
Properties for sale in Windermere Bowness North
Roads and Postcodes in Windermere Bowness North
Navigate through our locations to find the location of your next house in Windermere Bowness North, Windermere for sale or to rent.
| Streets | Postcodes |
|---|---|
| Alexandra Road | LA23 2AY LA23 2DA |
| Annisgarth | LA23 2HF |
| Annisgarth Avenue | LA23 2HR |
| Annisgarth Close | LA23 2HP |
| Annisgarth Drive | LA23 2HD |
| Annisgarth Park | LA23 2HX |
| Birkfield Road | LA23 2AT |
| Biskey Howe Park | LA23 2HU |
| Brook Road | LA23 2BU LA23 2ED |
| Brookside | LA23 2BX |
| Brow Close | LA23 2HA |
| Brow Crescent | LA23 2EY LA23 2EZ |
| Cleabarrow | LA23 3NA |
| Cornbirthwaite Road | LA23 1DG LA23 1DJ |
| Craig Court | LA23 2JU |
| Craig Walk | LA23 2ES LA23 2HB LA23 2JT |
| Ellerthwaite Road | LA23 2AH LA23 2BS LA23 2PR |
| Helm Road | LA23 2HS |
| High Cleabarrow | LA23 3ND |
| Hill Top | LA23 2HG |
| Lake Road | LA23 2DB LA23 2EQ LA23 2JD LA23 2JE LA23 2JF |
| Langdale Crescent | LA23 2HE |
| Lickbarrow Close | LA23 2NF |
| Lickbarrow Road | LA23 2EB LA23 2NG LA23 2NQ |
| Longlands Road | LA23 1DN |
| Meadow Road | LA23 2EU LA23 2EX |
| New Road | LA23 2LA |
| North Craig | LA23 2ET |
| Oakthwaite Road | LA23 2BA LA23 2BB LA23 2BD |
| Oldfield Court | LA23 2HH |
| Oldfield Road | LA23 2AZ LA23 2BY |
| Park Avenue | LA23 2AR LA23 2AX |
| Park Road | LA23 2AW LA23 2BE LA23 2BG LA23 2BJ LA23 2DJ |
| Princes Road | LA23 2DD |
| Queens Drive | LA23 2EL |
| South Craig | LA23 2JH LA23 2JQ |
| South Crescent | LA23 1DH |
| Springfield Road | LA23 2AU |
| Sunny Bank Road | LA23 2EN |
| Thorn Hill | LA23 2DX |
| Thornbarrow Drive | LA23 2EP |
| Thornbarrow Road | LA23 2DF LA23 2DG LA23 2DQ LA23 2EW |
| West Crescent | LA23 1DQ |
| Whinfield Road | LA23 2AS |
| Windermere Park | LA23 2NB LA23 2ND |
| Woodland Grove | LA23 2BT |
| Woodland Road | LA23 2AN |
Transport near Windermere Bowness North
-
Windermere Station
-
Staveley (Cumbria) Station
-
Burneside Station
-
Kendal Station
-
Oxenholme Lake District Station
- FAQ
- Price Paid By Year
- Property Type Price
Frequently asked questions about Windermere Bowness North
What is the average price for a property for sale in Windermere Bowness North?
The average price for a property for sale in Windermere Bowness North is £495,910. This amount is 2% higher than the average price in Windermere. There are 193 property listings for sale in Windermere Bowness North.
What streets have the most expensive properties for sale in Windermere Bowness North?
The streets with the most expensive properties for sale in Windermere Bowness North are South Crescent at an average of £1,395,000, Thornbarrow Road at an average of £756,666 and Windermere Park at an average of £733,583.
What streets have the most affordable properties for sale in Windermere Bowness North?
The streets with the most affordable properties for sale in Windermere Bowness North are Ellerthwaite Road at an average of £140,777, Oldfield Court at an average of £240,000 and Whinfield Road at an average of £250,000.
Which train stations are available in or near Windermere Bowness North?
Some of the train stations available in or near Windermere Bowness North are Windermere, Staveley (Cumbria) and Burneside.
Property Price Paid in Windermere Bowness North by Year
The average sold property price by year was:
| Year | Average Sold Price | Price Change |
Sold Properties
|
|---|---|---|---|
| 2025 | £314,450 | -69% |
26 Properties |
| 2024 | £530,656 | -16% |
24 Properties |
| 2023 | £613,610 | 32% |
33 Properties |
| 2022 | £416,106 | 0,4% |
34 Properties |
| 2021 | £414,594 | 3% |
61 Properties |
| 2020 | £403,837 | 1% |
34 Properties |
| 2019 | £398,187 | 25% |
40 Properties |
| 2018 | £298,510 | -20% |
47 Properties |
| 2017 | £357,308 | 5% |
58 Properties |
| 2016 | £338,186 | 20% |
46 Properties |
| 2015 | £269,042 | -18% |
35 Properties |
| 2014 | £316,633 | -8% |
37 Properties |
| 2013 | £342,036 | 8% |
29 Properties |
| 2012 | £315,200 | 0,4% |
25 Properties |
| 2011 | £314,045 | -4% |
32 Properties |
| 2010 | £327,855 | 2% |
19 Properties |
| 2009 | £322,234 | 11% |
42 Properties |
| 2008 | £285,341 | -15% |
33 Properties |
| 2007 | £327,968 | 16% |
53 Properties |
| 2006 | £275,140 | 6% |
60 Properties |
| 2005 | £259,210 | -0,3% |
45 Properties |
| 2004 | £259,938 | 4% |
59 Properties |
| 2003 | £249,922 | 33% |
48 Properties |
| 2002 | £167,553 | 20% |
71 Properties |
| 2001 | £133,828 | 2% |
58 Properties |
| 2000 | £131,336 | 1% |
62 Properties |
| 1999 | £129,496 | 15% |
59 Properties |
| 1998 | £110,205 | 13% |
59 Properties |
| 1997 | £96,303 | -6% |
64 Properties |
| 1996 | £102,363 | 25% |
57 Properties |
| 1995 | £76,371 | - |
40 Properties |
Property Price per Property Type in Windermere Bowness North
Here you can find historic sold price data in order to help with your property search.
The average Property Paid Price for specific property types in the last three years are:
| Property Type | Average Sold Price | Sold Properties |
|---|---|---|
| Semi Detached House | £426,130.00 | 21 Semi Detached Houses |
| Detached House | £767,630.00 | 28 Detached Houses |
| Terraced House | £428,000.00 | 19 Terraced Houses |
| Flat | £172,413.00 | 15 Flats |


