
Houses for sale in Ennerdale, Workington
House Prices in Ennerdale
Properties in Ennerdale have an average house price of £321k and had 12 Property Transactions within the last 3 years¹.
Ennerdale is an area in Workington, Cumbria with 171 households², where the most expensive property was sold for £460k.
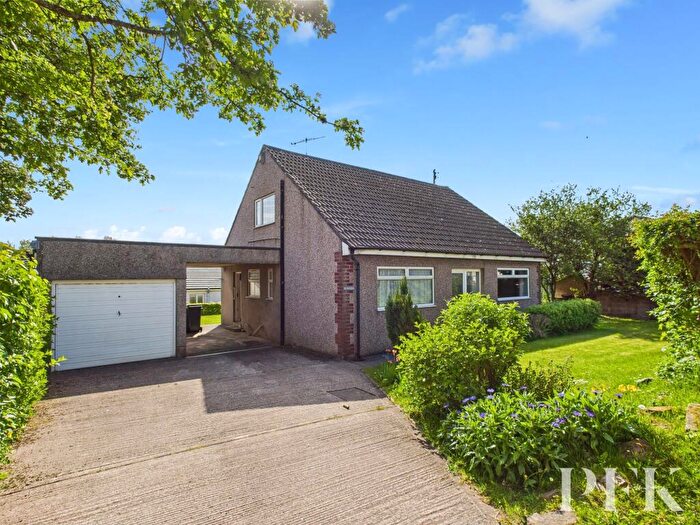
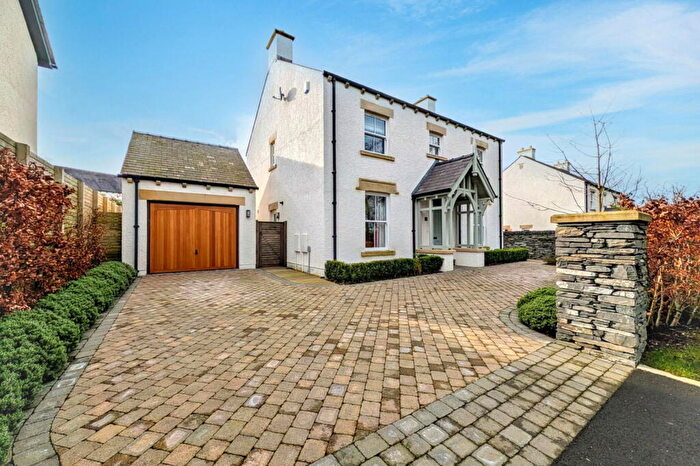
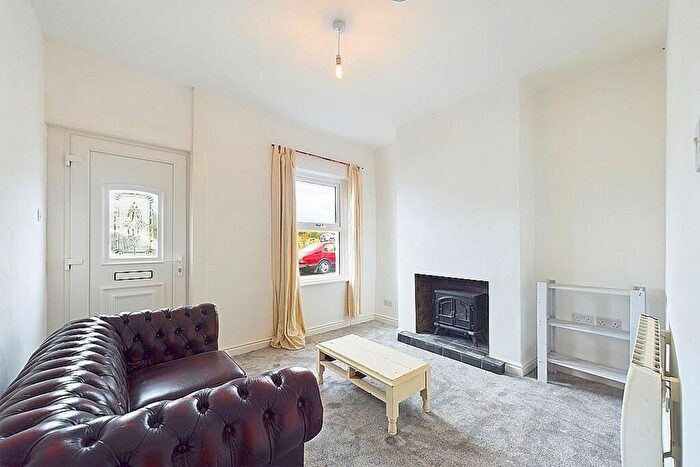
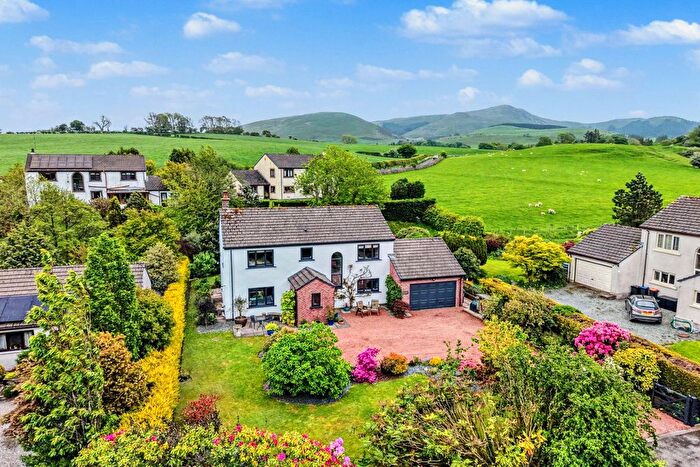
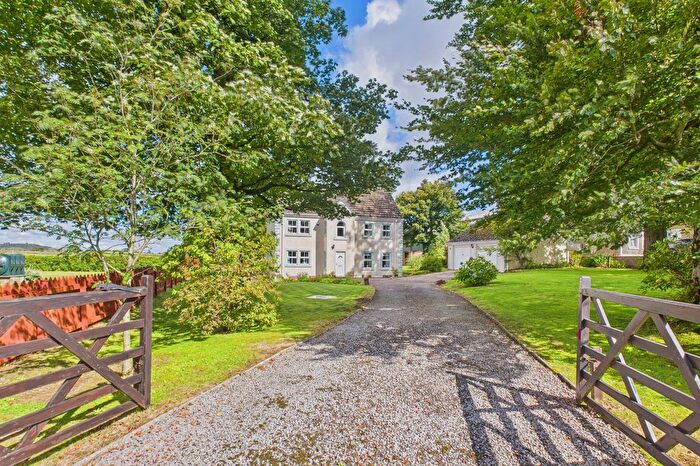
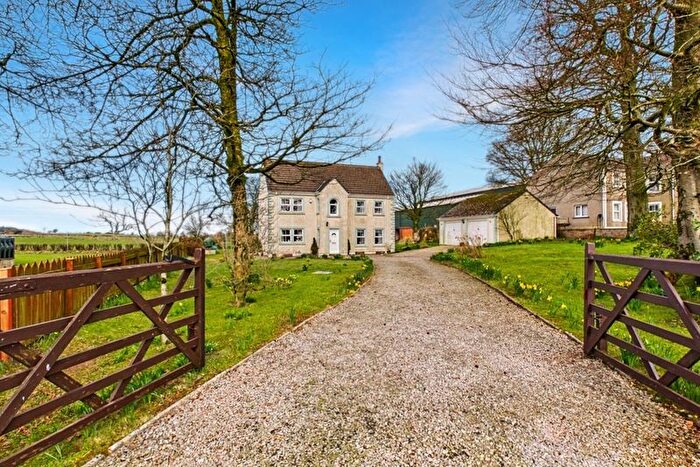
Properties for sale in Ennerdale
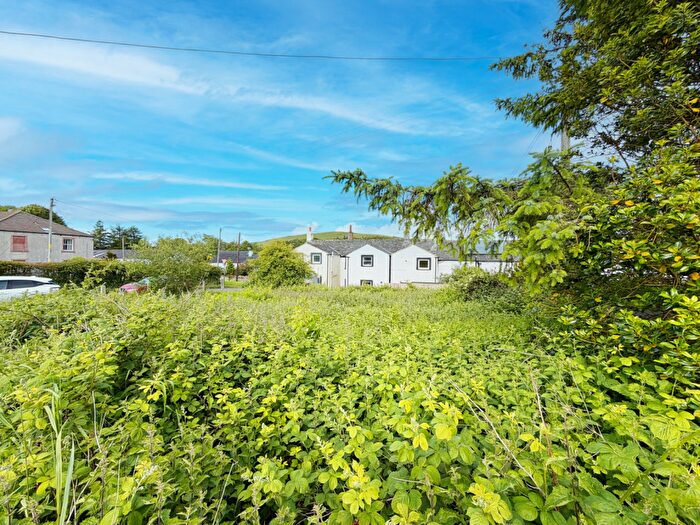
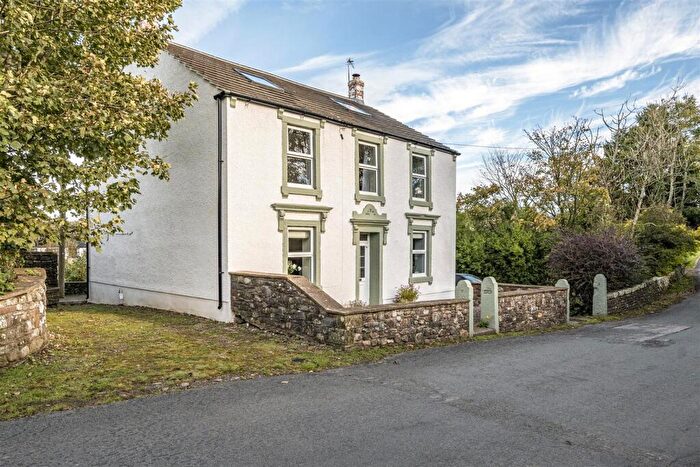
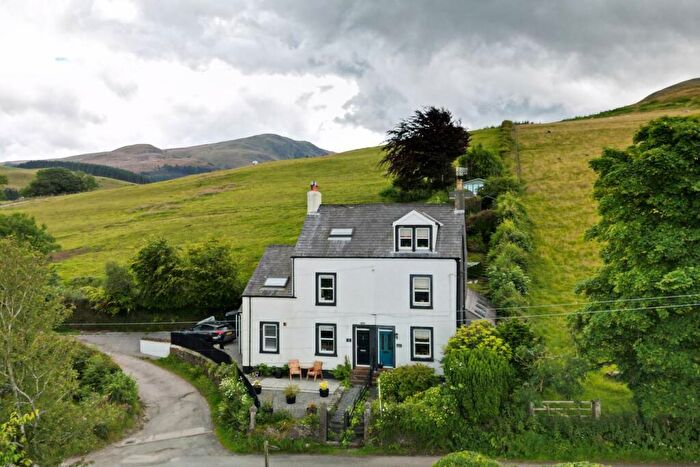
![]()
If you are looking to sell your house, let it out, or receive a property valuation, an expert can help you.
Click the button below to get started.
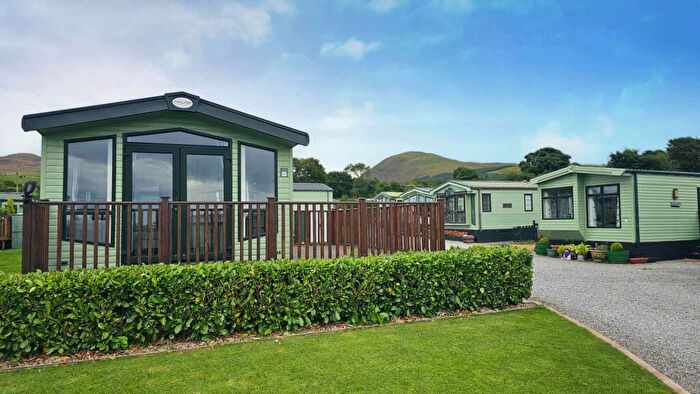
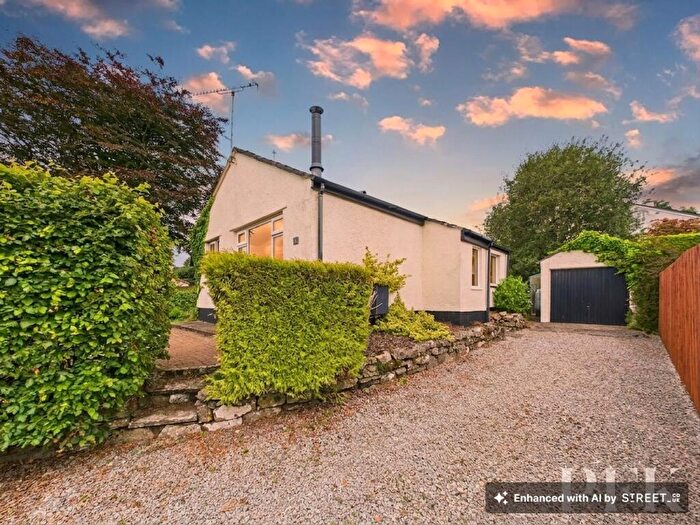

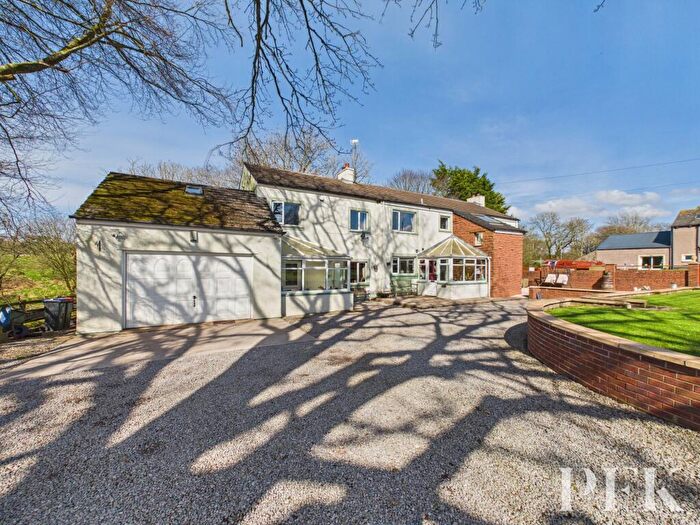
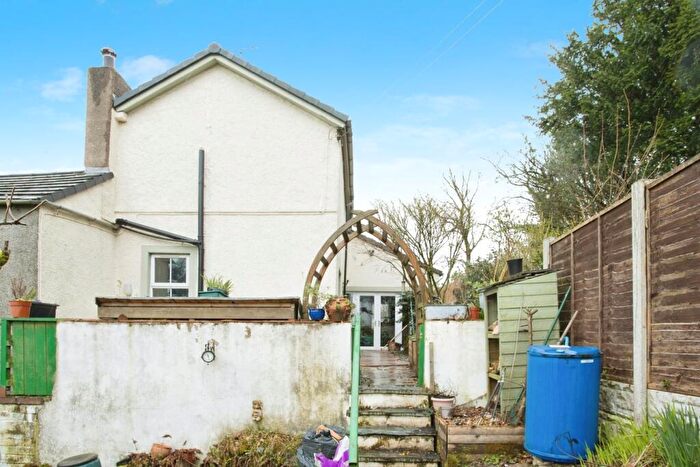
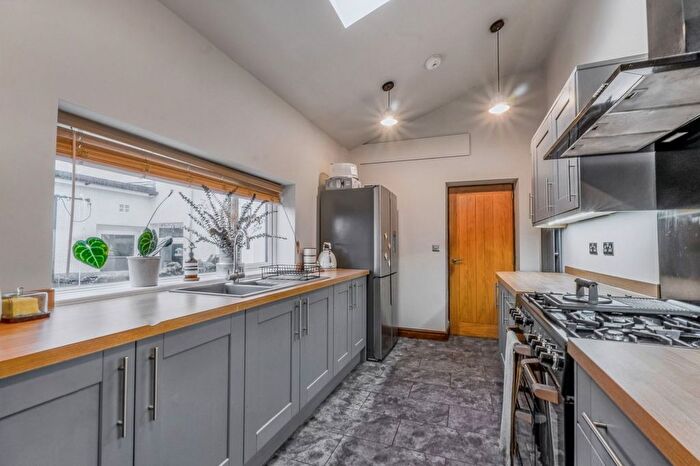
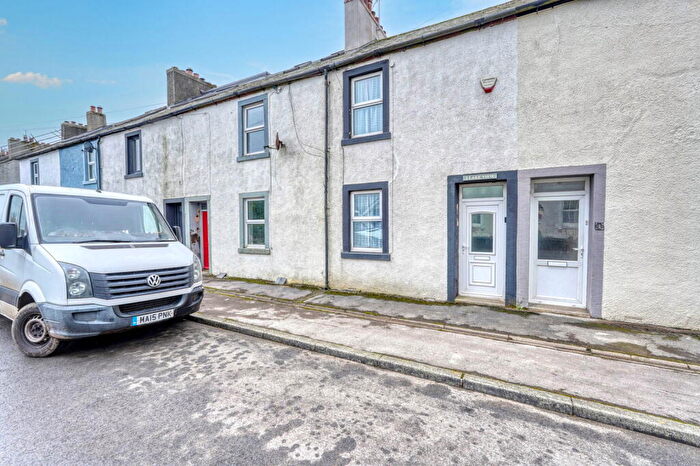
Previously listed properties in Ennerdale
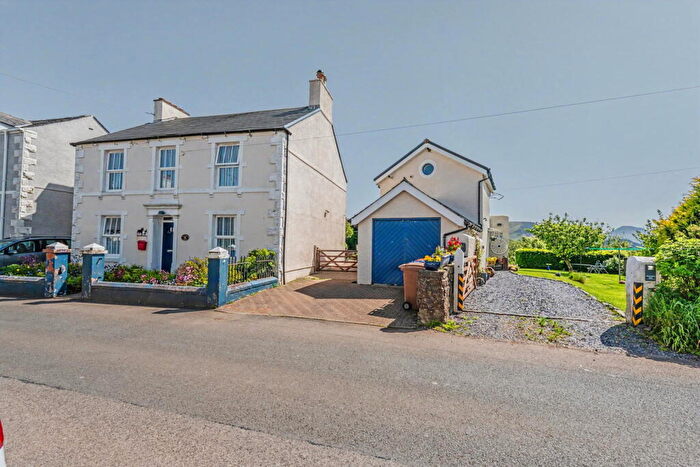
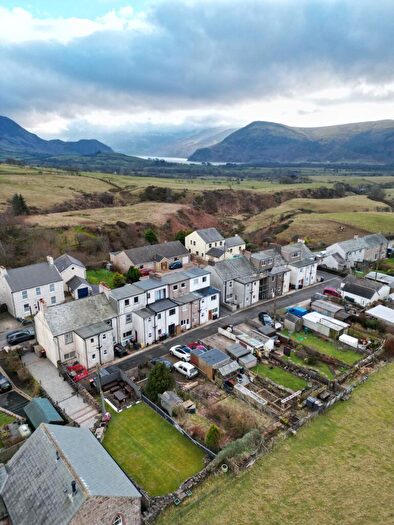
![]()
If you are looking to sell your house, let it out, or receive a property valuation, an expert can help you.
Click the button below to get started.
Roads and Postcodes in Ennerdale
Navigate through our locations to find the location of your next house in Ennerdale, Workington for sale or to rent.
| Streets | Postcodes |
|---|---|
| Cross Gates | CA14 4TU |
| Follet Close | CA14 4TX |
| CA14 4SA CA14 4SB CA14 4SF CA14 4SG CA14 4SH CA14 4SQ CA14 4TT CA14 4TY CA14 4TZ |
Property price trends in Ennerdale
According to the latest Land Registry data, the average home in Ennerdale sold for £313,000 in 2025. That figure comes from 154 sales logged over the past 30 years.
Prices have fallen back over the last three years. Compared with 2022, when the typical sale came in around £334,777, that's a fall of roughly 6.5%.
Looking back five years, average prices are down about 18.8% since 2020, a drop of around £72,250 in cash terms.
Zoom out to the past decade for the fuller picture. Back in 2015, homes here averaged £273,071, so the typical sold price has climbed about 14.6% since then, roughly 1.4% a year. Stretch the view to fifteen years and that annual pace eases back to about -0.6%.
Frequently asked questions about Ennerdale
What is the average price for a property for sale in Ennerdale?
The average price for a property for sale in Ennerdale is £321,041. This amount is 107% higher than the average price in Workington. There are 122 property listings for sale in Ennerdale.
Which train stations are available in or near Ennerdale?
Some of the train stations available in or near Ennerdale are Parton, Harrington and Whitehaven.
Property Price Paid in Ennerdale by Year
The average sold property price by year was:
| Year | Average Sold Price | Price Change |
Sold Properties
|
|---|---|---|---|
| 2025 | £313,000 | -26% |
5 Properties |
| 2024 | £393,333 | 30% |
3 Properties |
| 2023 | £276,875 | -21% |
4 Properties |
| 2022 | £334,777 | 9% |
9 Properties |
| 2021 | £305,800 | -26% |
5 Properties |
| 2020 | £385,250 | 30% |
4 Properties |
| 2019 | £268,357 | 2% |
7 Properties |
| 2018 | £262,156 | 45% |
8 Properties |
| 2017 | £143,833 | -114% |
6 Properties |
| 2016 | £308,400 | 11% |
5 Properties |
Property Price per Property Type in Ennerdale
Here you can find historic sold price data in order to help with your property search.
The average Property Paid Price for specific property types in the last three years are:
| Property Type | Average Sold Price | Sold Properties |
|---|---|---|
| Semi Detached House | £305,625.00 | 4 Semi Detached Houses |
| Terraced House | £75,000.00 | 2 Terraced Houses |
| Detached House | £413,333.00 | 6 Detached Houses |
