
Houses for sale in Stainburn, Workington
House Prices in Stainburn
Properties in Stainburn have an average house price of £218k and had 80 Property Transactions within the last 3 years¹.
Stainburn is an area in Workington, Cumbria with 714 households², where the most expensive property was sold for £630k.
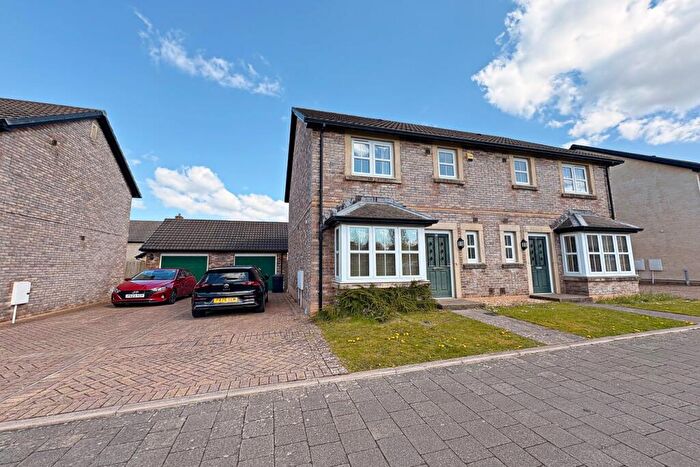
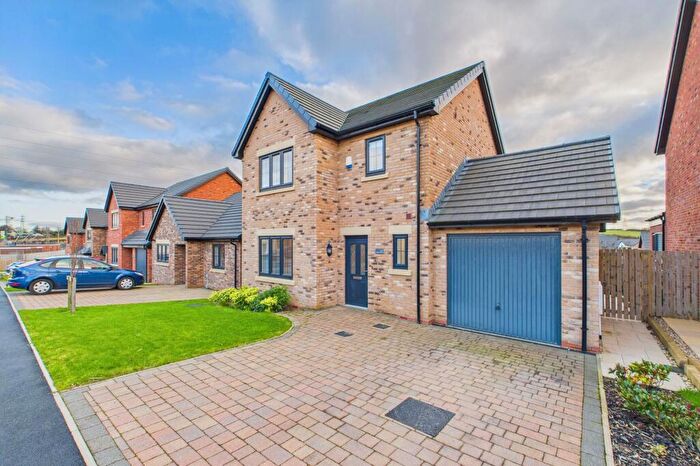
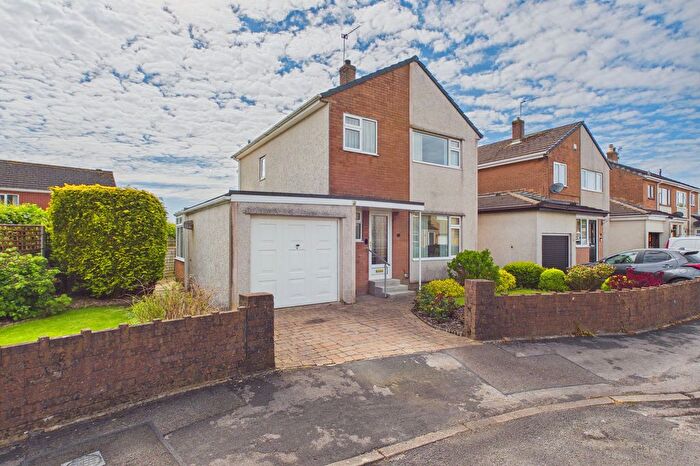
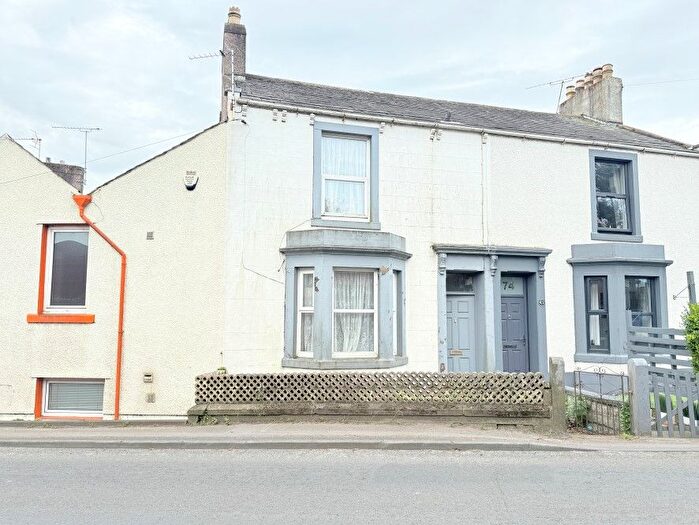
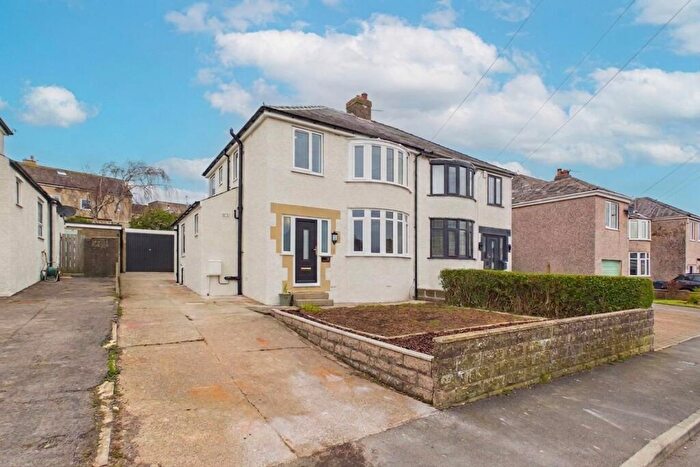
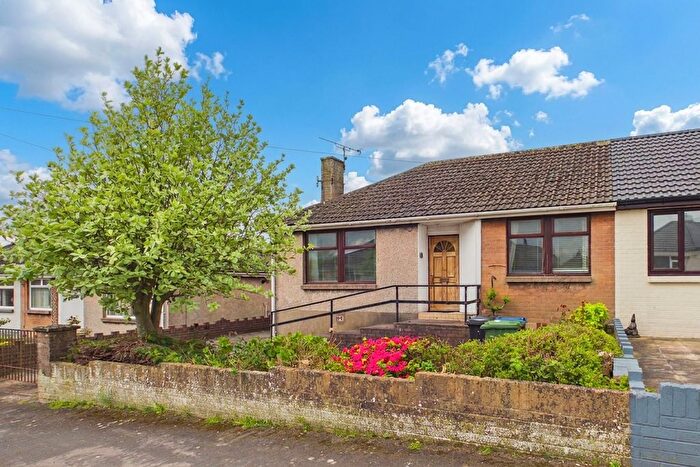
Properties for sale in Stainburn
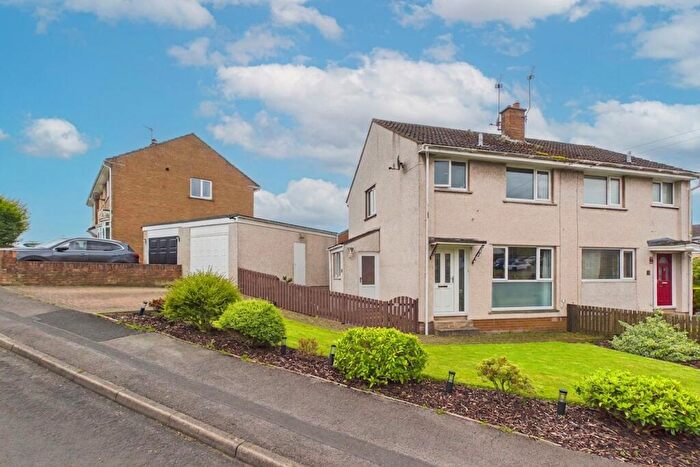
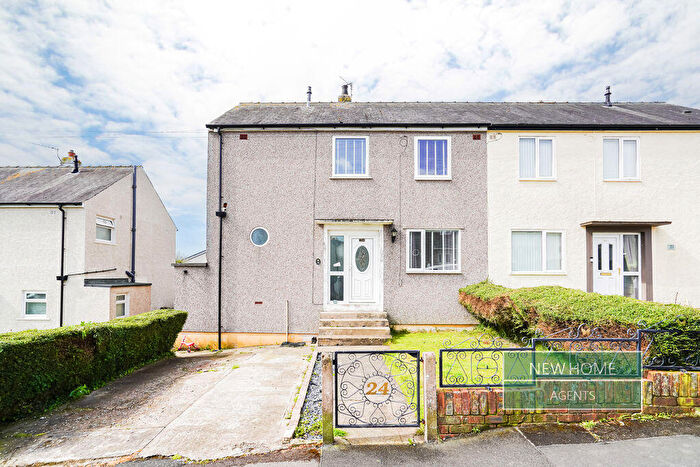
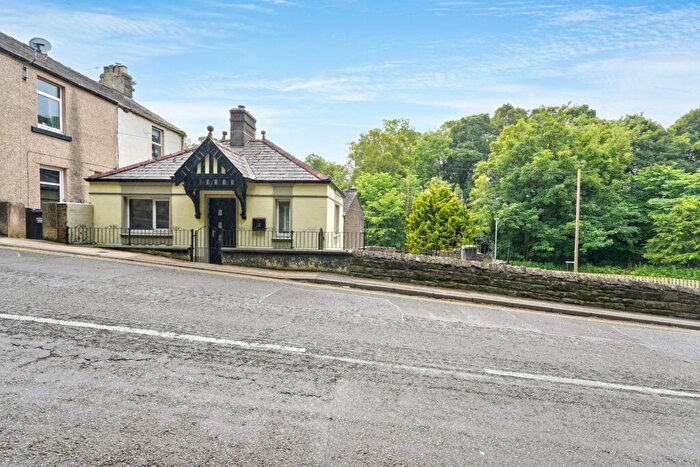
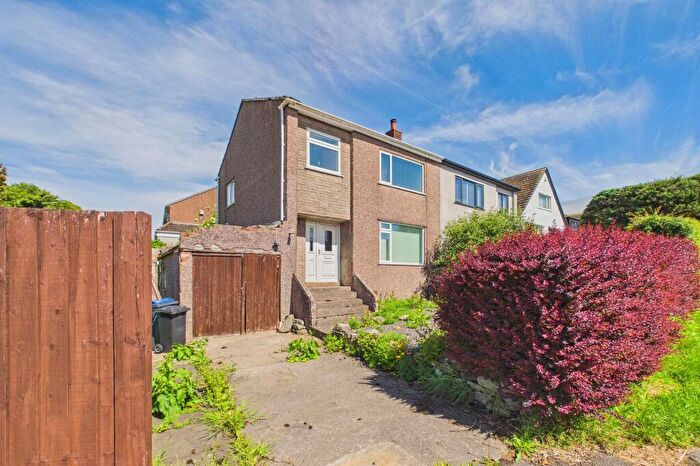
![]()
If you are looking to sell your house, let it out, or receive a property valuation, an expert can help you.
Click the button below to get started.
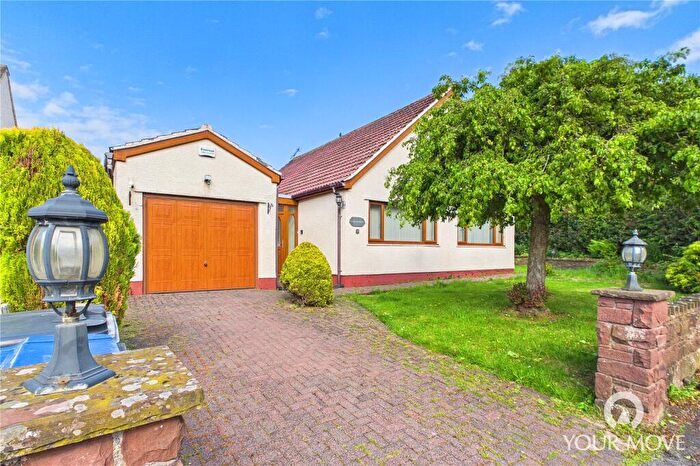
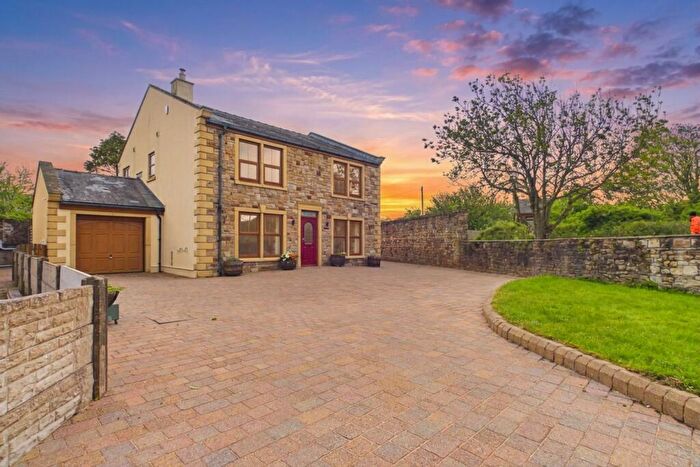
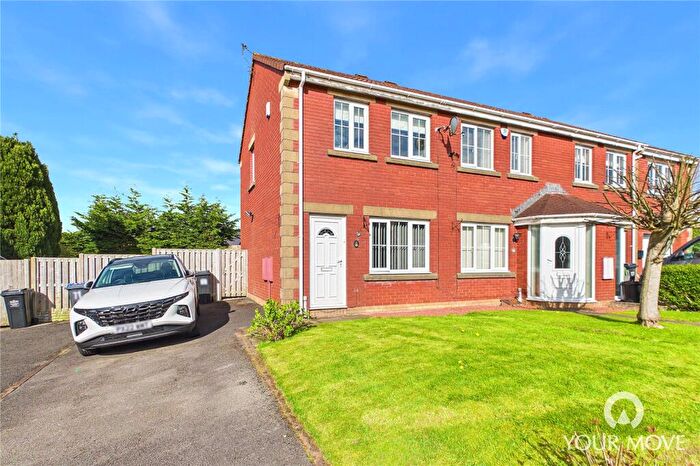
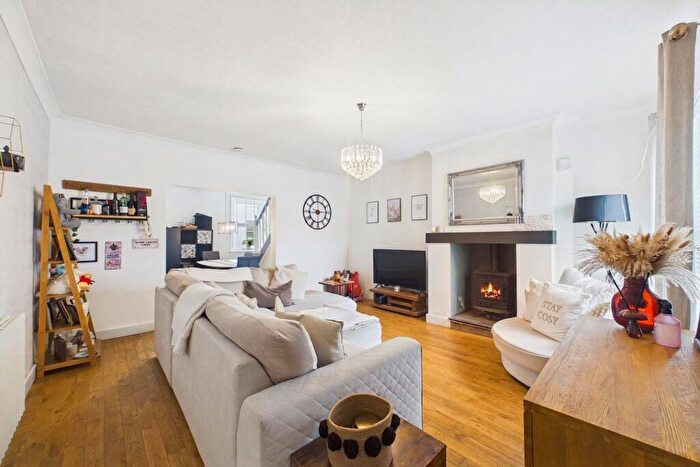
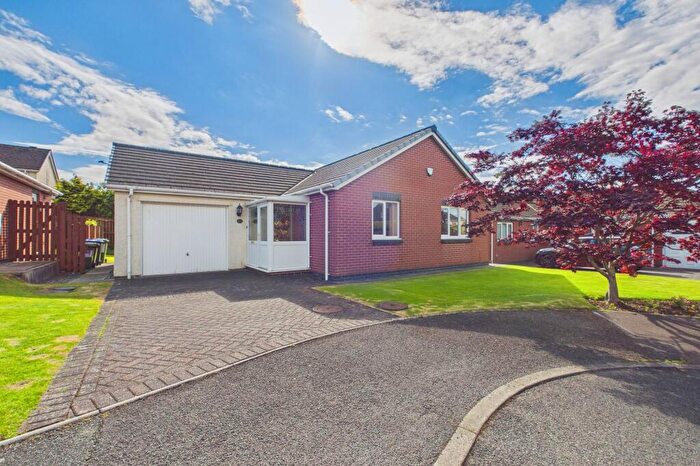
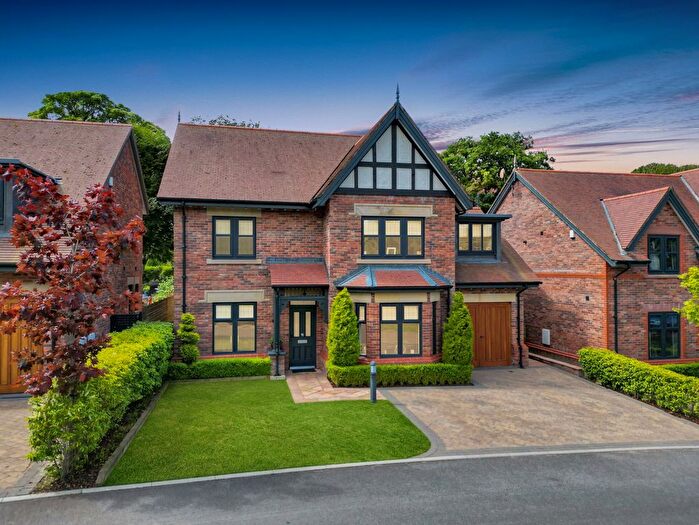
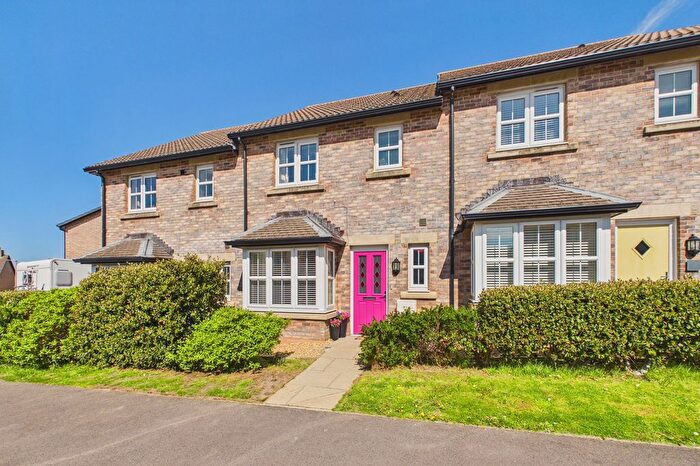
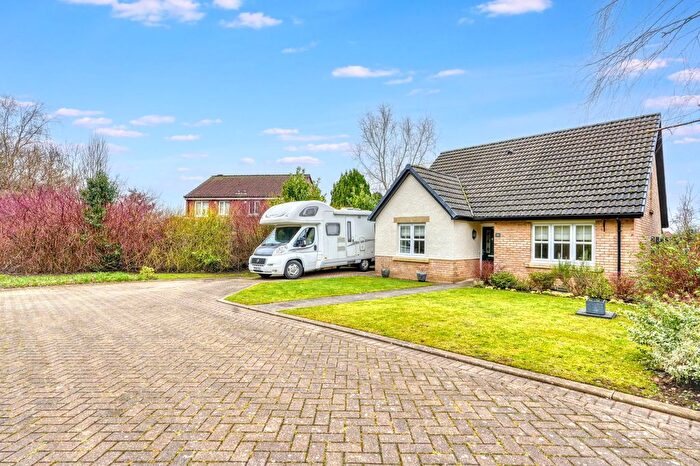
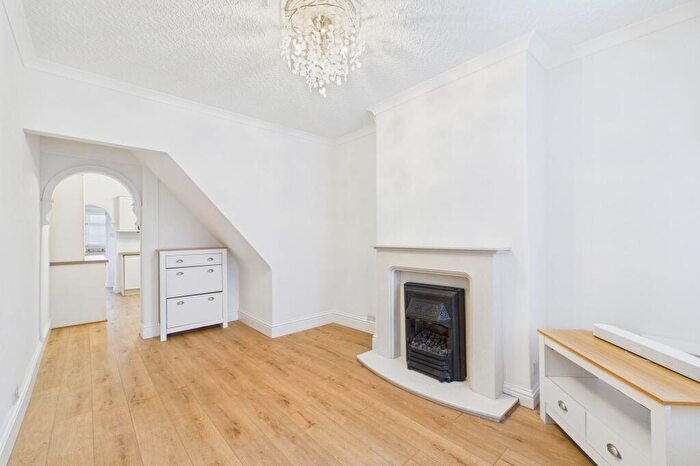
Previously listed properties in Stainburn
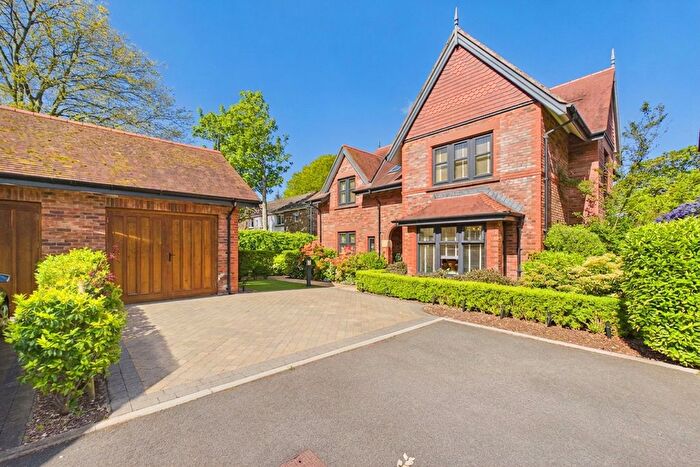
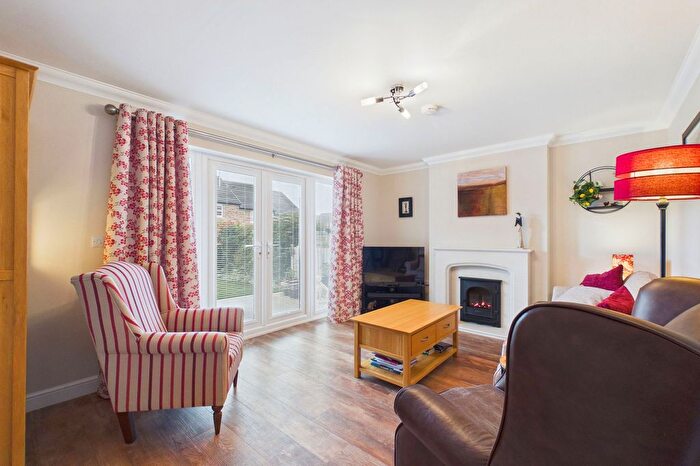
![]()
If you are looking to sell your house, let it out, or receive a property valuation, an expert can help you.
Click the button below to get started.
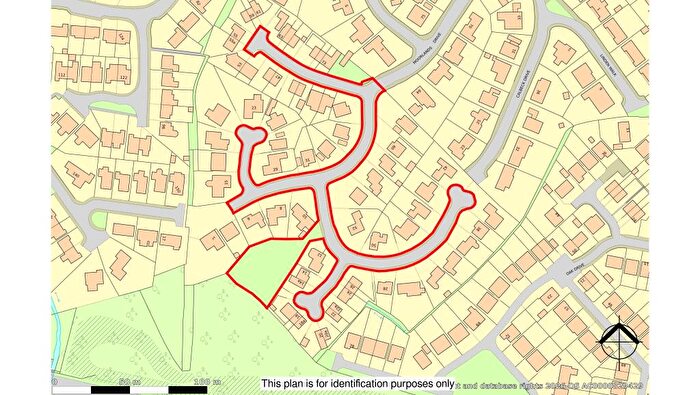
Roads and Postcodes in Stainburn
Navigate through our locations to find the location of your next house in Stainburn, Workington for sale or to rent.
| Streets | Postcodes |
|---|---|
| Briery Acres | CA14 1XQ |
| Briery Croft | CA14 1XJ |
| Brierydale Lane | CA14 4UH |
| Caldbeck Drive | CA14 4UN |
| Curwendale | CA14 4UT |
| Derwent Meadows | CA14 1EL |
| Linden Walk | CA14 4UW |
| Moor Road | CA14 1XH CA14 1XL CA14 1XN CA14 1XW |
| Moorlands Drive | CA14 4UJ CA14 4UL |
| Park Drive | CA14 1SP |
| Park End Road | CA14 4DE |
| River View | CA14 1SR |
| St Andrews Road | CA14 1YY |
| Stainburn Road | CA14 1SL CA14 1SN CA14 1SS CA14 1ST CA14 1SW CA14 1SY CA14 1SZ CA14 4EA |
| Thorncroft Gardens | CA14 4DP |
| Uldale Road | CA14 4UR |
| Wentworth Park | CA14 1XP |
| Wollenscroft | CA14 4UP |
Property price trends in Stainburn
According to the latest Land Registry data, the average home in Stainburn sold for £40,000 in 2026. That figure comes from 1,014 sales logged over the past 31 years.
Prices have fallen back over the last three years. Compared with 2023, when the typical sale came in around £214,014, that's a fall of roughly 81.3%.
Looking back five years, average prices are down about 77.4% since 2021, a drop of around £137,071 in cash terms.
Zoom out to the past decade for the fuller picture. Back in 2016, homes here averaged £178,256, so the typical sold price has fallen about 77.6% since then, around 13.9% a year lower. Stretch the view to fifteen years and that annual pace edges up closer to -8.3%.
Frequently asked questions about Stainburn
What is the average price for a property for sale in Stainburn?
The average price for a property for sale in Stainburn is £218,155. This amount is 41% higher than the average price in Workington. There are 285 property listings for sale in Stainburn.
What streets have the most expensive properties for sale in Stainburn?
The streets with the most expensive properties for sale in Stainburn are River View at an average of £521,000, Briery Croft at an average of £425,000 and Caldbeck Drive at an average of £325,000.
What streets have the most affordable properties for sale in Stainburn?
The streets with the most affordable properties for sale in Stainburn are Wollenscroft at an average of £101,600, Park End Road at an average of £111,944 and Uldale Road at an average of £184,000.
Which train stations are available in or near Stainburn?
Some of the train stations available in or near Stainburn are Workington, Harrington and Flimby.
Property Price Paid in Stainburn by Year
The average sold property price by year was:
| Year | Average Sold Price | Price Change |
Sold Properties
|
|---|---|---|---|
| 2026 | £40,000 | -467% |
1 Property |
| 2025 | £226,776 | 2% |
25 Properties |
| 2024 | £223,325 | 4% |
20 Properties |
| 2023 | £214,014 | -13% |
34 Properties |
| 2022 | £241,994 | 27% |
28 Properties |
| 2021 | £177,071 | -12% |
28 Properties |
| 2020 | £197,688 | -11% |
21 Properties |
| 2019 | £219,766 | 34% |
25 Properties |
| 2018 | £145,107 | -40% |
14 Properties |
| 2017 | £202,640 | 12% |
30 Properties |
Property Price per Property Type in Stainburn
Here you can find historic sold price data in order to help with your property search.
The average Property Paid Price for specific property types in the last three years are:
| Property Type | Average Sold Price | Sold Properties |
|---|---|---|
| Semi Detached House | £201,027.00 | 18 Semi Detached Houses |
| Terraced House | £121,821.00 | 14 Terraced Houses |
| Flat | £83,750.00 | 8 Flats |
| Detached House | £286,460.00 | 40 Detached Houses |
