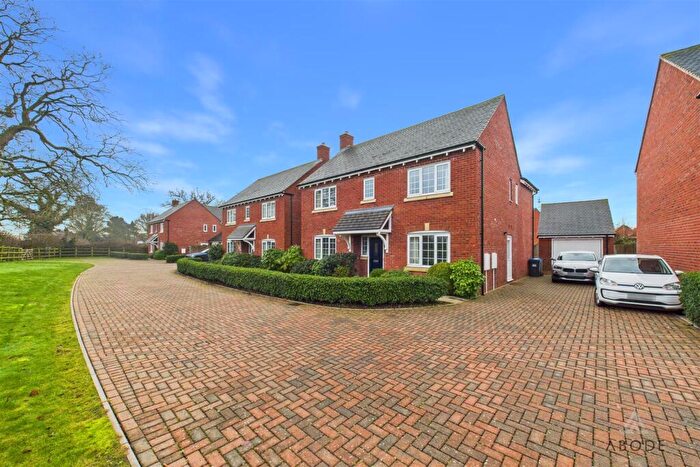
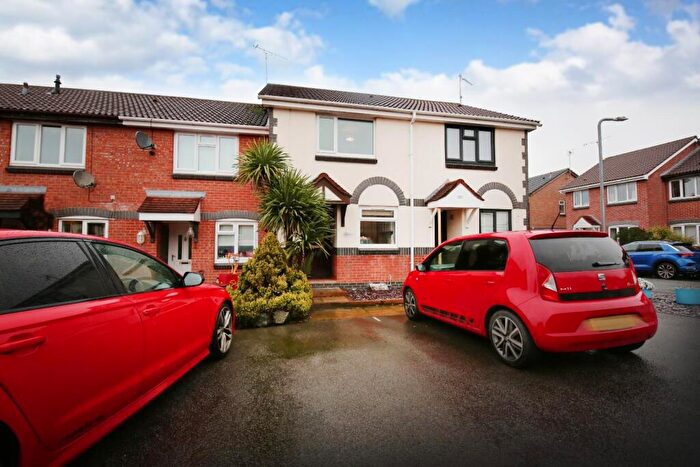
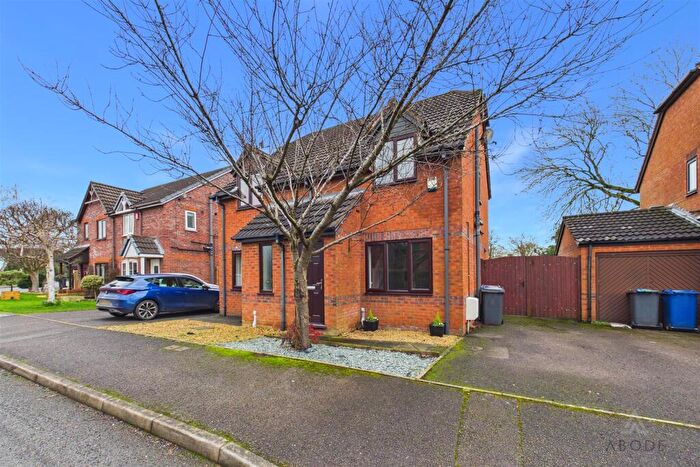
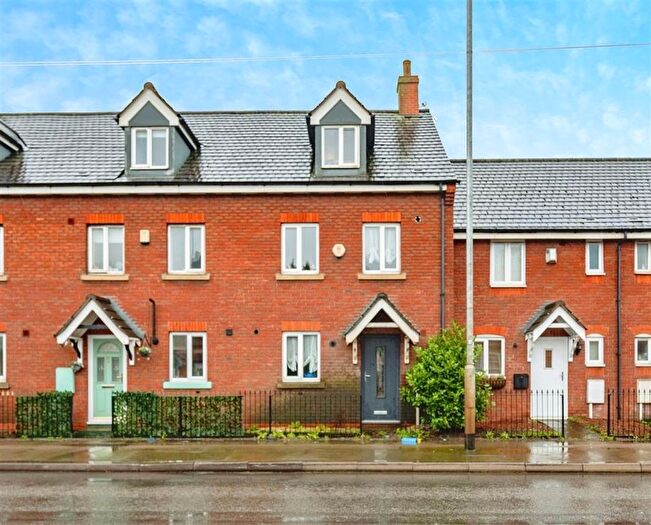
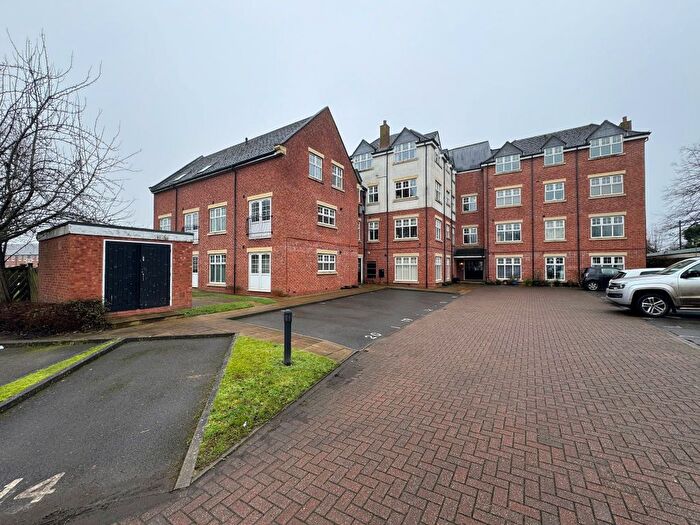
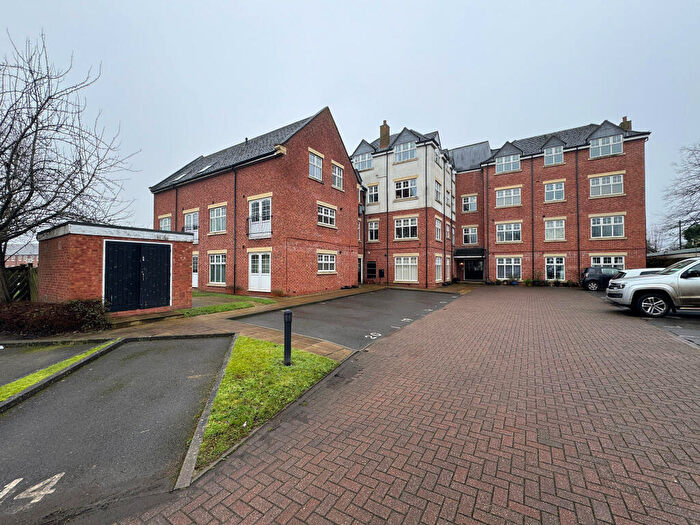
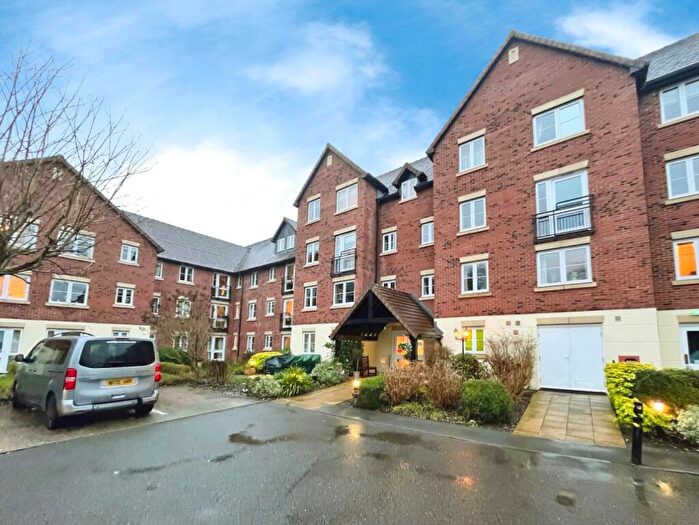
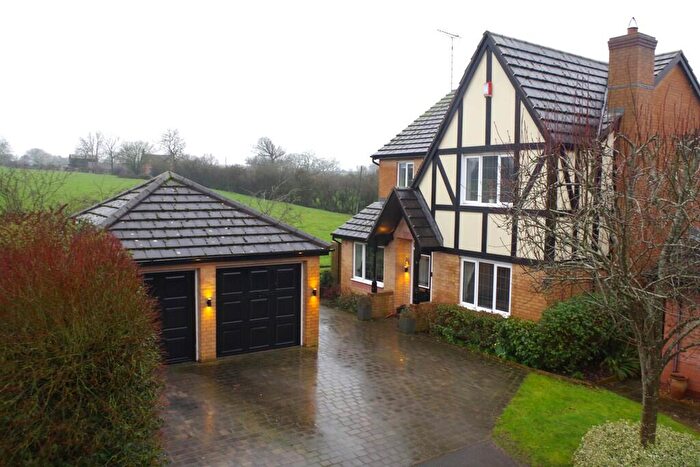
Houses for sale & to rent in Doveridge And Sudbury, Ashbourne
House Prices in Doveridge And Sudbury
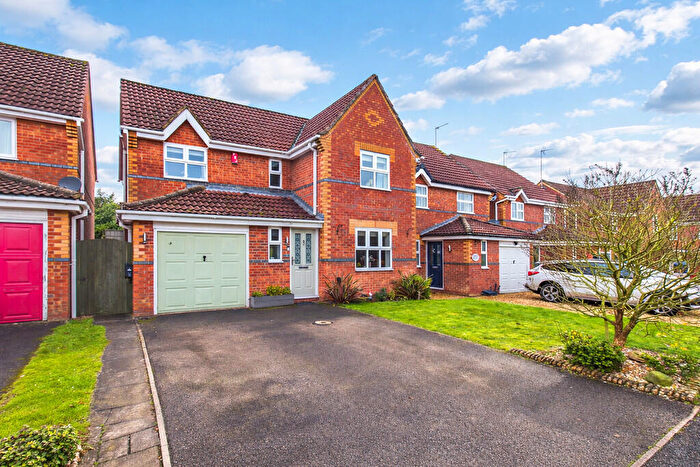
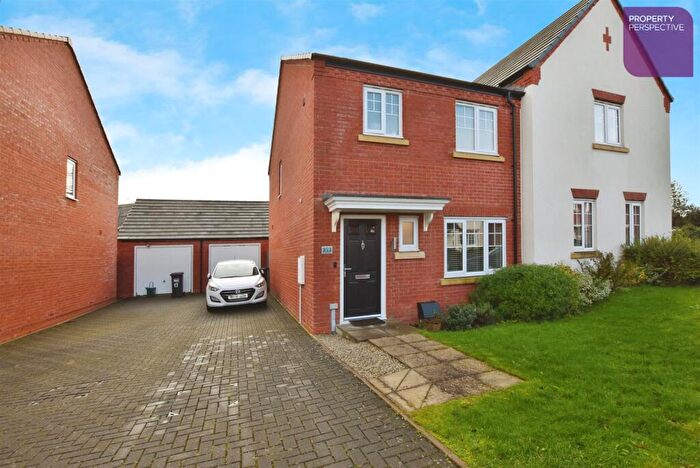
Properties in Doveridge And Sudbury have an average house price of £352,331.00 and had 63 Property Transactions within the last 3 years¹.
Doveridge And Sudbury is an area in Ashbourne, Derbyshire with 814 households², where the most expensive property was sold for £700,000.00.
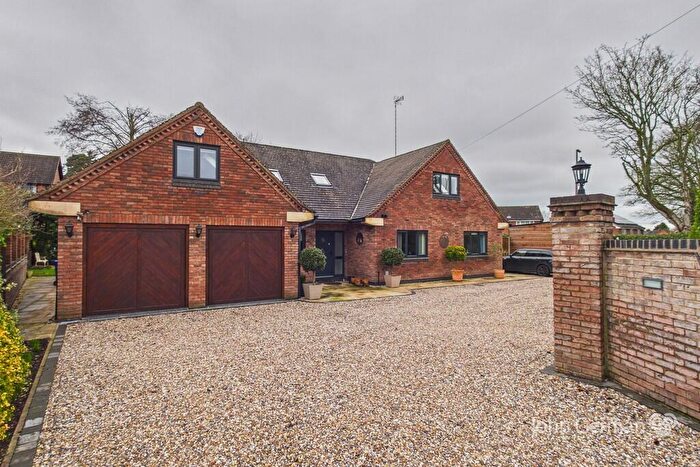
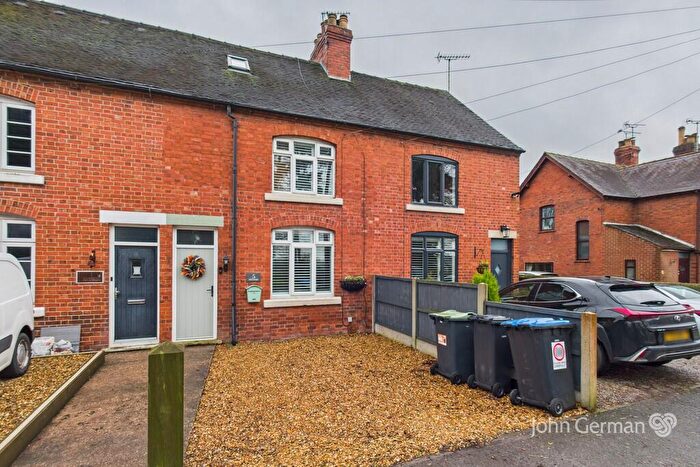
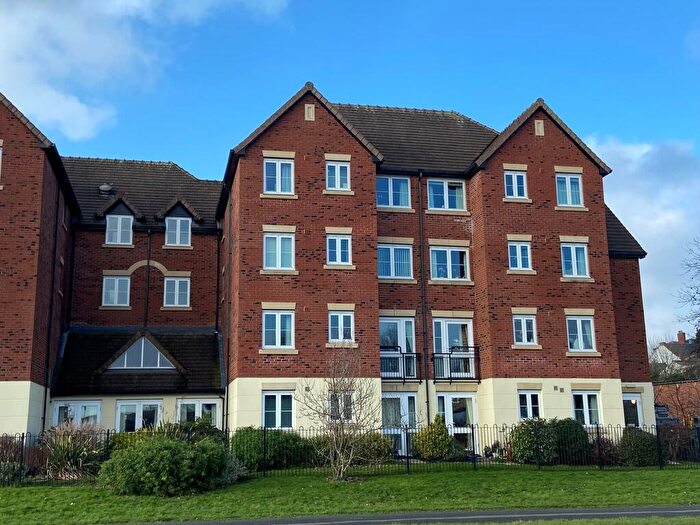
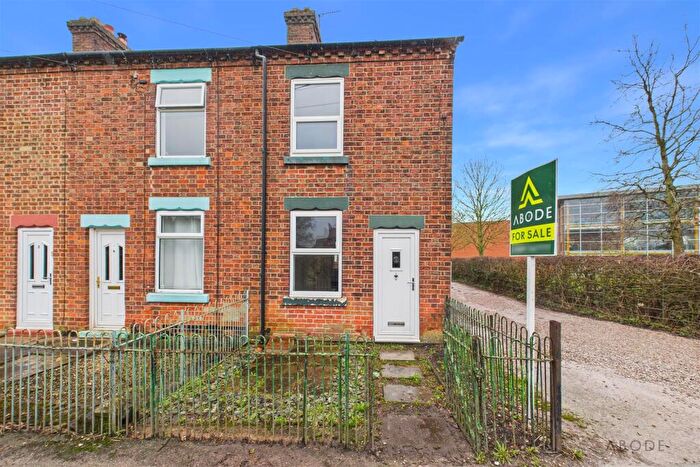
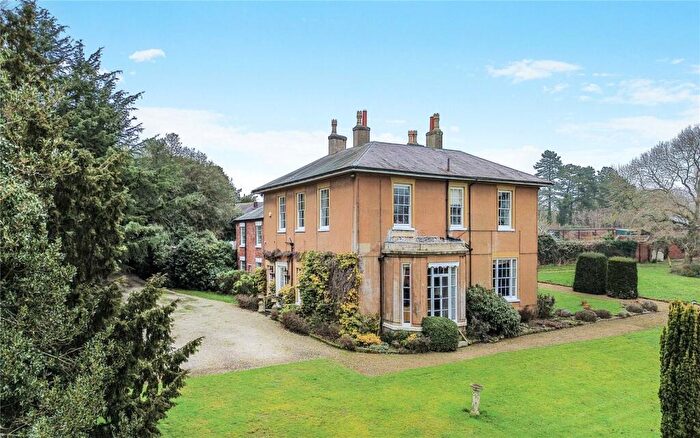
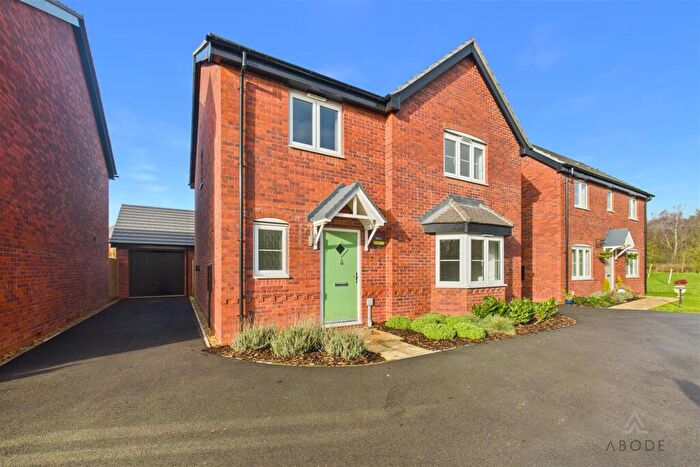
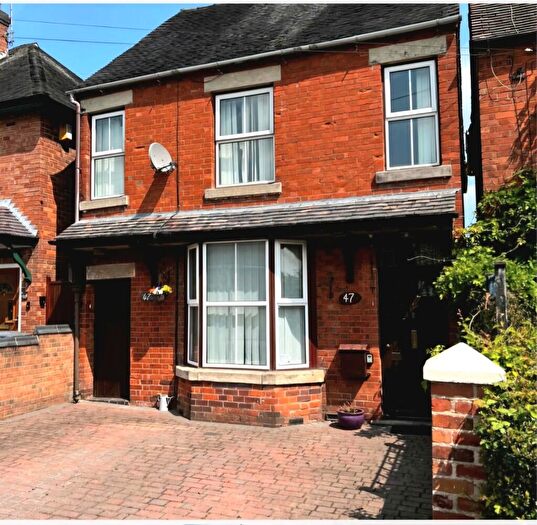
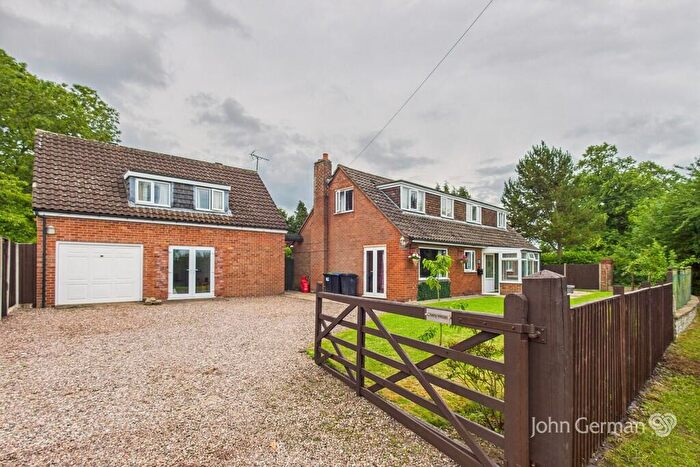
Properties for sale in Doveridge And Sudbury
Roads and Postcodes in Doveridge And Sudbury
Navigate through our locations to find the location of your next house in Doveridge And Sudbury, Ashbourne for sale or to rent.
| Streets | Postcodes |
|---|---|
| Alms Road | DE6 5JZ |
| Ashbourne Road | DE6 5HL DE6 5HN |
| Aston Lane | DE6 5HG |
| Babbs Lane | DE6 5JT |
| Bakers Lane | DE6 5LA |
| Bell Lane | DE6 5JX |
| Brace Gardens | DE6 5PF |
| Breach Lane | DE6 5HH |
| Brocksford Cottages | DE6 5HX |
| Brocksford Court | DE6 5PA |
| Brook Close | DE6 5LY |
| Cavendish Close | DE6 5LB |
| Chapel Green | DE6 5JY |
| Church Lane | DE6 5NN |
| Cook Lane | DE6 5NB |
| Derby Road | DE6 5JR DE6 5JU DE6 5LJ |
| Doveridge | DE6 5LH DE6 5LN DE6 5LP DE6 5LQ DE6 5NP |
| East Drive | DE6 5NJ |
| East Lawn Drive | DE6 5JN |
| Elm Close | DE6 5LD |
| Florence Drive | DE6 5LZ |
| Gibb Lane | DE6 5HY |
| Glebe Close | DE6 5NY |
| Hall Drive | DE6 5LG DE6 5NL |
| Hall Lane | DE6 5NQ |
| Hawthorn Close | DE6 5ND |
| High Street | DE6 5NA |
| Hindlip Close | DE6 5LF |
| Lake Drive | DE6 5NW |
| Lake Side | DE6 5NH |
| Lichfield Road | DE6 5AG |
| Lime Close | DE6 5NR |
| Lower Street | DE6 5NS |
| Main Road | DE6 5HS DE6 5EB |
| Maple Close | DE6 5LU |
| Marston Lane | DE6 5JS |
| Meadow View | DE6 5LT |
| Mill Lane | DE6 5QU |
| Oak Drive | DE6 5NF |
| Orchard Close | DE6 5EZ |
| Park Crescent | DE6 5NE |
| Pickford Grove | DE6 5PG |
| Pickley Lane | DE6 5NT |
| Pump Lane | DE6 5LX |
| Sand Lane | DE6 5JQ |
| School Lane | DE6 5HZ |
| Shrewsbury Court | DE6 5LW |
| St Cuthberts Road | DE6 5PJ |
| Stevenson Road | DE6 5NX |
| Sudbury Park | DE6 5HU |
| Upwoods Road | DE6 5LL |
| Waterpark Road | DE6 5NU |
| Wesley Close | DE6 5PL |
| West Drive | DE6 5NG |
| Yelt Lane | DE6 5JW |
| DE6 5HR DE6 5PE DE6 5AF DE6 5HT DE6 5HW ST14 5BS |
Transport near Doveridge And Sudbury
- FAQ
- Price Paid By Year
- Property Type Price
Frequently asked questions about Doveridge And Sudbury
What is the average price for a property for sale in Doveridge And Sudbury?
The average price for a property for sale in Doveridge And Sudbury is £352,331. This amount is 10% lower than the average price in Ashbourne. There are 741 property listings for sale in Doveridge And Sudbury.
What streets have the most expensive properties for sale in Doveridge And Sudbury?
The streets with the most expensive properties for sale in Doveridge And Sudbury are Pickford Grove at an average of £565,000, Ashbourne Road at an average of £550,000 and Hall Drive at an average of £475,000.
What streets have the most affordable properties for sale in Doveridge And Sudbury?
The streets with the most affordable properties for sale in Doveridge And Sudbury are Shrewsbury Court at an average of £235,000, Waterpark Road at an average of £236,225 and Sudbury Park at an average of £237,166.
Which train stations are available in or near Doveridge And Sudbury?
Some of the train stations available in or near Doveridge And Sudbury are Uttoxeter, Tutbury and Hatton and Burton-On-Trent.
Property Price Paid in Doveridge And Sudbury by Year
The average sold property price by year was:
| Year | Average Sold Price | Price Change |
Sold Properties
|
|---|---|---|---|
| 2025 | £435,171 | 25% |
14 Properties |
| 2024 | £327,340 | -1% |
25 Properties |
| 2023 | £330,041 | 2% |
24 Properties |
| 2022 | £323,812 | 0,4% |
27 Properties |
| 2021 | £322,378 | 5% |
73 Properties |
| 2020 | £307,762 | 2% |
46 Properties |
| 2019 | £302,555 | -2% |
67 Properties |
| 2018 | £308,705 | 17% |
44 Properties |
| 2017 | £257,185 | 12% |
27 Properties |
| 2016 | £227,233 | -13% |
34 Properties |
| 2015 | £257,122 | 14% |
24 Properties |
| 2014 | £222,190 | -10% |
26 Properties |
| 2013 | £244,125 | 25% |
24 Properties |
| 2012 | £184,235 | -8% |
17 Properties |
| 2011 | £198,323 | -8% |
17 Properties |
| 2010 | £214,041 | -26% |
13 Properties |
| 2009 | £270,099 | 9% |
27 Properties |
| 2008 | £246,346 | 9% |
13 Properties |
| 2007 | £224,025 | 14% |
19 Properties |
| 2006 | £192,342 | -14% |
33 Properties |
| 2005 | £218,414 | 1% |
21 Properties |
| 2004 | £216,300 | 33% |
28 Properties |
| 2003 | £144,640 | 9% |
26 Properties |
| 2002 | £131,337 | 24% |
48 Properties |
| 2001 | £99,829 | -25% |
37 Properties |
| 2000 | £125,284 | 36% |
22 Properties |
| 1999 | £80,716 | -18% |
42 Properties |
| 1998 | £95,125 | 23% |
31 Properties |
| 1997 | £73,224 | -3% |
44 Properties |
| 1996 | £75,563 | -3% |
47 Properties |
| 1995 | £77,814 | - |
31 Properties |
Property Price per Property Type in Doveridge And Sudbury
Here you can find historic sold price data in order to help with your property search.
The average Property Paid Price for specific property types in the last three years are:
| Property Type | Average Sold Price | Sold Properties |
|---|---|---|
| Semi Detached House | £287,333.00 | 15 Semi Detached Houses |
| Detached House | £409,471.00 | 39 Detached Houses |
| Terraced House | £213,055.00 | 9 Terraced Houses |

