
Houses for sale in Derbyshire, England
House Prices in Derbyshire
Properties in Derbyshire have
an average house price of
£252k
and had 36,607 Property Transactions
within the last 3 years.¹
Derbyshire is a location in
England with
359,691 households², where the most expensive property was sold for £18M.
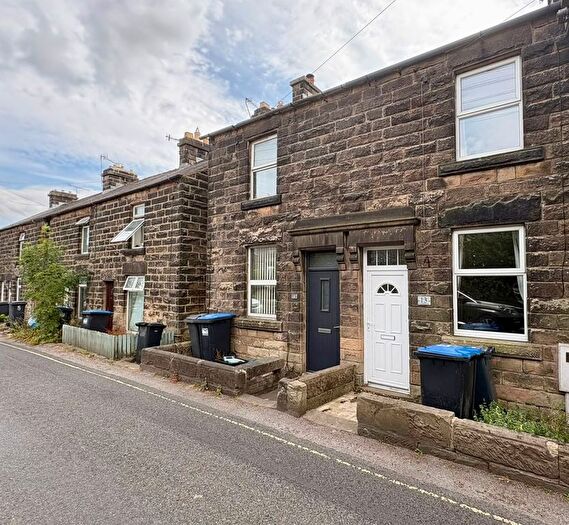
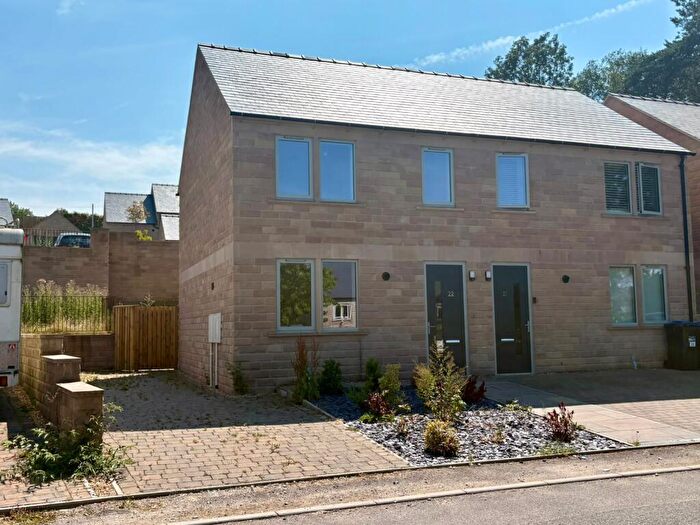
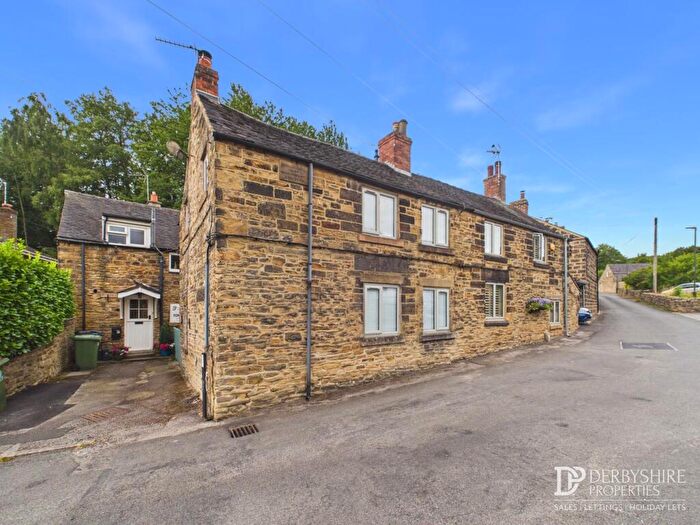
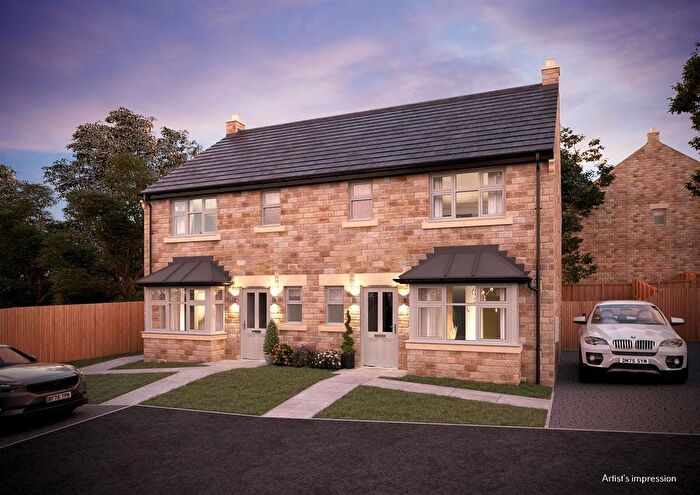
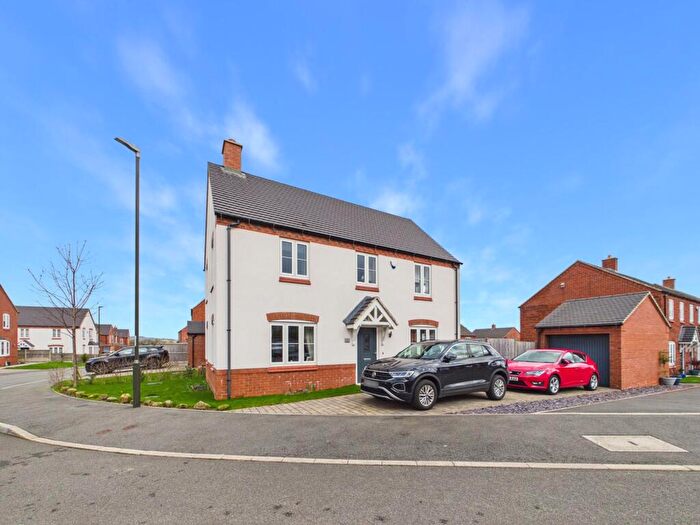
Properties for sale in Derbyshire
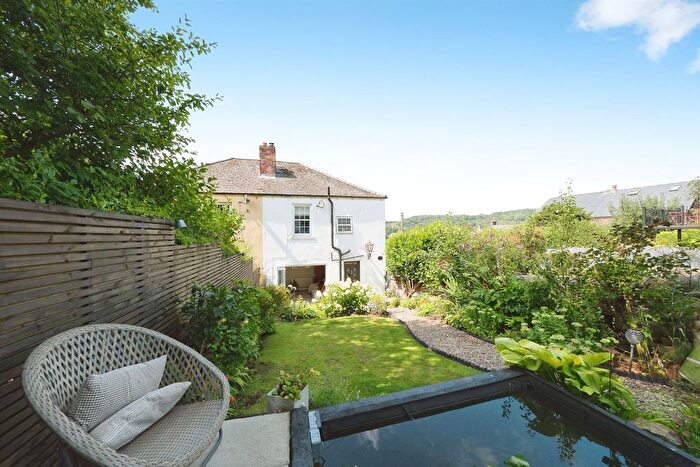

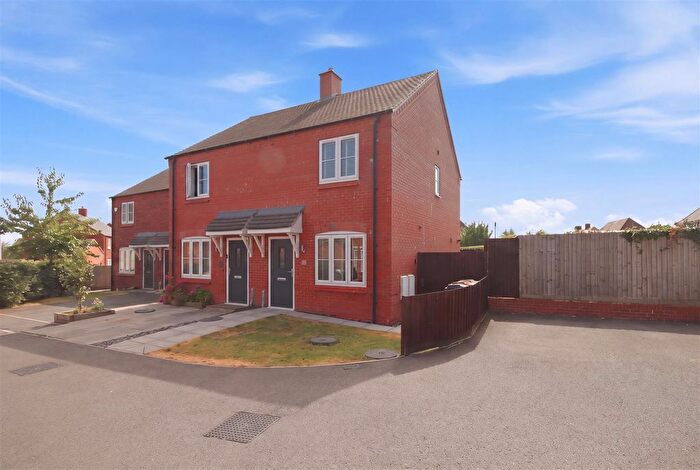
![]()
If you are looking to sell your house, let it out, or receive a property valuation, an expert can help you.
Click the button below to get started.


Towns in Derbyshire
Navigate through our locations to find the location of your next house in Derbyshire, England for sale or to rent.
Property price trends in Derbyshire
According to the latest Land Registry data, the average home in Derbyshire sold for £250,706 in 2026. That figure comes from a substantial record of 421,991 sales logged over the past 31 years.
Prices have held fairly steady over the last three years. Compared with 2023, when the typical sale came in around £248,194, values are broadly unchanged.
Looking back five years, average prices are up about 5.7% since 2021, a gain of around £13,619 in cash terms.
Zoom out to the past decade for the fuller picture. Back in 2016, homes here averaged £184,819, so the typical sold price has climbed about 35.6% since then, roughly 3.1% a year. Stretch the view to fifteen years and that annual pace holds at about 3.2%.
Frequently asked questions about Derbyshire
What is the average price for a property for sale in Derbyshire?
The average price for a property for sale in Derbyshire is £251,901. This amount is 30% lower than the average price in England. There are more than 10,000 property listings for sale in Derbyshire.
What locations have the most expensive properties for sale in Derbyshire?
The locations with the most expensive properties for sale in Derbyshire are Uttoxeter at an average of £925,000, Hope Valley at an average of £463,375 and Bakewell at an average of £457,806.
What locations have the most affordable properties for sale in Derbyshire?
The locations with the most affordable properties for sale in Derbyshire are Mansfield at an average of £153,803, Worksop at an average of £164,174 and Heanor at an average of £199,252.
Which train stations are available in or near Derbyshire?
Some of the train stations available in or near Derbyshire are Cromford, Matlock Bath and Whatstandwell.
Property Price Paid in Derbyshire by Year
The average sold property price by year was:
| Year | Average Sold Price | Price Change |
Sold Properties
|
|---|---|---|---|
| 2026 | £250,706 | -2% |
2,229 Properties |
| 2025 | £256,274 | 2% |
12,080 Properties |
| 2024 | £250,967 | 1% |
11,716 Properties |
| 2023 | £248,194 | -0,4% |
10,582 Properties |
| 2022 | £249,134 | 5% |
13,728 Properties |
| 2021 | £237,087 | 7% |
17,002 Properties |
| 2020 | £220,500 | 6% |
13,272 Properties |
| 2019 | £208,204 | 2% |
15,324 Properties |
| 2018 | £203,557 | 5% |
15,088 Properties |
| 2017 | £193,536 | 5% |
14,940 Properties |
Property Price per Property Type in Derbyshire
Here you can find historic sold price data in order to help with your property search.
The average Property Paid Price for specific property types in the last three years are:
| Property Type | Average Sold Price | Sold Properties |
|---|---|---|
| Semi Detached House | £216,473.00 | 13,632 Semi Detached Houses |
| Terraced House | £174,697.00 | 9,938 Terraced Houses |
| Detached House | £381,372.00 | 11,144 Detached Houses |
| Flat | £150,151.00 | 1,893 Flats |
Transport in Derbyshire
Please see below transportation links in this area:
