
Houses for sale in Derwent, Derby
House Prices in Derwent
Properties in Derwent have an average house price of £295k and had 35 Property Transactions within the last 3 years¹.
Derwent is an area in Derby, Derbyshire with 585 households², where the most expensive property was sold for £625k.
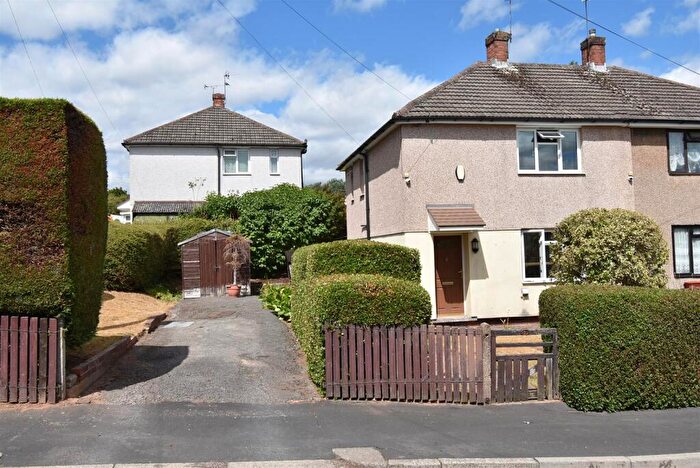
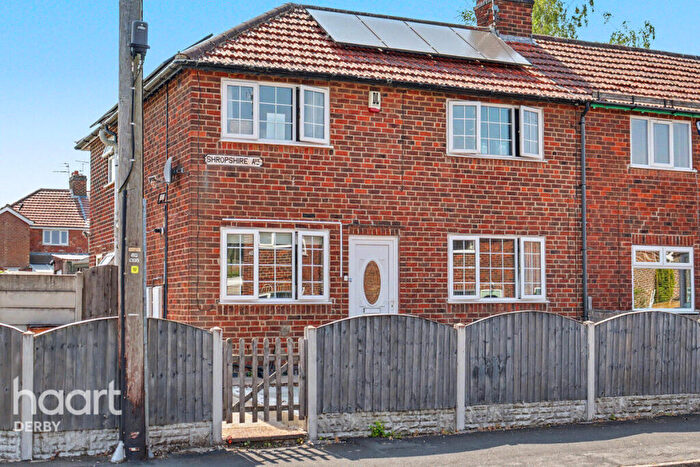
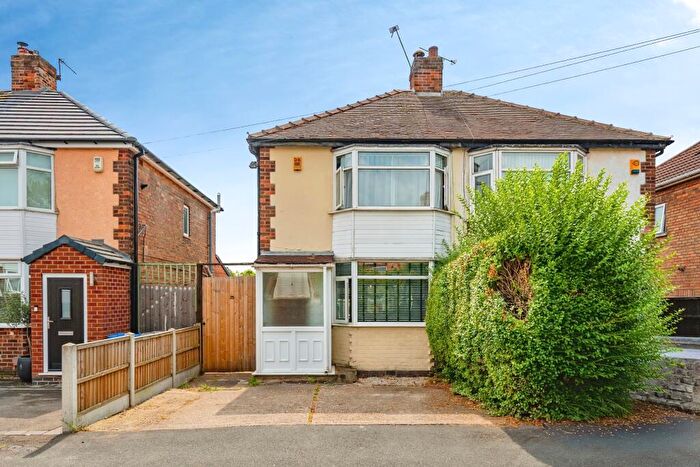
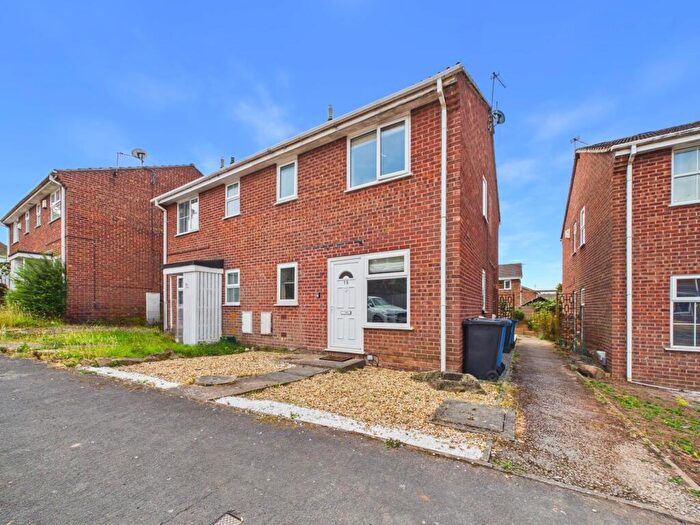
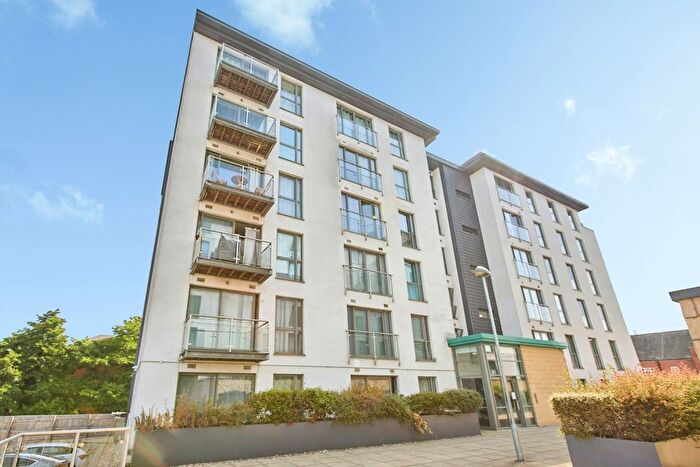
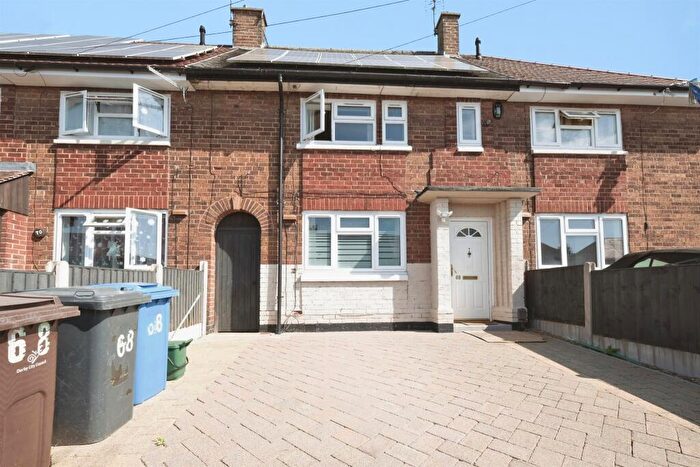
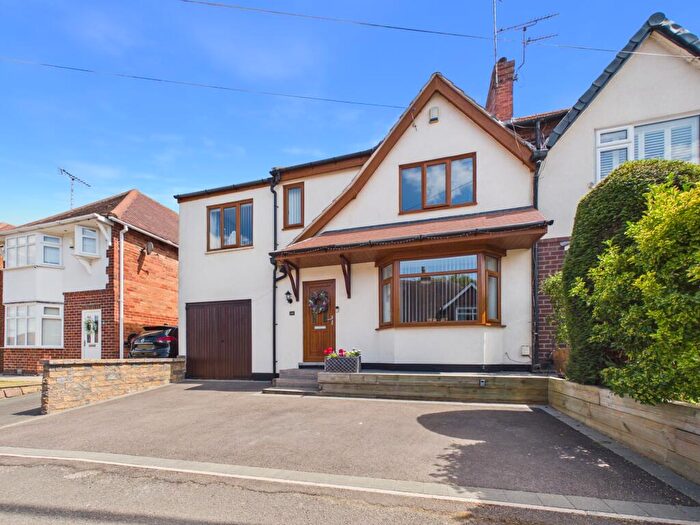
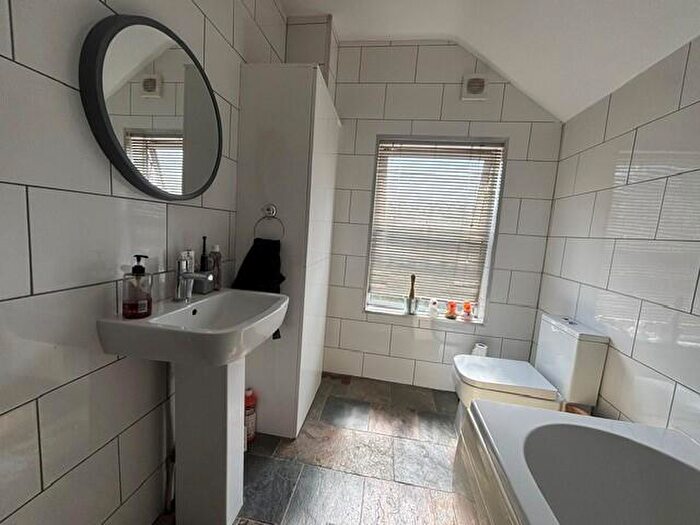
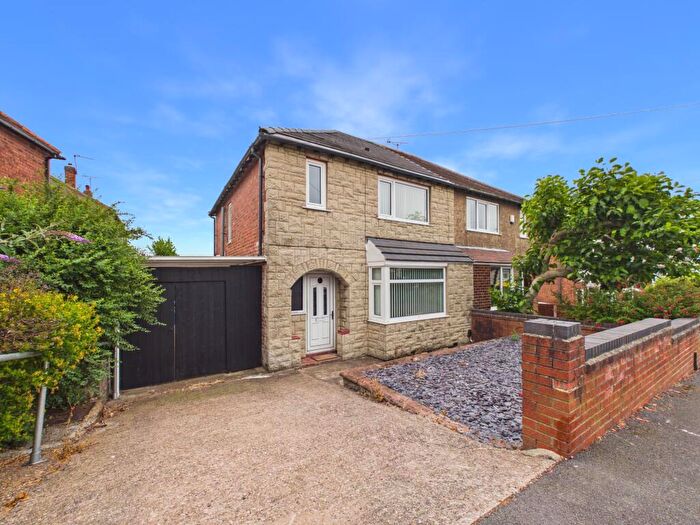
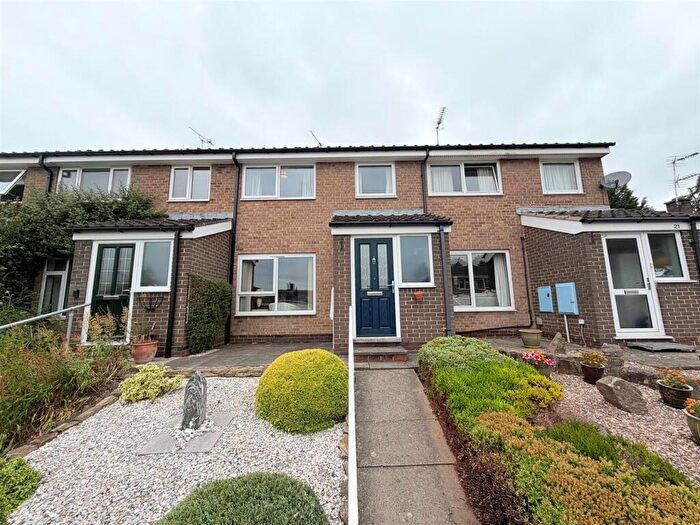
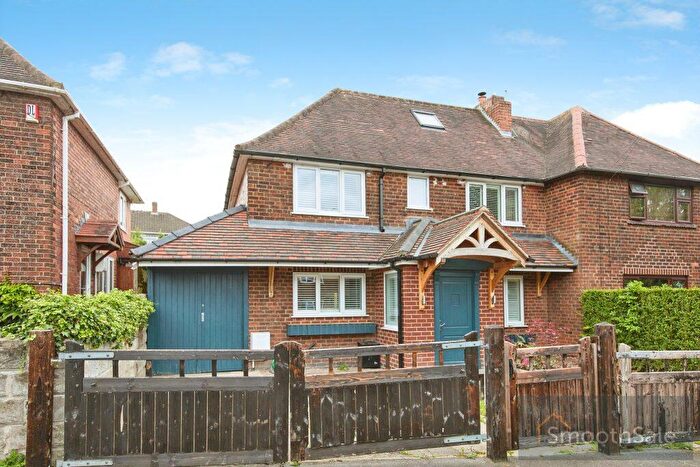
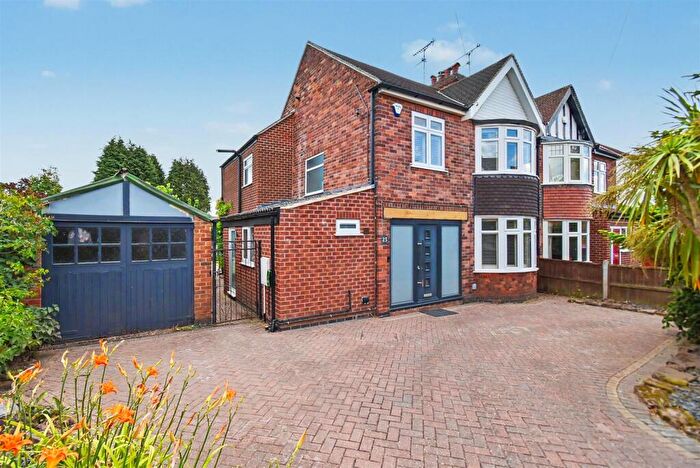
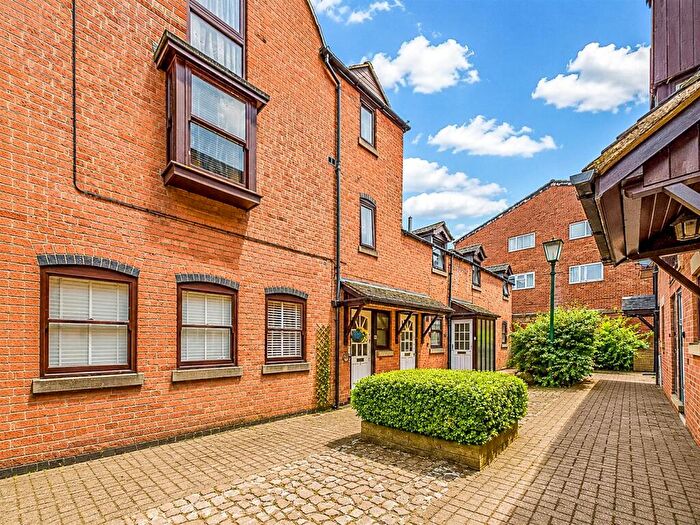
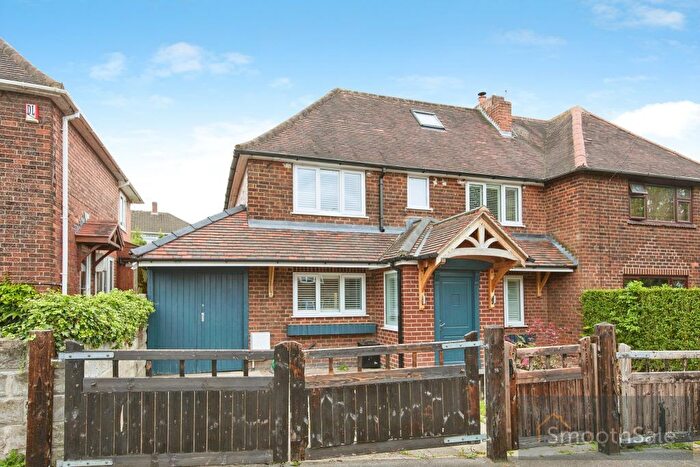
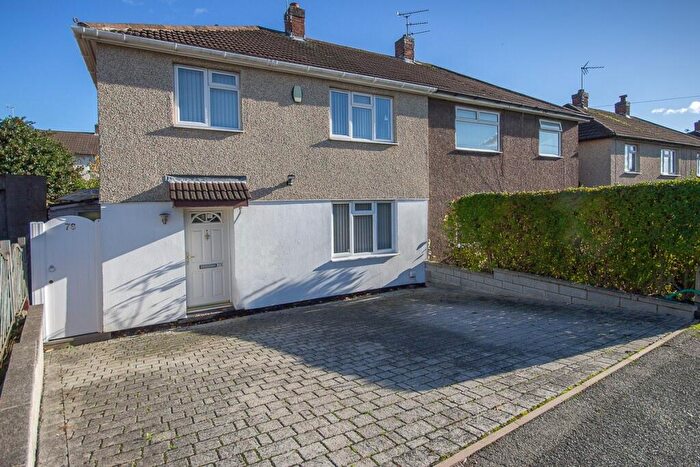
Properties for sale in Derwent
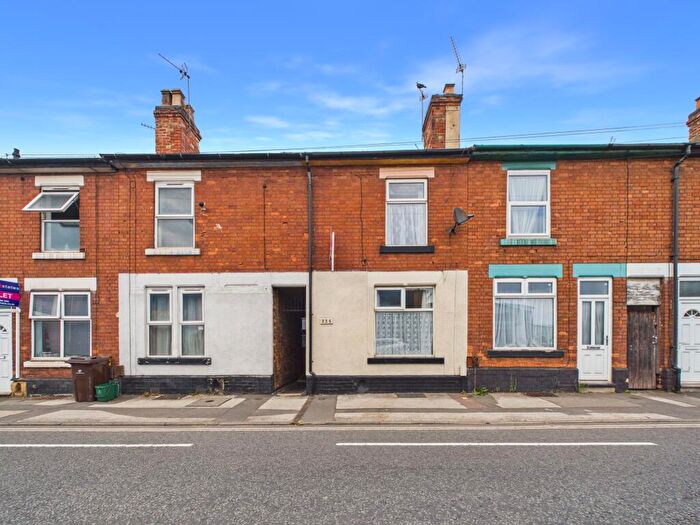
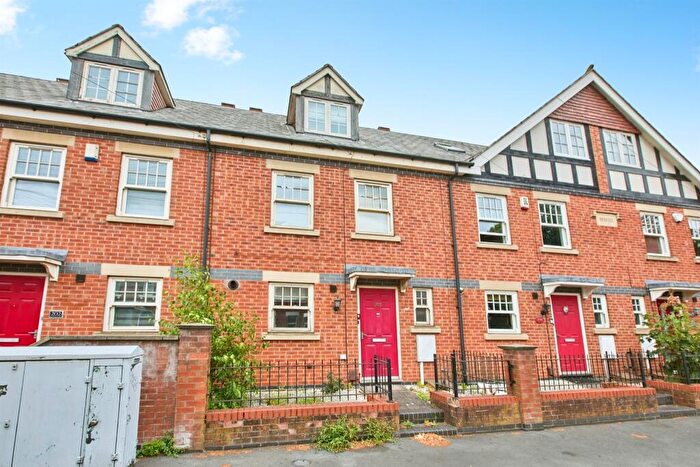
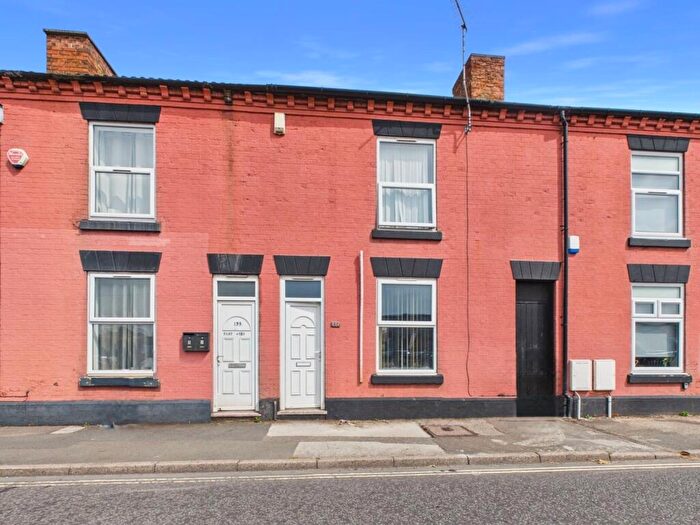
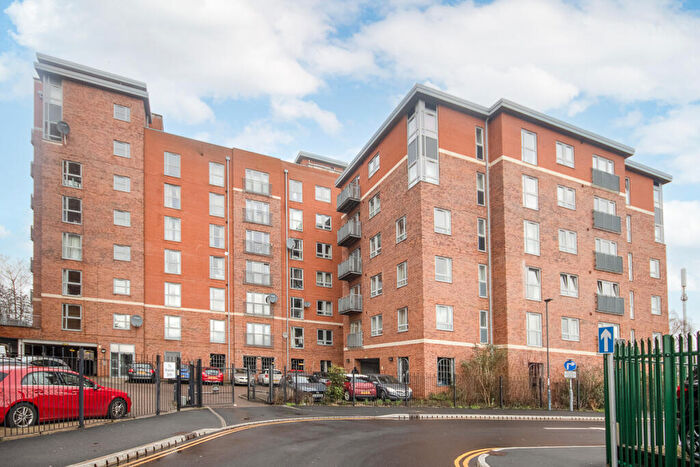
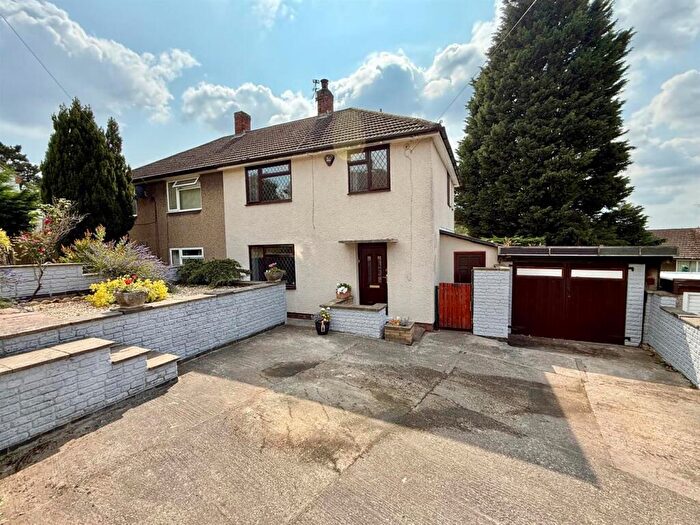
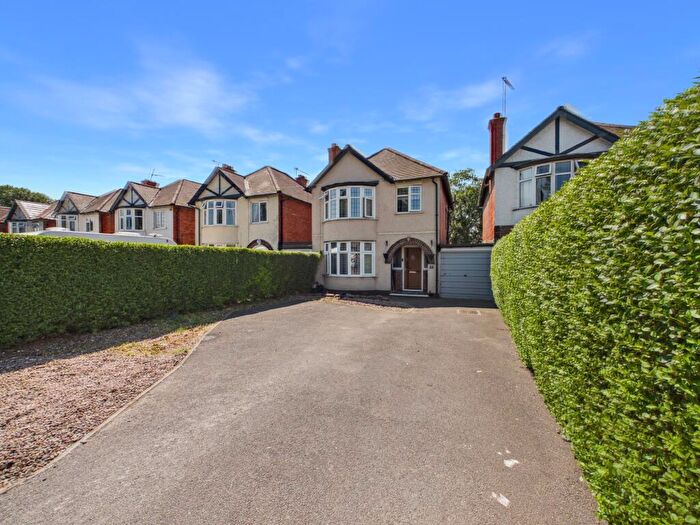
![]()
If you are looking to sell your house, let it out, or receive a property valuation, an expert can help you.
Click the button below to get started.

Roads and Postcodes in Derwent
Navigate through our locations to find the location of your next house in Derwent, Derby for sale or to rent.
| Streets | Postcodes |
|---|---|
| Alfreton Road | DE21 4AP |
| Alison Close | DE21 6HY |
| Ashlyn Road | DE21 6XE |
| Ashover Close | DE21 4JF |
| Bandy Lane | DE21 4TZ |
| Beaufort Court | DE21 4FA |
| Bemrose Park | DE21 6XQ |
| Bishopgate Square | DE21 4JG |
| Buckingham Avenue | DE21 6GP |
| Cardigan Street | DE21 6GF DE21 6GG DE21 6GH |
| Cattle Market | DE21 6EP |
| Chartwell Drive | DE21 6BZ |
| Chequers Lane | DE21 6AT |
| Chequers Road | DE21 6EL DE21 6EN DE21 6WT |
| Coneygrey Close | DE21 4UA |
| Cowsley Road | DE21 6EJ |
| Cranmer Road | DE21 6JL DE21 6WU DE21 6XT |
| Dale Acre Way | DE21 4UB |
| Derby Trading Estate | DE21 4BE |
| Downing Road | DE21 6HA |
| Dunton Close | DE21 6XB |
| Enterprise Way | DE21 4BB |
| Filey Walk | DE21 4BS |
| Friday Lane | DE21 4UE |
| Grandstand Road | DE21 6AG |
| Hampshire Road | DE21 6BT |
| Hansard Gate | DE21 6AR DE21 6JN DE21 6RR |
| Hillcrest Road | DE21 6FF DE21 6FG |
| Holmegate Close | DE21 4LW |
| Hungerhill Close | DE21 4UD |
| Huntingdon Green | DE21 6AA DE21 6AD |
| Jubilee Parkway | DE21 4BJ |
| Knutsford Green | DE21 4DL |
| Liverpool Street | DE21 6GE |
| Mansfield Road | DE21 4FS DE21 4WA DE21 4AW |
| Masons Place Business Park | DE21 6YZ |
| Max Road | DE21 4HB |
| Meteor Business Park | DE21 4ST DE21 4SU |
| Meteor Centre | DE21 4SY |
| Morpeth Gardens | DE21 4DN |
| Nottingham Road | DE21 6BW DE21 6FN DE21 6HB DE21 6DA |
| Parker Industrial Estate | DE21 4SZ |
| Perth Street | DE21 4EF |
| Racecourse Industrial Park | DE21 4SX |
| Radnor Street | DE21 6DZ DE21 6EA |
| Ringwood Close | DE21 4LR |
| Ross Walk | DE21 4FD |
| Roxburgh Avenue | DE21 6GY |
| Sawley Park | DE21 6AS |
| Sir Frank Whittle Road | DE21 4AZ DE21 4LT DE21 4RX DE21 4RZ DE21 4XA |
| St Andrews View | DE21 6YE DE21 6YF |
| Stores Road | DE21 4BA DE21 4BD DE21 4XF |
| Stuble Drive | DE21 4TX |
| Taddington Close | DE21 4JE |
| Ullswater Close | DE21 4DU |
| Wheatcroft Way | DE21 4RY |
| Wiltshire Road | DE21 6FE |
Property price trends in Derwent
According to the latest Land Registry data, the average home in Derwent sold for £280,000 in 2026. That figure comes from 259 sales logged over the past 31 years.
Prices have fallen back over the last three years. Compared with 2023, when the typical sale came in around £327,500, that's a fall of roughly 14.5%.
Looking back five years, average prices are up about 40.3% since 2021, a gain of around £80,436 in cash terms.
Zoom out to the past decade for the fuller picture. Back in 2018, homes here averaged £123,500, so the typical sold price has climbed about 126.7% since then, roughly 10.8% a year.
Frequently asked questions about Derwent
What is the average price for a property for sale in Derwent?
The average price for a property for sale in Derwent is £295,022. This amount is 4% lower than the average price in Derby. There are 2,821 property listings for sale in Derwent.
What streets have the most expensive properties for sale in Derwent?
The streets with the most expensive properties for sale in Derwent are Coneygrey Close at an average of £418,500, Bandy Lane at an average of £401,000 and Dale Acre Way at an average of £360,571.
What streets have the most affordable properties for sale in Derwent?
The streets with the most affordable properties for sale in Derwent are Stuble Drive at an average of £149,933, Radnor Street at an average of £162,000 and Ullswater Close at an average of £165,000.
Which train stations are available in or near Derwent?
Some of the train stations available in or near Derwent are Derby, Spondon and Peartree.
Property Price Paid in Derwent by Year
The average sold property price by year was:
| Year | Average Sold Price | Price Change |
Sold Properties
|
|---|---|---|---|
| 2026 | £280,000 | -7% |
1 Property |
| 2025 | £300,673 | 9% |
19 Properties |
| 2024 | £274,818 | -19% |
11 Properties |
| 2023 | £327,500 | 10% |
4 Properties |
| 2022 | £293,581 | 32% |
43 Properties |
| 2021 | £199,564 | -30% |
53 Properties |
| 2020 | £259,358 | 19% |
44 Properties |
| 2019 | £211,295 | 42% |
74 Properties |
| 2018 | £123,500 | -185% |
2 Properties |
| 2008 | £352,500 | 44% |
1 Property |
Property Price per Property Type in Derwent
Here you can find historic sold price data in order to help with your property search.
The average Property Paid Price for specific property types in the last three years are:
| Property Type | Average Sold Price | Sold Properties |
|---|---|---|
| Semi Detached House | £236,111.00 | 18 Semi Detached Houses |
| Detached House | £413,153.00 | 13 Detached Houses |
| Terraced House | £176,200.00 | 4 Terraced Houses |
