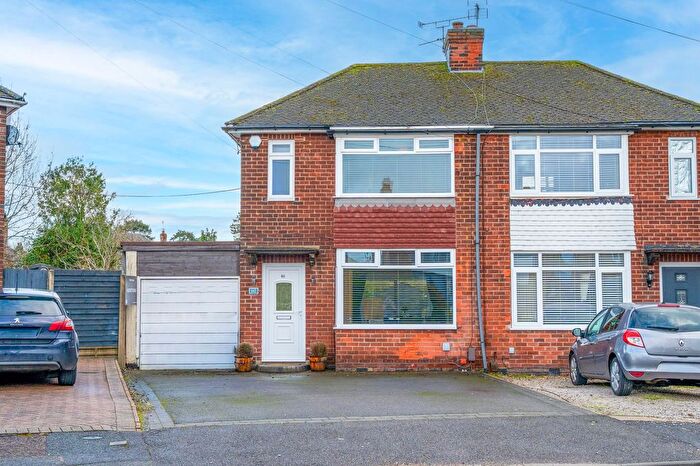
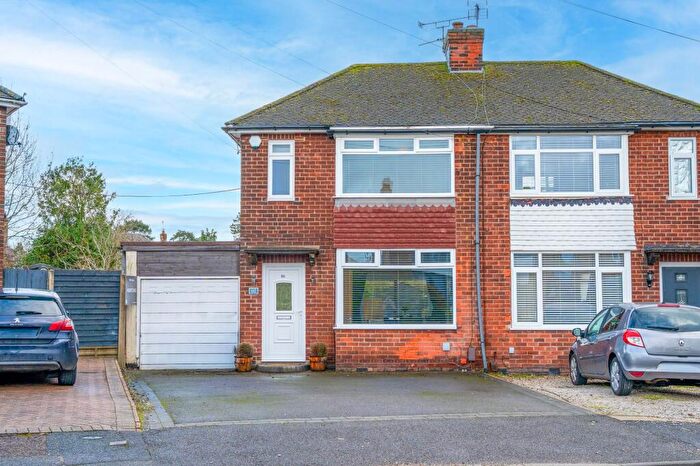
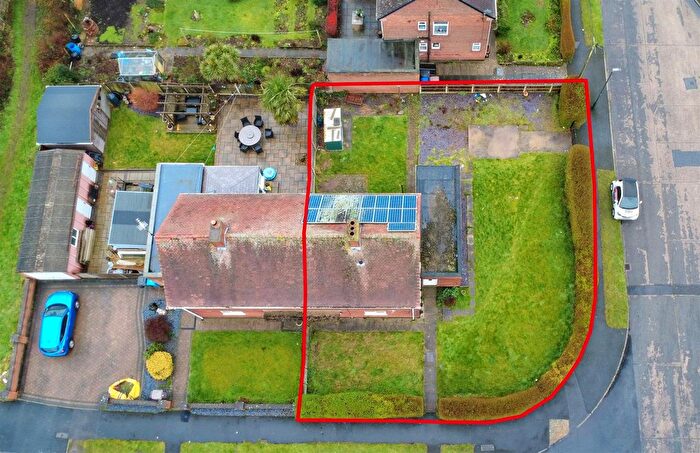
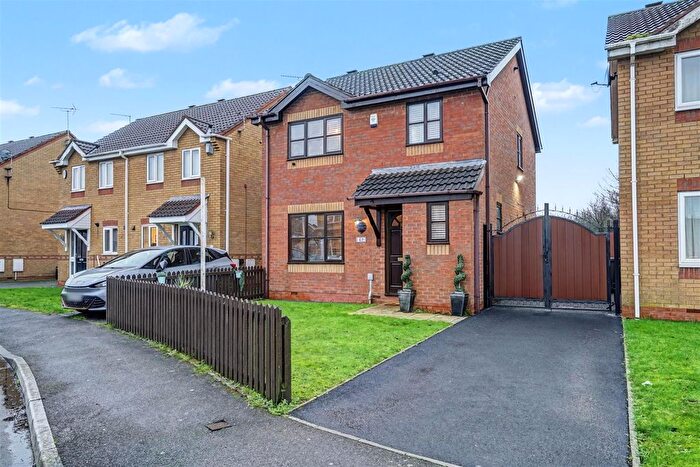
Houses for sale & to rent in Draycott, Derby
House Prices in Draycott
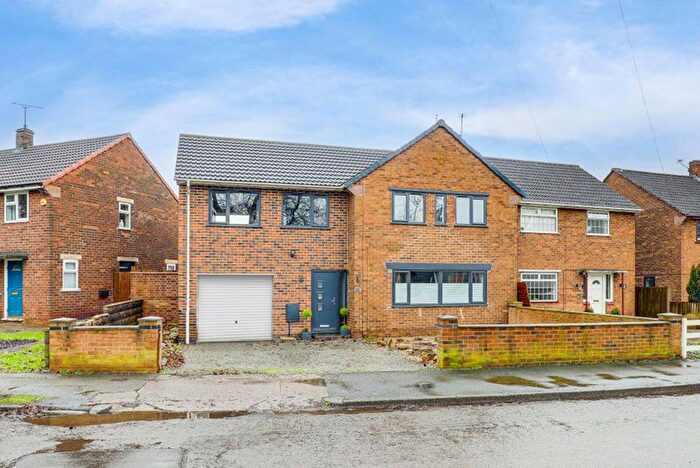
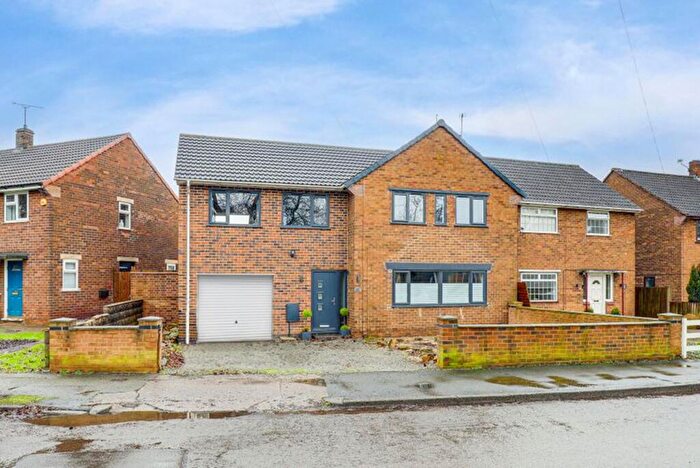
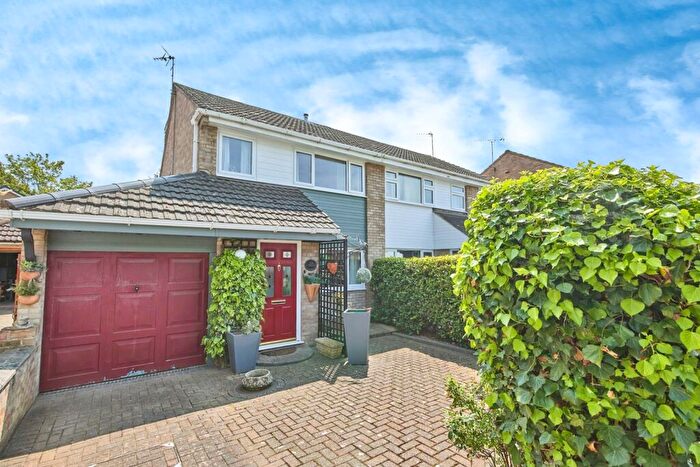
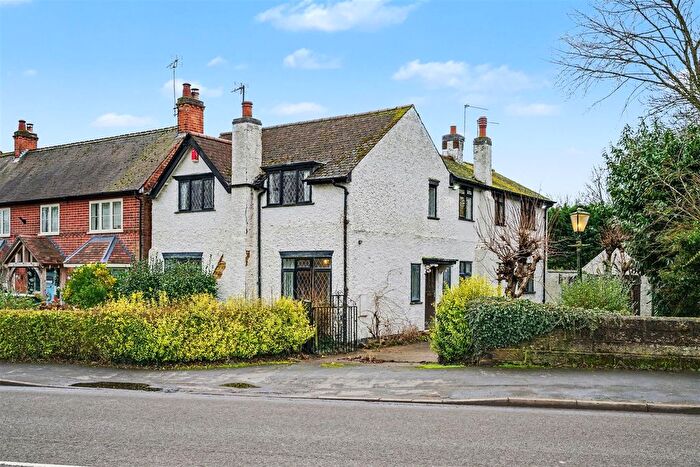
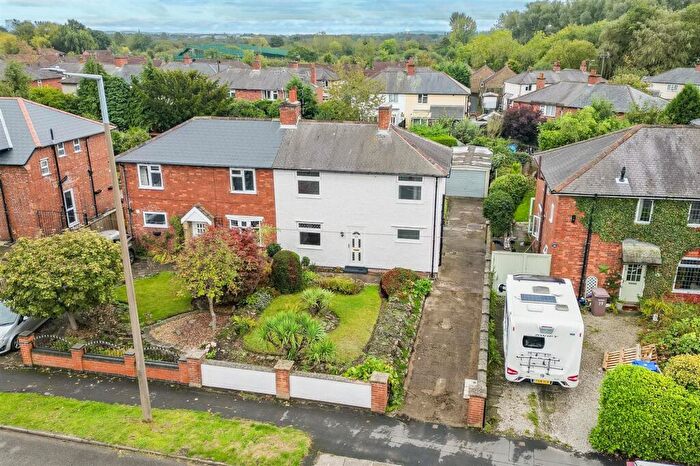
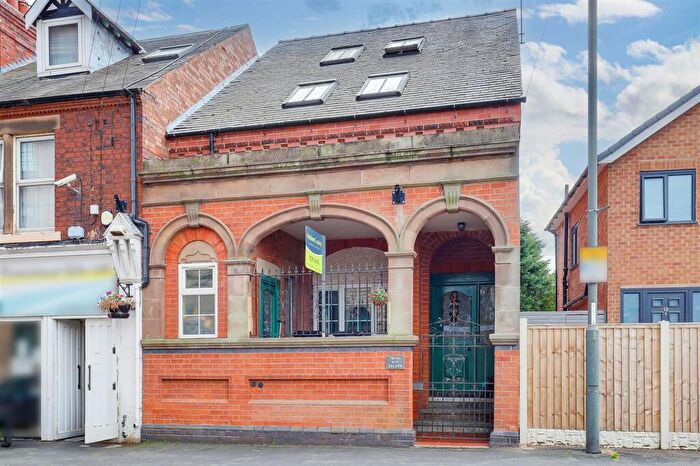
Properties in Draycott have an average house price of £256,395.00 and had 180 Property Transactions within the last 3 years¹.
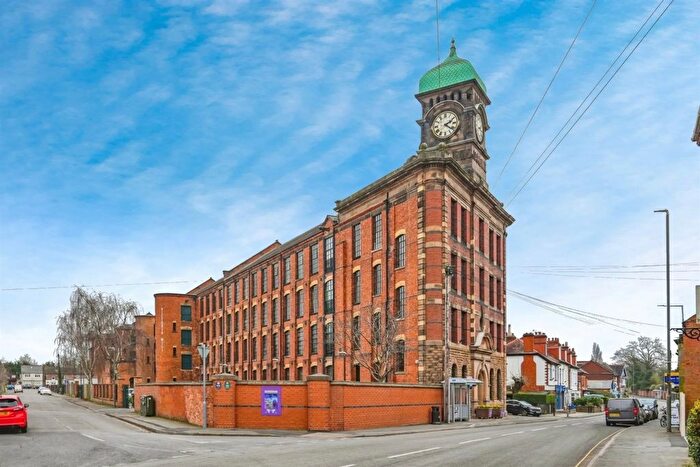
Draycott is an area in Derby, Derbyshire with 1,652 households², where the most expensive property was sold for £1,100,000.00.
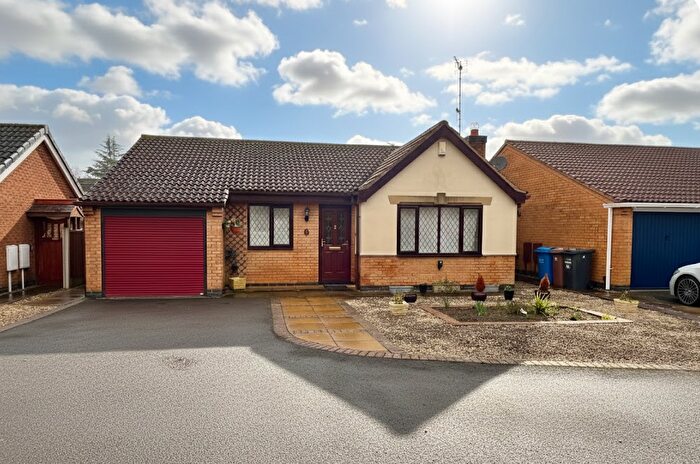
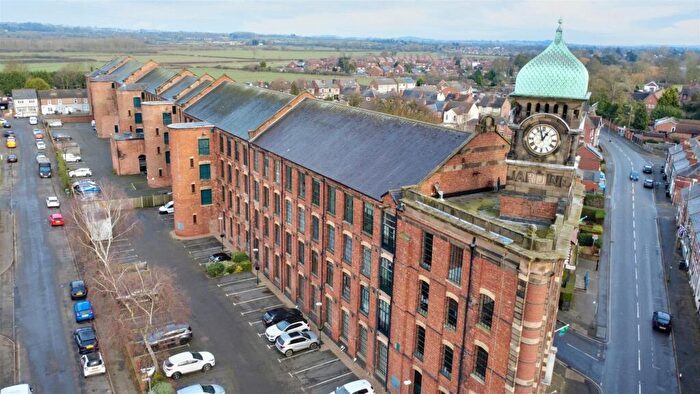
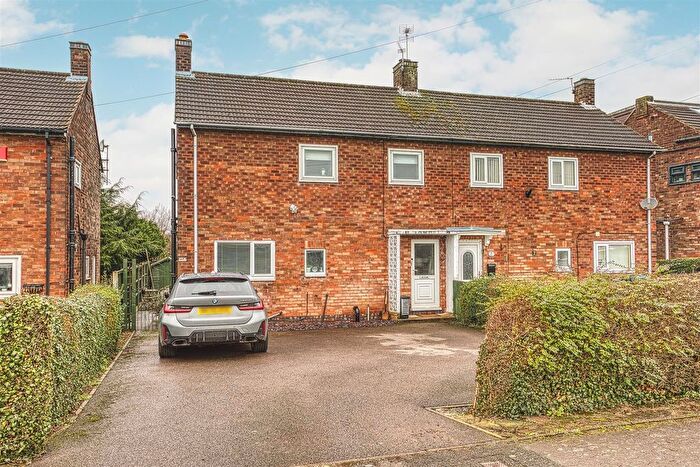
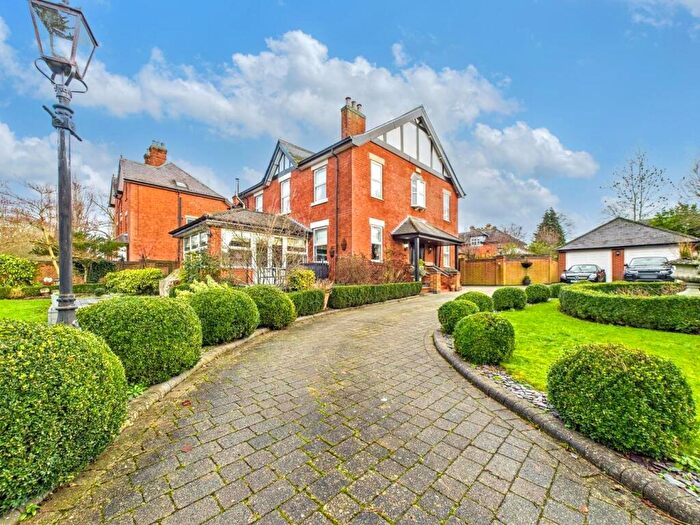
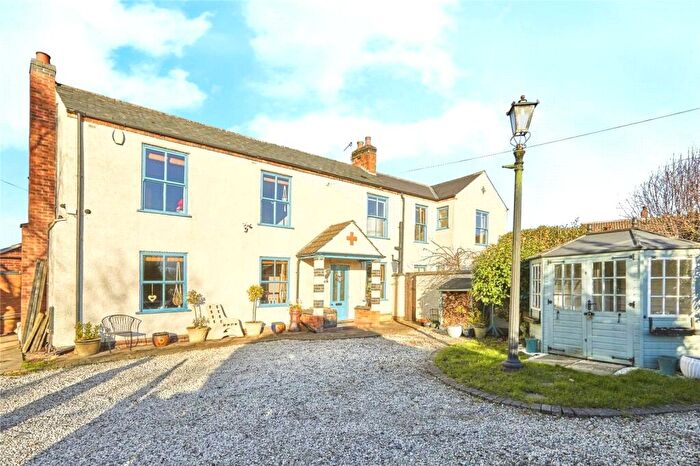
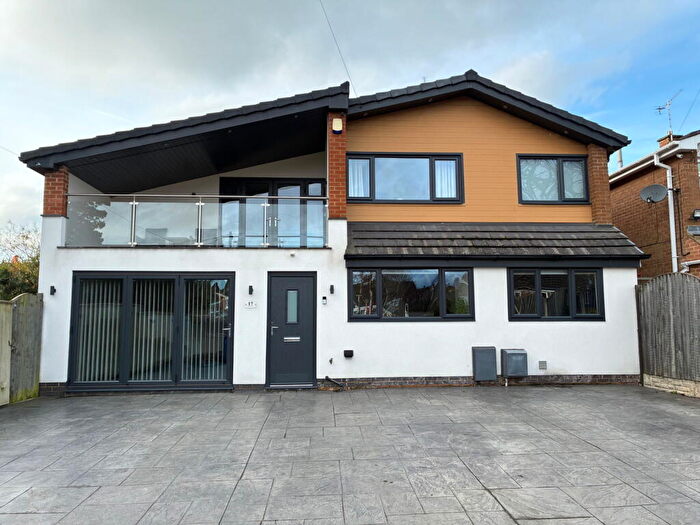
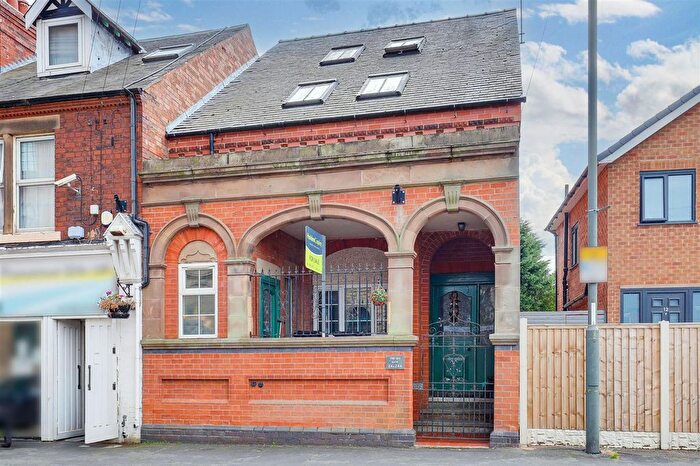
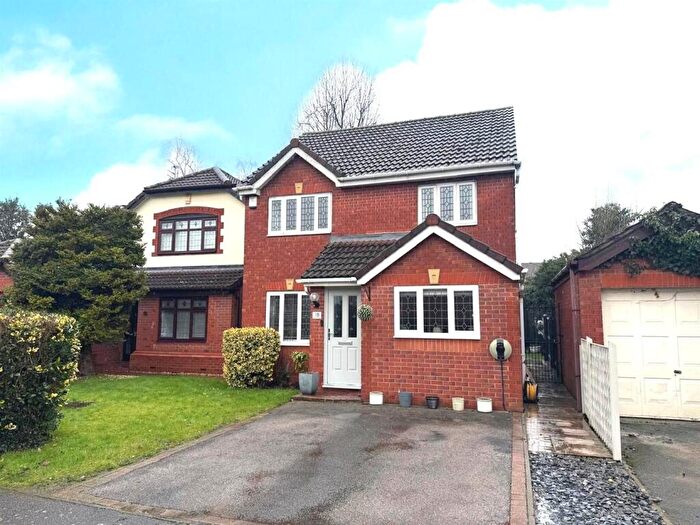
Properties for sale in Draycott
Roads and Postcodes in Draycott
Navigate through our locations to find the location of your next house in Draycott, Derby for sale or to rent.
| Streets | Postcodes |
|---|---|
| Arthur Street | DE72 3NT |
| Attewell Close | DE72 3QP |
| Bostocks Lane | DE72 3SX |
| Cherry Tree Close | DE72 3TX |
| Clay Street | DE72 3WE |
| Cleveland Avenue | DE72 3NR DE72 3QX |
| Cowslip Meadow | DE72 3XE DE72 3XG |
| Derby Road | DE72 3NJ DE72 3NX DE72 3SS DE72 3SU DE72 3SY |
| Derwent Street | DE72 3NF |
| Fairfield Terrace | DE72 3PA |
| First Avenue | DE72 3TA |
| Fowler Street | DE72 3QD |
| Garfield Avenue | DE72 3NP |
| Gertrude Road | DE72 3NW |
| Gilliver Gardens | DE72 3PQ |
| Gypsy Lane | DE72 3PB |
| Harrington Street | DE72 3QA |
| Holly Close | DE72 3PJ |
| Hopwell Nook | DE72 3RW |
| Hopwell Road | DE72 3NH DE72 3PE DE72 3SD |
| Jardine Court | DE72 3TY |
| Lime Grove | DE72 3NS |
| Lodge Mews | DE72 3RT |
| Lodge Street | DE72 3PR |
| Mapleton Road | DE72 3QQ |
| Market Street | DE72 3NB |
| Mcneil Grove | DE72 3NE |
| Meadow Close | DE72 3QR |
| Meadow View Court | DE72 3TW |
| Millhouse Court | DE72 3TZ |
| Mills Close | DE72 3QN |
| Milner Avenue | DE72 3ND |
| Nottingham Road | DE72 3PD |
| Queens Court | DE72 3QZ |
| Risley Hall | DE72 3WL DE72 3WN DE72 3WP |
| Rushy Lane | DE72 3SW |
| Sawley Road | DE72 3QE |
| Second Avenue | DE72 3SZ |
| South Street | DE72 3PP |
| St Chads Close | DE72 3PF |
| St Marys Avenue | DE72 3NQ |
| Station Road | DE72 3QB |
| Sydney Road | DE72 3PX |
| The Croft | DE72 3PG |
| The Green | DE72 3LZ |
| The Pines | DE72 3QY |
| Thoresby Crescent | DE72 3PH |
| Town End Road | DE72 3PT DE72 3PW |
| Tudor Court | DE72 3YQ |
| Victoria Avenue | DE72 3PL |
| Victoria Road | DE72 3NA DE72 3PS |
| Villa Street | DE72 3PZ |
| Walk Close | DE72 3PN |
| Wallis Close | DE72 3QS |
| Walter Street | DE72 3NU |
| West Avenue | DE72 3NY |
| Wilne Road | DE72 3NG DE72 3QG DE72 3QH |
| DE72 3WJ |
Transport near Draycott
- FAQ
- Price Paid By Year
- Property Type Price
Frequently asked questions about Draycott
What is the average price for a property for sale in Draycott?
The average price for a property for sale in Draycott is £256,395. This amount is 17% lower than the average price in Derby. There are 1,925 property listings for sale in Draycott.
What streets have the most expensive properties for sale in Draycott?
The streets with the most expensive properties for sale in Draycott are Cherry Tree Close at an average of £612,500, The Croft at an average of £605,000 and Bostocks Lane at an average of £532,500.
What streets have the most affordable properties for sale in Draycott?
The streets with the most affordable properties for sale in Draycott are Cowslip Meadow at an average of £145,240, St Marys Avenue at an average of £147,500 and Town End Road at an average of £151,750.
Which train stations are available in or near Draycott?
Some of the train stations available in or near Draycott are Long Eaton, Spondon and East Midlands Parkway.
Property Price Paid in Draycott by Year
The average sold property price by year was:
| Year | Average Sold Price | Price Change |
Sold Properties
|
|---|---|---|---|
| 2025 | £237,495 | -16% |
54 Properties |
| 2024 | £274,473 | 8% |
69 Properties |
| 2023 | £252,414 | -10% |
57 Properties |
| 2022 | £278,786 | 17% |
61 Properties |
| 2021 | £231,325 | 5% |
94 Properties |
| 2020 | £218,851 | -0,4% |
49 Properties |
| 2019 | £219,699 | 6% |
68 Properties |
| 2018 | £205,898 | 13% |
67 Properties |
| 2017 | £179,574 | 2% |
76 Properties |
| 2016 | £176,778 | -1% |
99 Properties |
| 2015 | £178,801 | 9% |
92 Properties |
| 2014 | £163,027 | 3% |
73 Properties |
| 2013 | £157,759 | -7% |
65 Properties |
| 2012 | £168,315 | 4% |
44 Properties |
| 2011 | £160,971 | 11% |
44 Properties |
| 2010 | £142,672 | -7% |
43 Properties |
| 2009 | £152,420 | 5% |
47 Properties |
| 2008 | £144,933 | -21% |
74 Properties |
| 2007 | £175,444 | 21% |
136 Properties |
| 2006 | £139,235 | -15% |
148 Properties |
| 2005 | £160,443 | 9% |
79 Properties |
| 2004 | £145,509 | 20% |
69 Properties |
| 2003 | £116,334 | 10% |
90 Properties |
| 2002 | £104,889 | 13% |
97 Properties |
| 2001 | £91,283 | 13% |
125 Properties |
| 2000 | £79,714 | 23% |
88 Properties |
| 1999 | £61,599 | -1% |
68 Properties |
| 1998 | £62,278 | 11% |
70 Properties |
| 1997 | £55,682 | -11% |
73 Properties |
| 1996 | £62,052 | 17% |
50 Properties |
| 1995 | £51,655 | - |
50 Properties |
Property Price per Property Type in Draycott
Here you can find historic sold price data in order to help with your property search.
The average Property Paid Price for specific property types in the last three years are:
| Property Type | Average Sold Price | Sold Properties |
|---|---|---|
| Semi Detached House | £237,126.00 | 72 Semi Detached Houses |
| Detached House | £460,120.00 | 37 Detached Houses |
| Terraced House | £182,120.00 | 38 Terraced Houses |
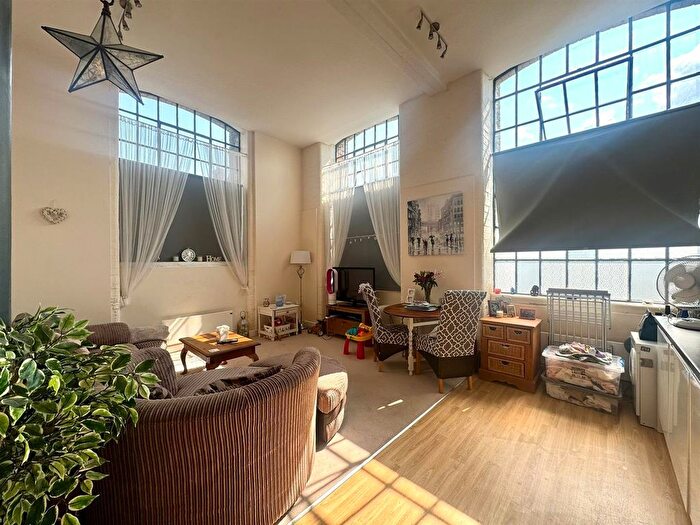
| Flat | £155,545.00 | 33 Flats |

