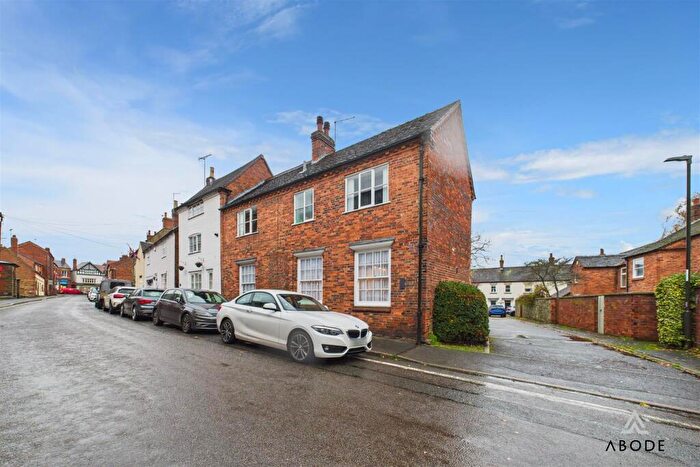
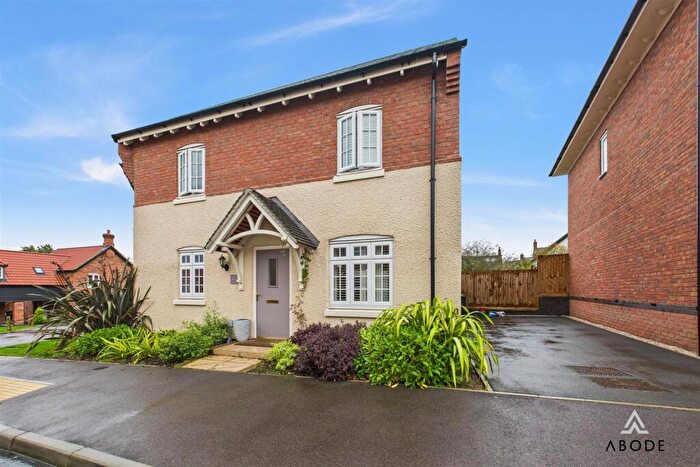
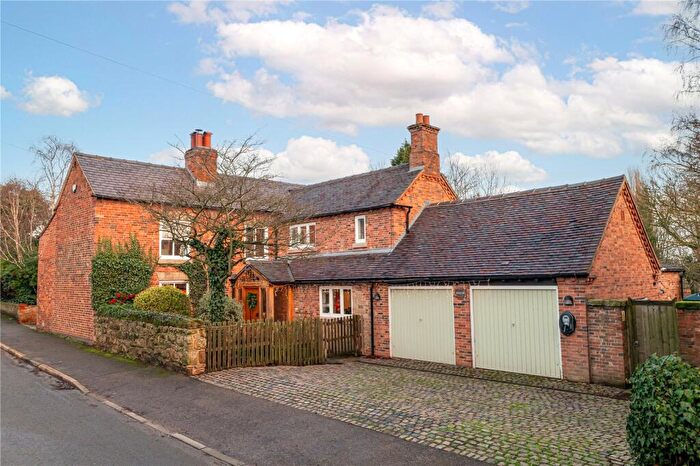
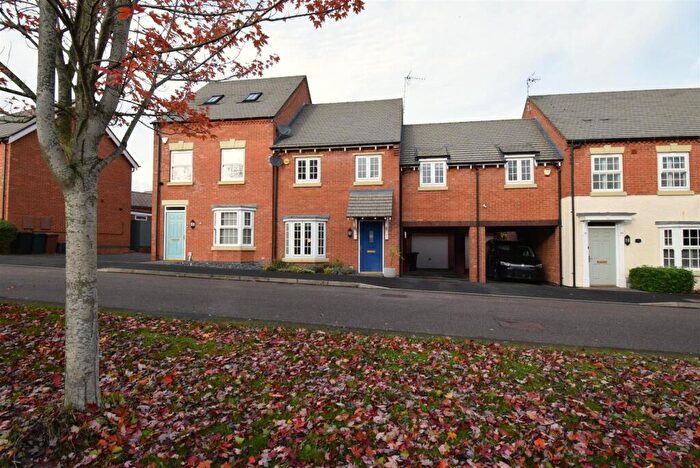
Houses for sale & to rent in Melbourne, Derby
House Prices in Melbourne
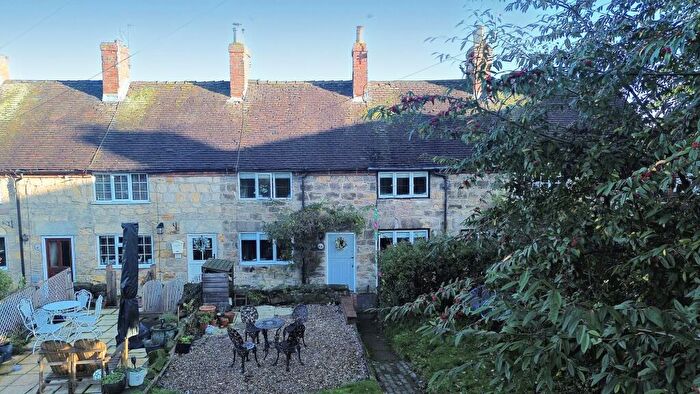
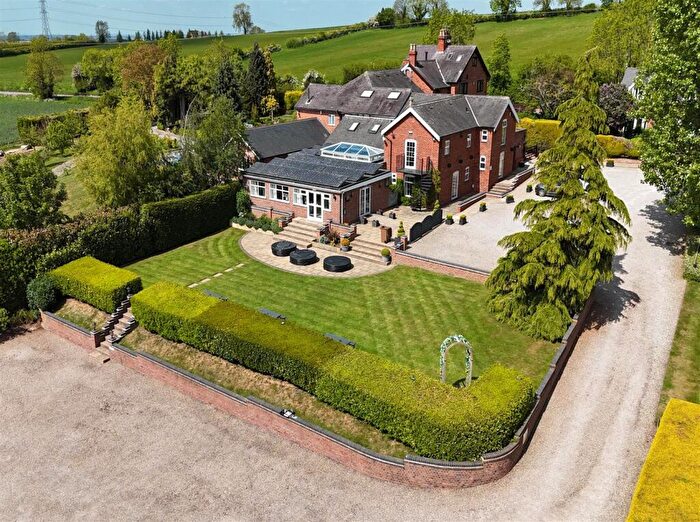
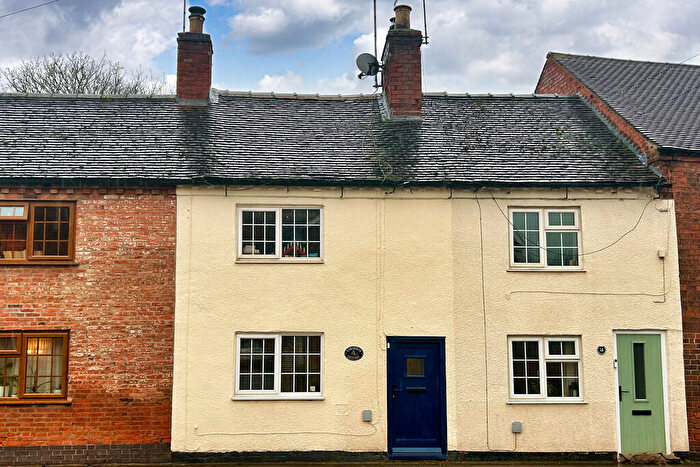
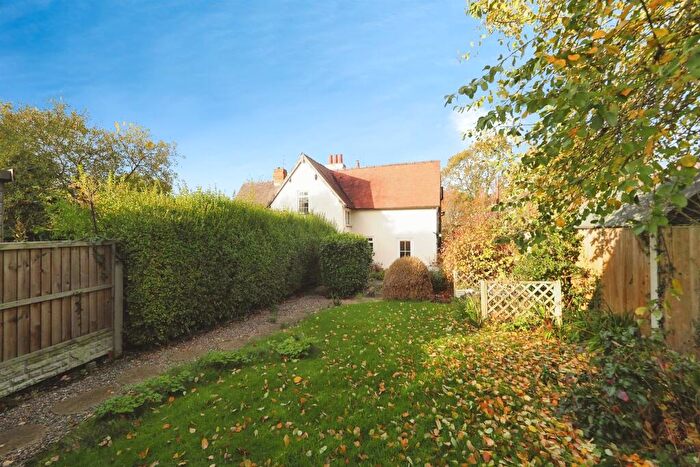
Properties in Melbourne have an average house price of £358,879.00 and had 250 Property Transactions within the last 3 years¹.
Melbourne is an area in Derby, Derbyshire with 2,244 households², where the most expensive property was sold for £1,055,000.00.
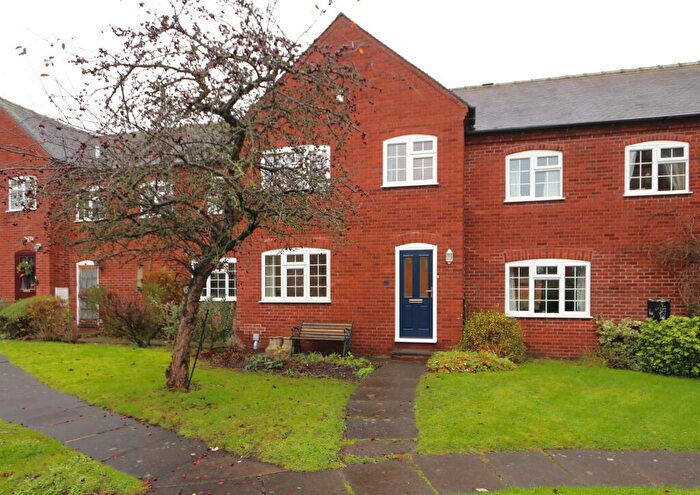
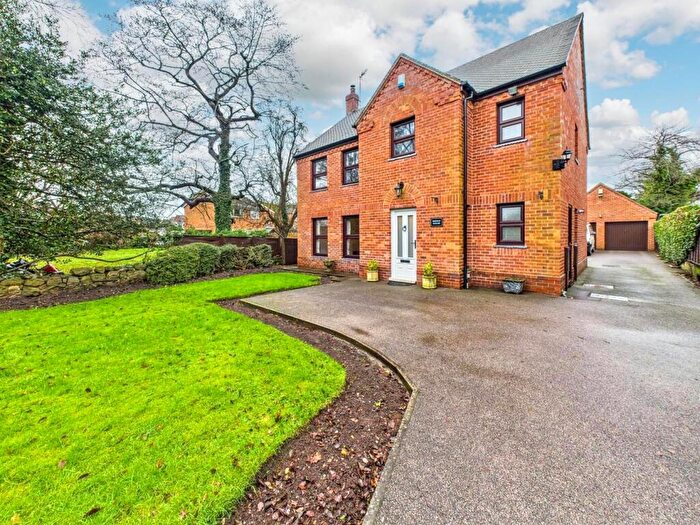
Properties for sale in Melbourne
Roads and Postcodes in Melbourne
Navigate through our locations to find the location of your next house in Melbourne, Derby for sale or to rent.
| Streets | Postcodes |
|---|---|
| Acacia Drive | DE73 8LT |
| Alma Street | DE73 8GA |
| Ashby Road | DE73 8ES |
| Beech Avenue | DE73 8FA DE73 8LP |
| Bembow Avenue | DE73 8GU |
| Bishops Court | DE73 8LN |
| Blackthorn Close | DE73 8LY |
| Blackwell Lane | DE73 8EL DE73 8JG |
| Blakemore Avenue | DE73 8ED |
| Blanchcroft | DE73 8GG |
| Boardman Close | DE73 8JF |
| Bog Lane | DE73 8HU |
| Bourne Court | DE73 8YG |
| Breach Lane | DE73 8DF |
| Calke Road | DE73 8DL |
| Carr Brook Way | DE73 8LH |
| Cartwright Close | DE73 8LA |
| Castle Lane | DE73 8JB |
| Castle Mews | DE73 8LW |
| Castle Mills | DE73 8BF |
| Castle Street | DE73 8DY DE73 8SR |
| Chantry Close | DE73 8ET |
| Chapel Street | DE73 8EH |
| Church Close | DE73 7GH |
| Church Square | DE73 8EN DE73 8JH |
| Church Street | DE73 8EJ |
| Cockshut Lane | DE73 8DG |
| Cockshut Lane Business Centre | DE73 8GP |
| Commerce Street | DE73 8FT |
| Coronation Close | DE73 8FH |
| Crowley Lane | DE73 8JP |
| Derby Hills | DE73 7LL |
| Derby Hills Farm Court | DE73 8EE |
| Derby Road | DE73 7HS DE73 8FE DE73 8FL DE73 8JN DE73 8DE DE73 8FF DE73 8JJ DE73 8JR |
| Dovesite Business Park | DE73 8HS |
| Dunnicliffe Lane | DE73 8GE |
| Earp Way | DE73 8JQ |
| Freeman Drive | DE73 8JA |
| George Street | DE73 8FS DE73 8GD DE73 8JL |
| Grange Close | DE73 8FJ |
| Hall Leys Lane | DE73 8HL |
| Hardacre Close | DE73 8GY |
| Hattons Court | DE73 8HR |
| High Street | DE73 8GJ DE73 8GF |
| Hills Lane | DE73 7HY |
| Hollies Farm Close | DE73 7GD |
| Hope Street | DE73 8FX |
| Huntingdon Court | DE73 8LZ |
| Ingleby Road | DE73 7GJ DE73 7HT DE73 7HU |
| Jackson Close | DE73 8JZ |
| Jawbone Lane | DE73 8BW DE73 8HN |
| Jubilee Close | DE73 8GR |
| Kings Newton Fields | DE73 8DD |
| Lampad Close | DE73 8GZ |
| Loake Court | DE73 8HB |
| Main Street | DE73 8BS DE73 8BX |
| Market Place | DE73 8DS |
| Marlpit Road | DE73 8JY |
| Melbourne Hill | DE73 7LH |
| Melton Avenue | DE73 8FP |
| Moira Street | DE73 8EW |
| Nettlefold Crescent | DE73 8DA |
| Newton Wonder Court | DE73 8HE |
| North Street | DE73 8FZ |
| Oaklands Way | DE73 8LR |
| Orchard Close | DE73 8EY |
| Pack Horse Road | DE73 8BZ DE73 8EG DE73 8HP DE73 8JE |
| Paget Road | DE73 8JW |
| Palmerston Court | DE73 8HY |
| Peniston Rise | DE73 8EZ |
| Penn Lane | DE73 8EP DE73 8EQ DE73 8EF |
| Pool Road | DE73 8AA |
| Potter Street | DE73 8DW DE73 8DX DE73 8HW |
| Potters Yard | DE73 8HX |
| Quaker Close | DE73 8GW |
| Queensway | DE73 8FG |
| Quick Close | DE73 8GH |
| Redway Croft | DE73 8GX |
| Robinsons Hill | DE73 8DJ |
| Russell Yard | DE73 8DZ |
| Salisbury Lane | DE73 8ER |
| Selina Street | DE73 8EU |
| Shepherds Lane | DE73 8HT |
| Sleepy Lane | DE73 8BU |
| Smith Avenue | DE73 8DB |
| South Street | DE73 8GB |
| Spinney Hill | DE73 8GT DE73 8LX |
| Stafford Close | DE73 8LD |
| Stanton Hill | DE73 7NF |
| Station Road | DE73 8BQ DE73 8BR DE73 8EA DE73 8EB DE73 8HJ |
| Stocking Lane | DE73 8LB |
| Sweet Leys Way | DE73 8LE |
| The Common | DE73 8DH |
| The Croft | DE73 8GS |
| The Lilypool | DE73 8GL |
| The Mews | DE73 8LQ |
| The Pingle | DE73 8FB |
| The Woodlands | DE73 8DP DE73 8DQ |
| Thomas Cook Close | DE73 8GQ |
| Tivey Way | DE73 8JS |
| Trent Lane | DE73 8BT |
| Turnbarrel | DE73 8FD |
| Union Street | DE73 8FY |
| Victoria Street | DE73 8FQ DE73 8FR |
| Wards Lane | DE73 7HX |
| Washington Close | DE73 8EX |
| Windsor Avenue | DE73 8FN |
| Wood End Lane | DE73 7GE |
| Woodhouses | DE73 8DN |
| Woodlands Close | DE73 8LJ |
| Woodlands Way | DE73 8DR |
| DE73 8AB DE73 8BJ DE73 8DT |
Transport near Melbourne
-
Peartree Station
-
Willington Station
-
Spondon Station
-
Derby Station
-
Long Eaton Station
-
East Midlands Parkway Station
-
Burton-On-Trent Station
- FAQ
- Price Paid By Year
- Property Type Price
Frequently asked questions about Melbourne
What is the average price for a property for sale in Melbourne?
The average price for a property for sale in Melbourne is £358,879. This amount is 16% higher than the average price in Derby. There are 917 property listings for sale in Melbourne.
What streets have the most expensive properties for sale in Melbourne?
The streets with the most expensive properties for sale in Melbourne are Wood End Lane at an average of £1,030,000, Wards Lane at an average of £765,000 and Main Street at an average of £647,625.
What streets have the most affordable properties for sale in Melbourne?
The streets with the most affordable properties for sale in Melbourne are Castle Mills at an average of £177,692, Chapel Street at an average of £179,000 and Grange Close at an average of £200,000.
Which train stations are available in or near Melbourne?
Some of the train stations available in or near Melbourne are Peartree, Willington and Spondon.
Property Price Paid in Melbourne by Year
The average sold property price by year was:
| Year | Average Sold Price | Price Change |
Sold Properties
|
|---|---|---|---|
| 2025 | £345,707 | -4% |
63 Properties |
| 2024 | £359,336 | -2% |
103 Properties |
| 2023 | £368,199 | 7% |
84 Properties |
| 2022 | £342,975 | 5% |
85 Properties |
| 2021 | £324,851 | -6% |
112 Properties |
| 2020 | £345,103 | 10% |
62 Properties |
| 2019 | £311,552 | -2% |
117 Properties |
| 2018 | £317,191 | 13% |
99 Properties |
| 2017 | £275,997 | -1% |
91 Properties |
| 2016 | £278,585 | 8% |
111 Properties |
| 2015 | £257,633 | 12% |
99 Properties |
| 2014 | £227,343 | -14% |
117 Properties |
| 2013 | £258,876 | 4% |
121 Properties |
| 2012 | £247,370 | 15% |
97 Properties |
| 2011 | £209,448 | -13% |
66 Properties |
| 2010 | £237,380 | 12% |
90 Properties |
| 2009 | £208,613 | -3% |
69 Properties |
| 2008 | £215,443 | -10% |
60 Properties |
| 2007 | £235,972 | 12% |
118 Properties |
| 2006 | £206,913 | -6% |
142 Properties |
| 2005 | £218,835 | 15% |
81 Properties |
| 2004 | £186,283 | 14% |
112 Properties |
| 2003 | £160,128 | 20% |
93 Properties |
| 2002 | £127,433 | 15% |
127 Properties |
| 2001 | £108,426 | 3% |
125 Properties |
| 2000 | £105,201 | 15% |
102 Properties |
| 1999 | £89,584 | 10% |
125 Properties |
| 1998 | £80,188 | 4% |
109 Properties |
| 1997 | £77,052 | 11% |
122 Properties |
| 1996 | £68,656 | 3% |
147 Properties |
| 1995 | £66,590 | - |
78 Properties |
Property Price per Property Type in Melbourne
Here you can find historic sold price data in order to help with your property search.
The average Property Paid Price for specific property types in the last three years are:
| Property Type | Average Sold Price | Sold Properties |
|---|---|---|
| Semi Detached House | £336,188.00 | 74 Semi Detached Houses |
| Detached House | £514,098.00 | 83 Detached Houses |
| Terraced House | £246,034.00 | 81 Terraced Houses |
| Flat | £186,912.00 | 12 Flats |

