
Houses for sale in Mickleover, Derby
House Prices in Mickleover
Properties in Mickleover have an average house price of £348k and had 62 Property Transactions within the last 3 years¹.
Mickleover is an area in Derby, Derbyshire with 442 households², where the most expensive property was sold for £507k.
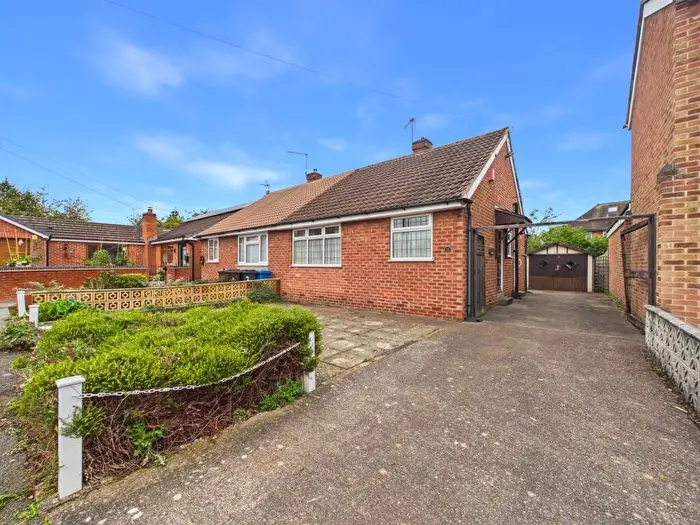
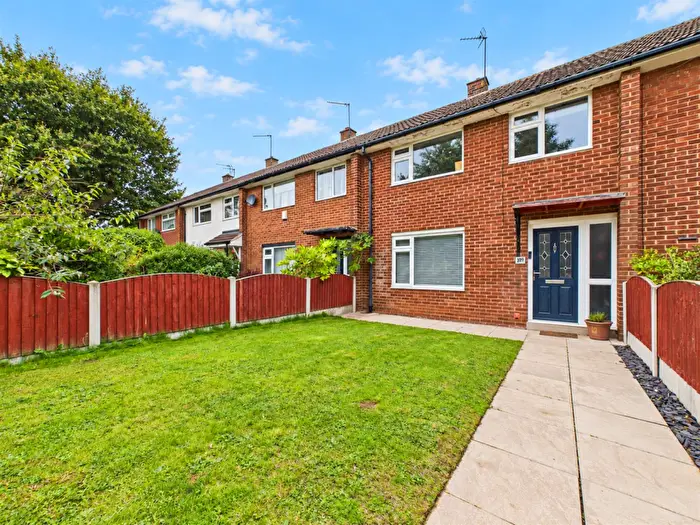
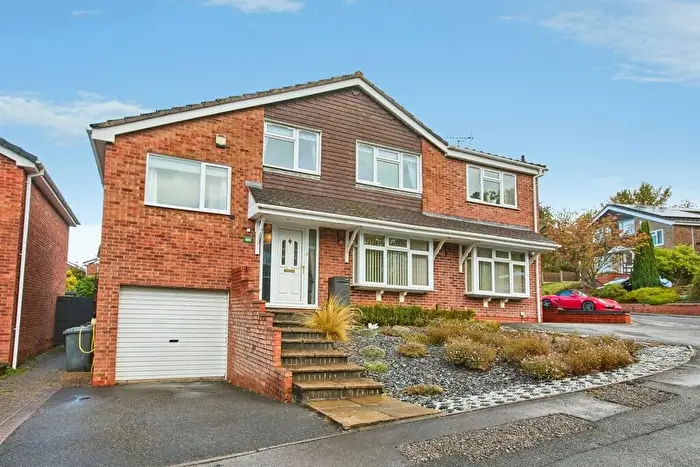
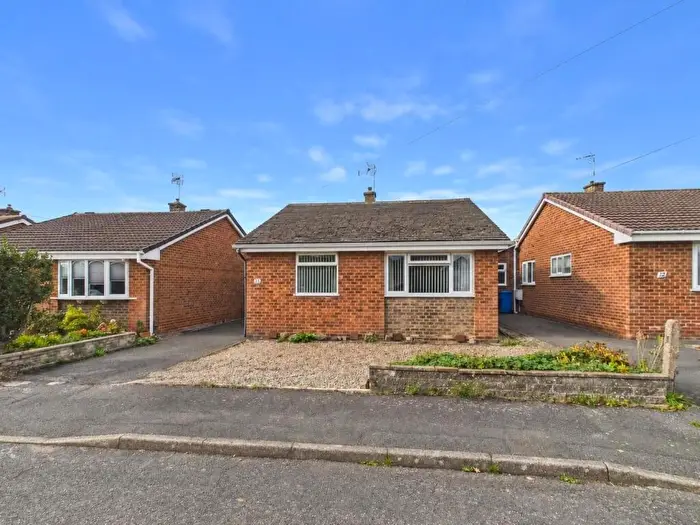
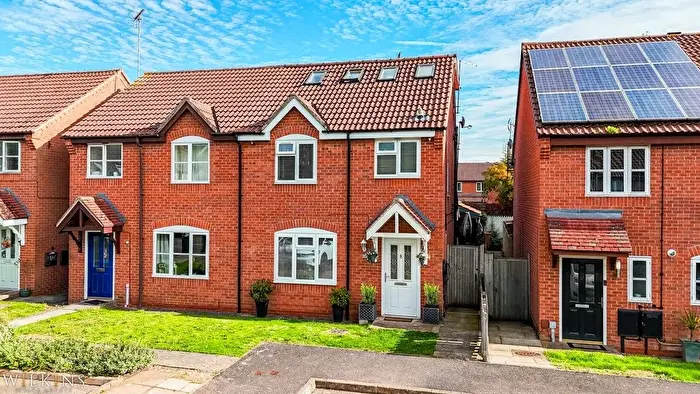
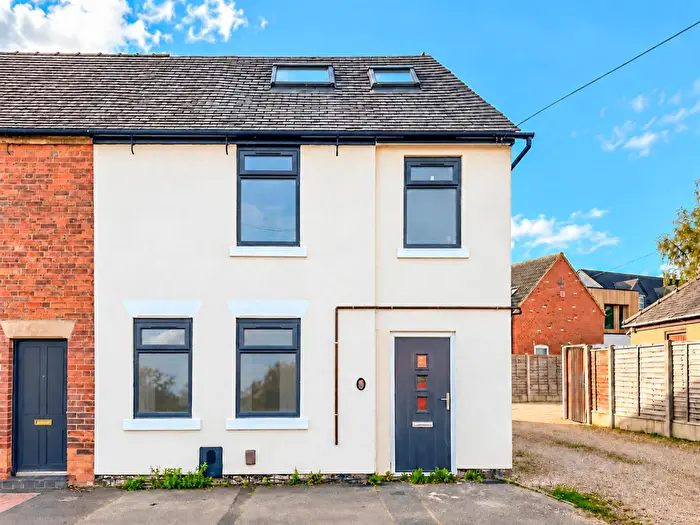
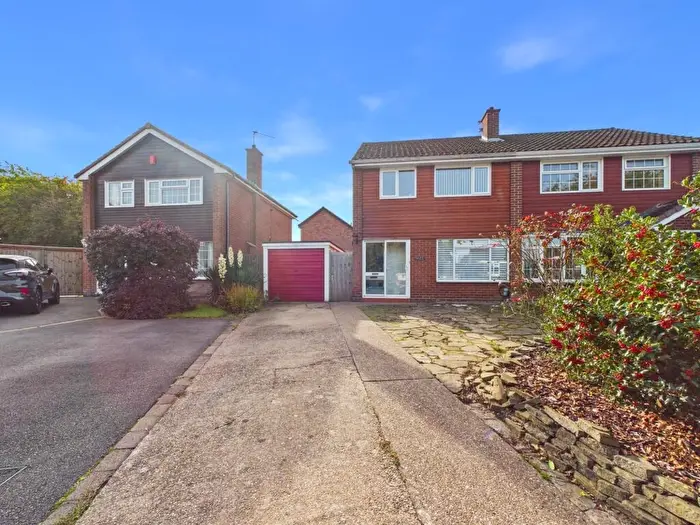
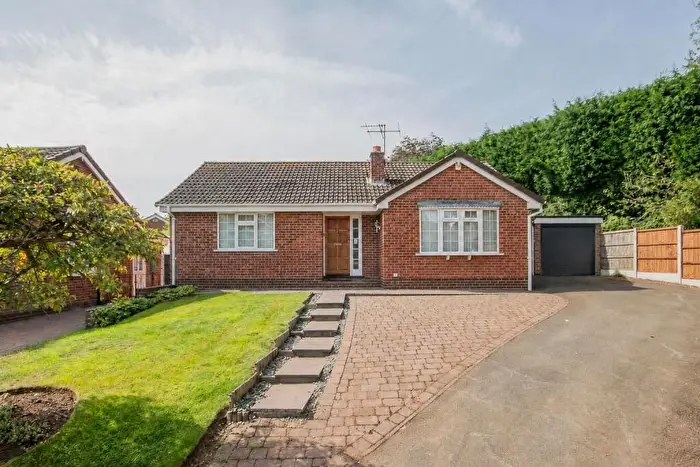
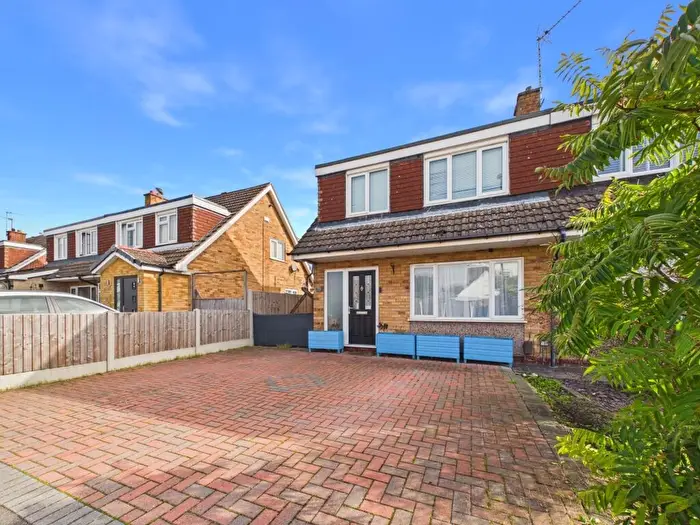
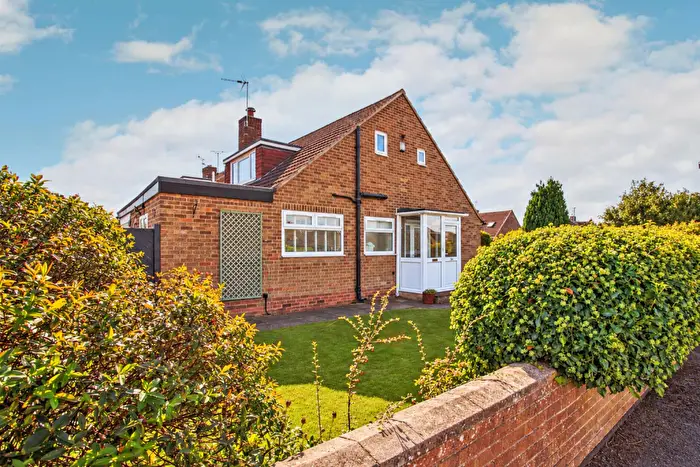
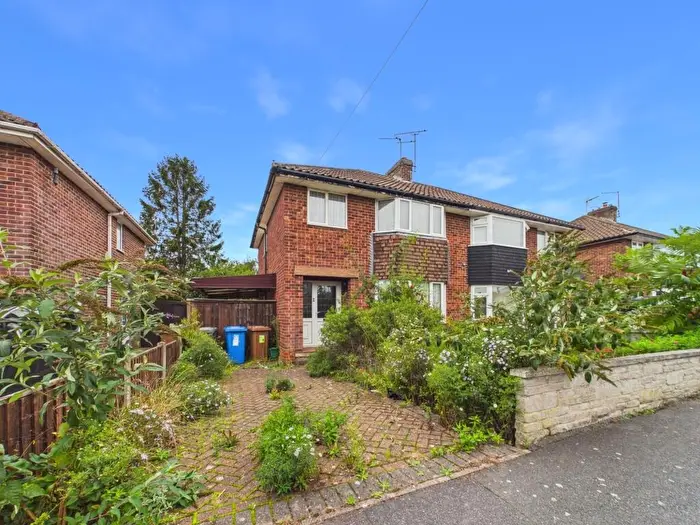
Properties for sale in Mickleover

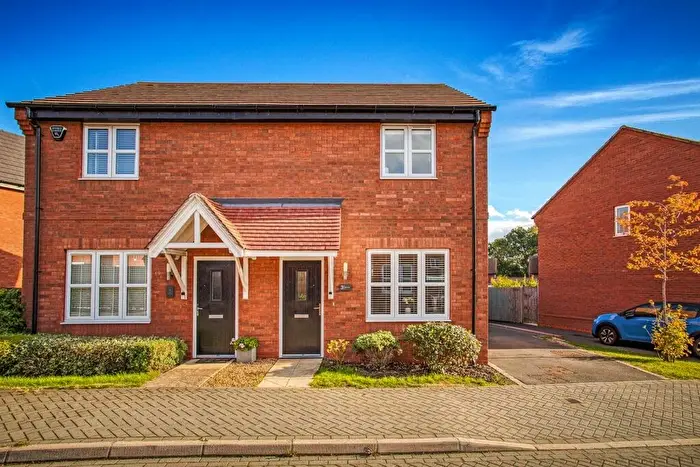

 2 Bedrooms
 2 Bathrooms


If you are looking to sell your house, let it out, or receive a property valuation, an expert can help you.
Click the button below to get started.








Roads and Postcodes in Mickleover
Navigate through our locations to find the location of your next house in Mickleover, Derby for sale or to rent.
| Streets | Postcodes |
|---|---|
| Agrimony Place | DE3 0FE |
| All Saints Court | DE3 0UX |
| Bain Gardens | DE3 0GU |
| Bay Close | DE3 0FF |
| Borage Grove | DE3 0FG |
| Brierfield Way | DE3 9SA |
| Buddleia Grove | DE3 0FH |
| Chamomile Place | DE3 0FJ |
| Chicory Close | DE3 0FL |
| Crane Gardens | DE3 0GX |
| Curzon Court | DE3 0EZ |
| Daffodil Place | DE3 0FN |
| Daisy Grove | DE3 0FP |
| Devonshire Drive | DE3 9EY |
| Elderflower Close | DE3 0FQ |
| Eyebright Close | DE3 0FR |
| Fennel Avenue | DE3 0FS |
| Foragers Way | DE3 9NY |
| Gooseberry Grove | DE3 9NZ |
| Greyfriars Place | DE3 9DL |
| Holly Court | DE3 0TA |
| Holly End Road | DE3 0GA |
| Honeysuckle Road | DE3 0FU |
| Hop Place | DE3 0FT |
| Iris Crescent | DE3 0FW |
| Limes Avenue | DE3 0BZ DE3 0DY |
| Linseed Place | DE3 0FX |
| Marjoram Grove | DE3 0FY |
| Mint Grove | DE3 0GE |
| Murray Road | DE3 9LL |
| Oregano Close | DE3 0GF |
| Radbourne Lane | DE22 4LX |
| Rosehip Road | DE3 9PB |
| Sage Court | DE3 0GH |
| Samphire Close | DE3 0GJ |
| Starflower Way | DE3 0FB DE3 0FD |
| Station Road | DE3 9GL |
| Tarragon Close | DE3 0GL |
| Teasel Grove | DE3 0GN |
| The Hollow | DE3 0BW |
| Thrift Close | DE3 0GP |
| Uttoxeter Road | DE3 0ZQ |
| Vicarage Road | DE3 0EY DE3 0HA DE3 0DZ |
Property price trends in Mickleover
According to the latest Land Registry data, the average home in Mickleover sold for £339,111 in 2026. That figure comes from 351 sales logged over the past 16 years.
Prices have fallen back over the last three years. Compared with 2023, when the typical sale came in around £382,294, that's a fall of roughly 11.3%.
Looking back five years, average prices are up about 2.6% since 2021, a gain of around £8,673 in cash terms.
Zoom out to the past decade for the fuller picture. Back in 2018, homes here averaged £216,600, so the typical sold price has climbed about 56.6% since then, roughly 5.8% a year. Stretch the view to fifteen years and that annual pace eases back to about 0.3%.
Frequently asked questions about Mickleover
What is the average price for a property for sale in Mickleover?
The average price for a property for sale in Mickleover is £347,875. This amount is 13% higher than the average price in Derby. There are 1,122 property listings for sale in Mickleover.
What streets have the most expensive properties for sale in Mickleover?
The streets with the most expensive properties for sale in Mickleover are Bay Close at an average of £461,000, Daffodil Place at an average of £418,166 and Buddleia Grove at an average of £412,500.
What streets have the most affordable properties for sale in Mickleover?
The streets with the most affordable properties for sale in Mickleover are Greyfriars Place at an average of £135,000, Tarragon Close at an average of £189,714 and Chicory Close at an average of £269,200.
Which train stations are available in or near Mickleover?
Some of the train stations available in or near Mickleover are Peartree, Derby and Willington.
Property Price Paid in Mickleover by Year
The average sold property price by year was:
| Year | Average Sold Price | Price Change |
Sold Properties

|
|---|---|---|---|
| 2026 | £339,111 | 
15% |
9 Properties |
| 2025 | £287,111 | 
-33% |
18 Properties |
| 2024 | £380,513 |
-0,5% |
18 Properties |
| 2023 | £382,294 |
11% |
17 Properties |
| 2022 | £339,017 |
3% |
53 Properties |
| 2021 | £330,438 |
23% |
48 Properties |
| 2020 | £253,259 |
-2% |
71 Properties |
| 2019 | £258,485 |
16% |
111 Properties |
| 2018 | £216,600 |
-50% |
5 Properties |
| 2010 | £325,000 | - |
1 Property |
Property Price per Property Type in Mickleover
Here you can find historic sold price data in order to help with your property search.
The average Property Paid Price for specific property types in the last three years are:
| Property Type | Average Sold Price | Sold Properties |
|---|---|---|
| Detached House | £394,094.00 | 45 Detached Houses |
| Semi Detached House | £260,615.00 | 13 Semi Detached Houses |
| Flat | £135,000.00 | 1 Flat |
| Terraced House | £103,666.00 | 3 Terraced Houses |
