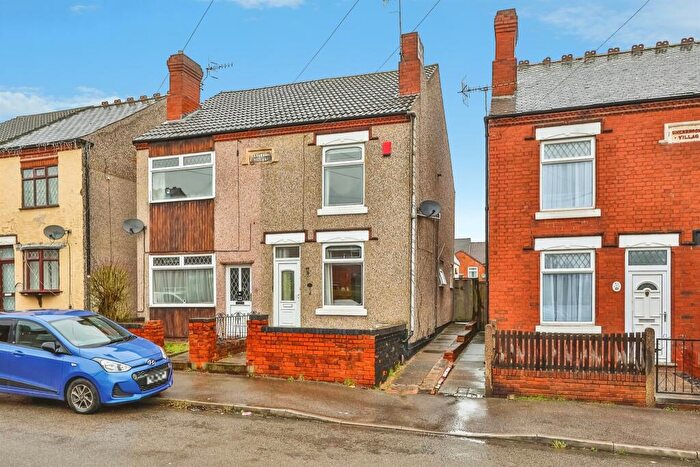
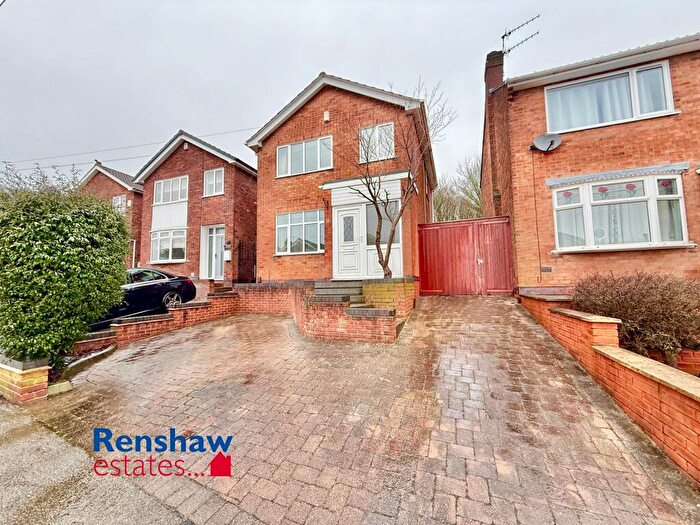
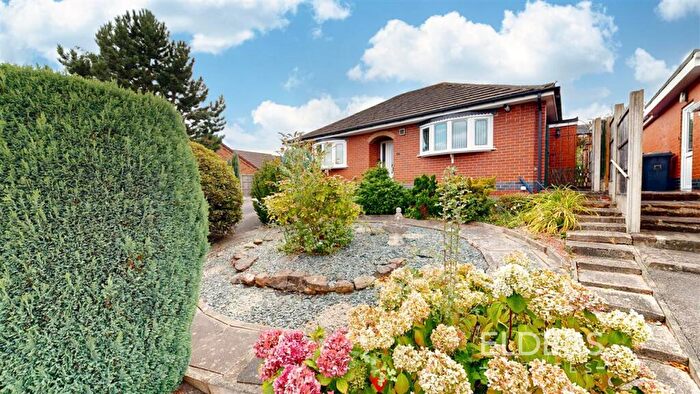
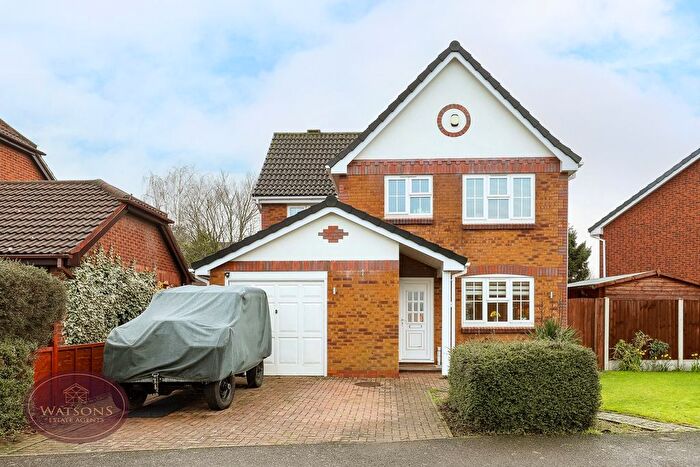
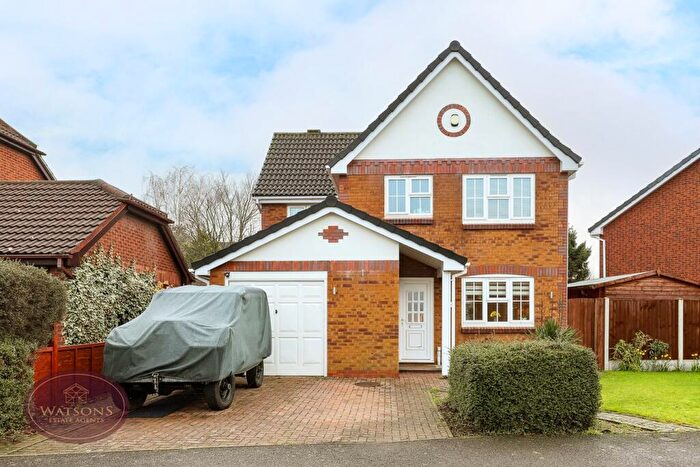
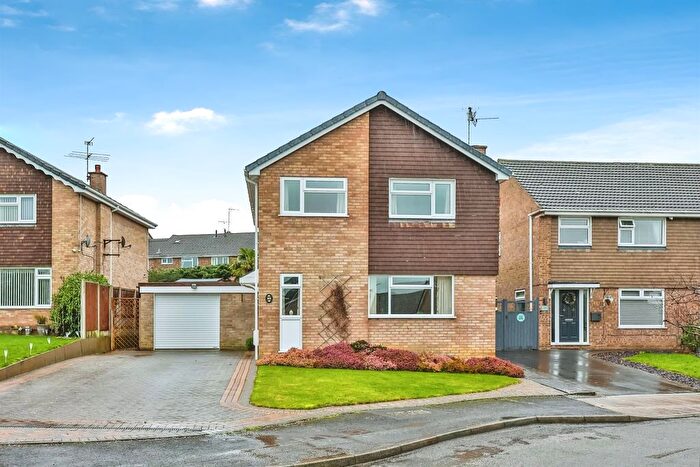
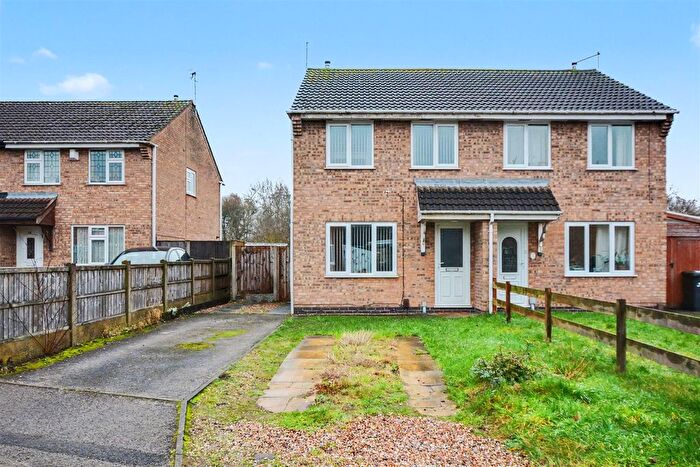
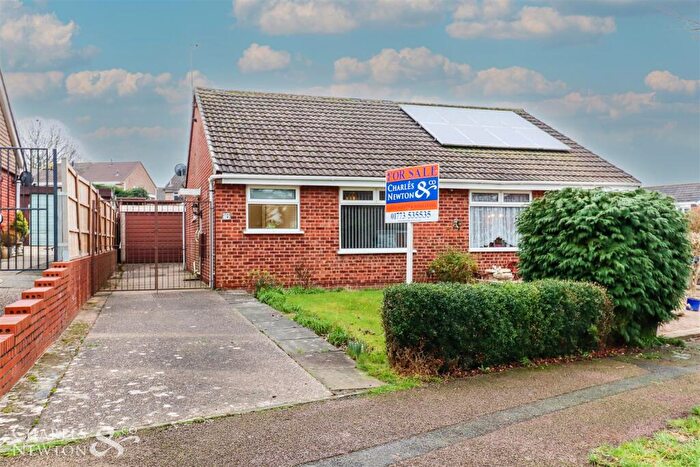
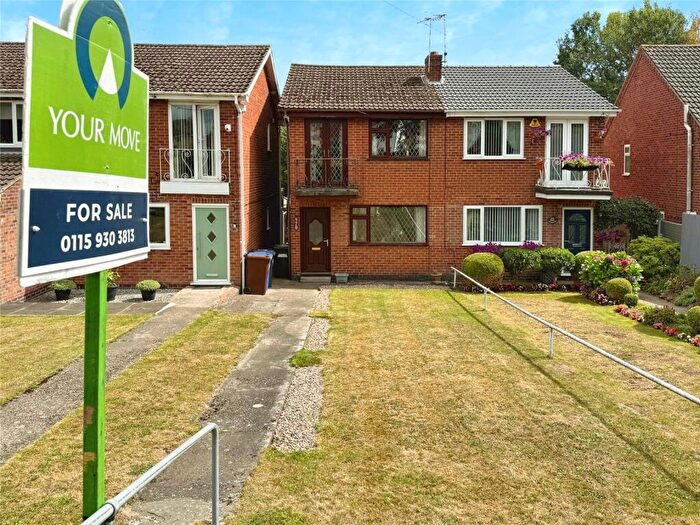
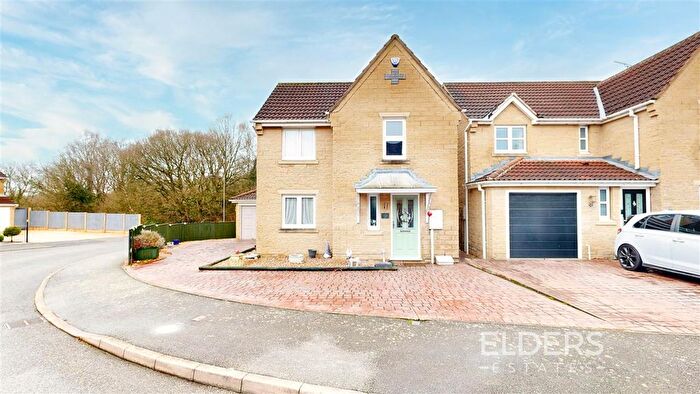
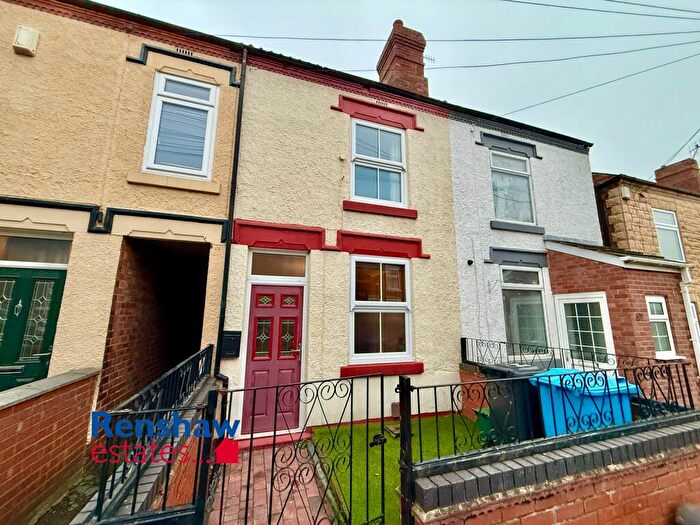
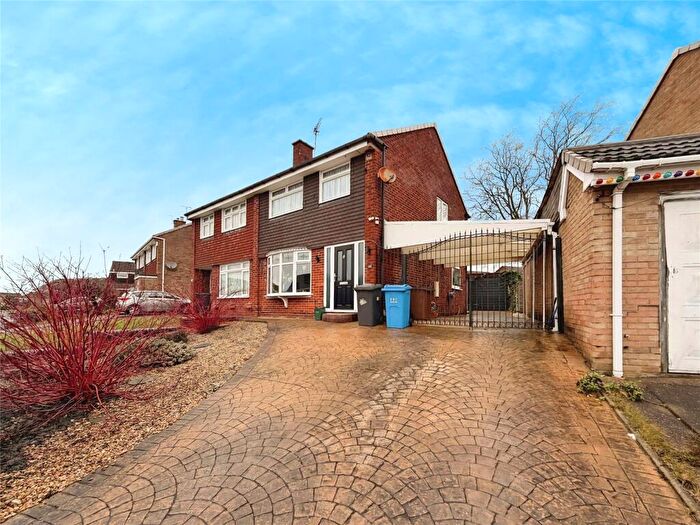
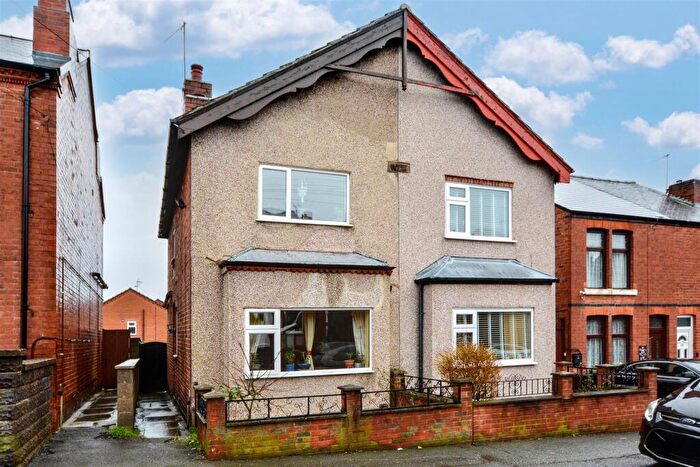
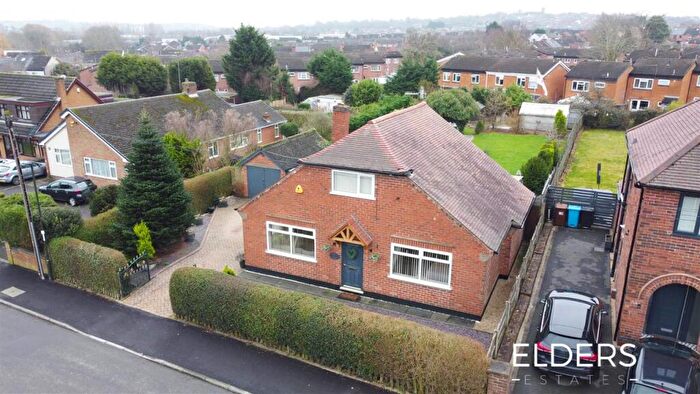
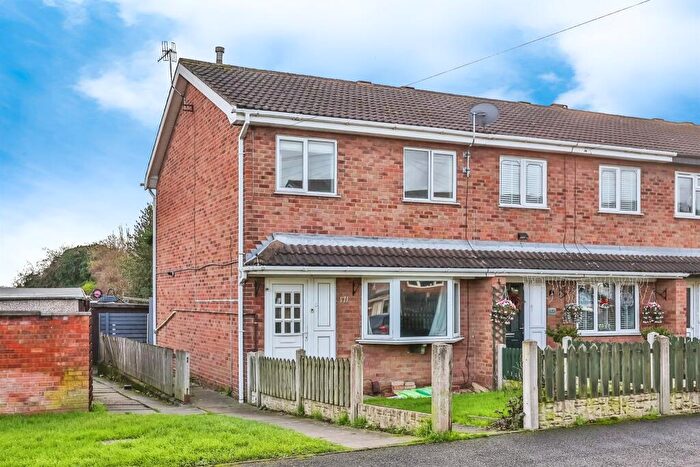
Houses for sale & to rent in Ilkeston North, Ilkeston
House Prices in Ilkeston North
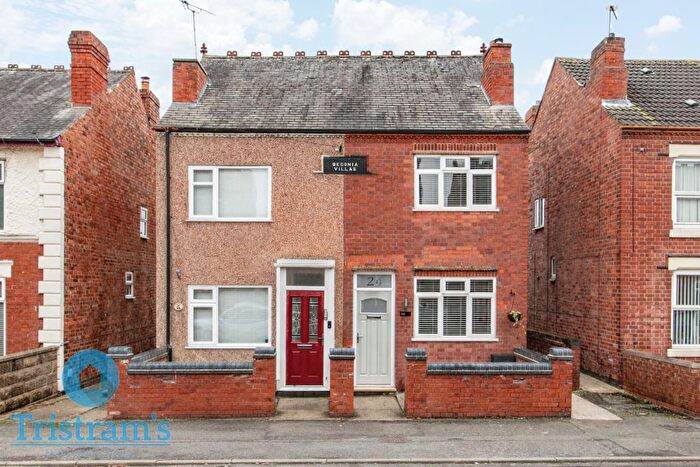
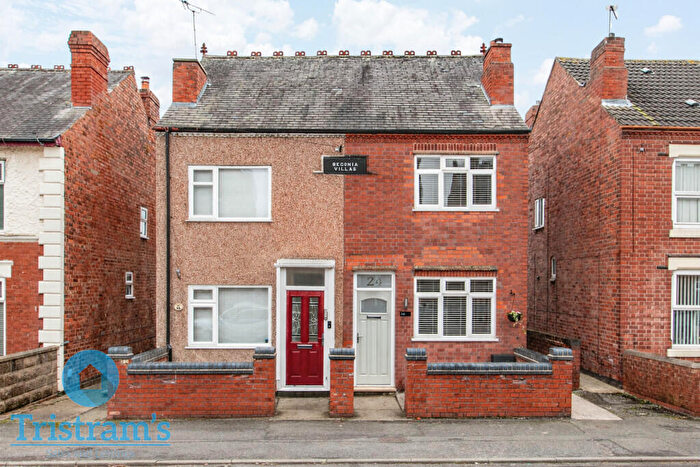
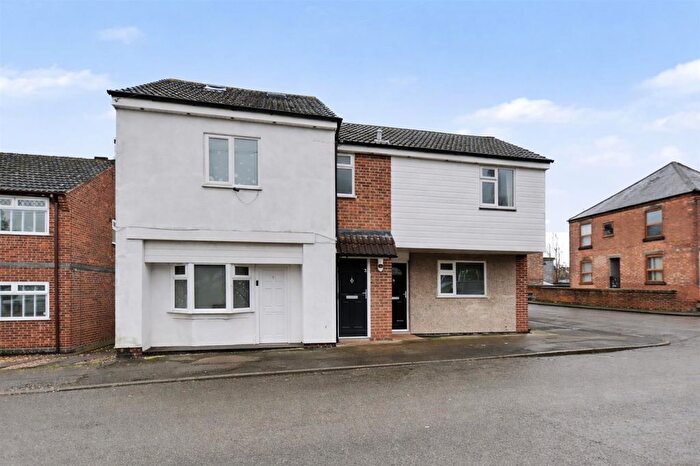
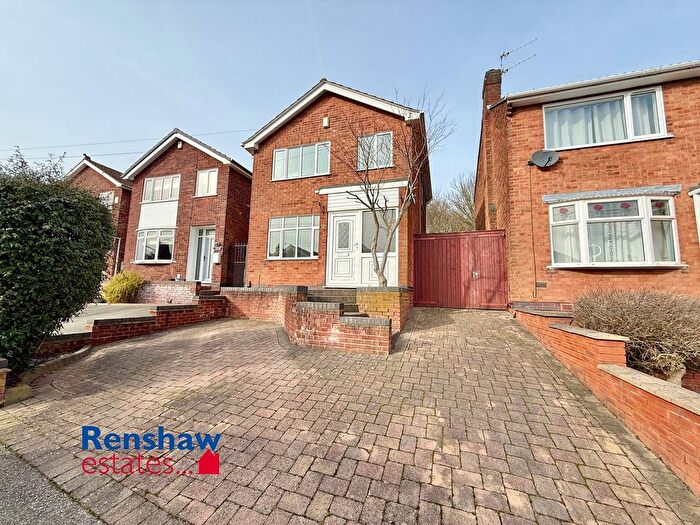
Properties in Ilkeston North have an average house price of £158,489.00 and had 146 Property Transactions within the last 3 years¹.
Ilkeston North is an area in Ilkeston, Derbyshire with 1,700 households², where the most expensive property was sold for £395,000.00.
Properties for sale in Ilkeston North
Roads and Postcodes in Ilkeston North
Navigate through our locations to find the location of your next house in Ilkeston North, Ilkeston for sale or to rent.
| Streets | Postcodes |
|---|---|
| Ash Street | DE7 8NT |
| Ashford Place | DE7 8SH |
| Barlborough Road | DE7 8WJ |
| Beauvale Drive | DE7 8RR DE7 8RU DE7 8RY DE7 8RZ DE7 8SA DE7 8SJ |
| Beresford Drive | DE7 8RT DE7 8SN |
| Birchover Place | DE7 8SL |
| Blackwell Avenue | DE7 8DF |
| Boythorpe Close | DE7 8WG |
| Brampton Close | DE7 8WW |
| Brands Close | DE7 8WL |
| Brimington Close | DE7 8BP |
| Calley Avenue | DE7 8BE |
| Castleton Avenue | DE7 8SP |
| Church Drive | DE7 8QB DE7 8QE |
| Church Street | DE7 8QF DE7 8QG DE7 8QJ DE7 8QP DE7 8QS |
| Coppice Avenue | DE7 8QD |
| Cotmanhay Road | DE7 8NZ DE7 8QT |
| Cowley Close | DE7 8WA |
| Devonshire Close | DE7 8RS |
| Donner Crescent | DE7 8SQ |
| Dovedale Circle | DE7 8RP DE7 8RQ DE7 8SE DE7 8SG |
| Dronfield Place | DE7 8RX |
| Dukes Place | DE7 8QH |
| Edale Square | DE7 8SB |
| Foxley Road | DE7 8WR |
| Gosforth Avenue | DE7 8BH |
| Hartington Place | DE7 8SF |
| Hartshay Close | DE7 8WQ |
| Heanor Road | DE7 8TG DE7 8TH DE7 8TJ DE7 8TN |
| Henshaw Place | DE7 8RL |
| Holmewood Avenue | DE7 8DE |
| Ilam Square | DE7 8SR |
| Inkerman Close | DE7 8DP |
| Jeffries Close | DE7 8TW |
| Langley Avenue | DE7 8RW |
| Lathkill Avenue | DE7 8SS |
| Lings Close | DE7 8WT |
| Longcroft Avenue | DE7 8DA |
| Marsh Avenue | DE7 8BW |
| Millersdale Avenue | DE7 8SD |
| Milton Avenue | DE7 8NW |
| Milton Road | DE7 8NU |
| Milton Street | DE7 8NX |
| Monsall Avenue | DE7 8RN |
| Mount Pleasant | DE7 8QU |
| Norwood Close | DE7 8WX |
| Prince Street | DE7 8QQ DE7 8QR |
| Rossendale | DE7 8ZN |
| Ryefield Avenue | DE7 8WY |
| Shirland Close | DE7 8WF |
| Skeavingtons Lane | DE7 8SU DE7 8SX |
| Swanwick Road | DE7 8WH |
| The Copse | DE7 8TT |
| Turnoak Avenue | DE7 8BY |
| Vicarage Avenue | DE7 8QN |
| Vicarage Street | DE7 8QL |
| Wesley Street | DE7 8QW |
| Wheeldon Close | DE7 8BF |
| Whitely Avenue | DE7 8WB |
| Whitwell Close | DE7 8BL |
| Woodland Avenue | DE7 8QA |
| Woodside Crescent | DE7 8TY |
Transport near Ilkeston North
- FAQ
- Price Paid By Year
- Property Type Price
Frequently asked questions about Ilkeston North
What is the average price for a property for sale in Ilkeston North?
The average price for a property for sale in Ilkeston North is £158,489. This amount is 24% lower than the average price in Ilkeston. There are 1,249 property listings for sale in Ilkeston North.
What streets have the most expensive properties for sale in Ilkeston North?
The streets with the most expensive properties for sale in Ilkeston North are The Copse at an average of £348,750, Vicarage Street at an average of £261,000 and Ryefield Avenue at an average of £226,000.
What streets have the most affordable properties for sale in Ilkeston North?
The streets with the most affordable properties for sale in Ilkeston North are Gosforth Avenue at an average of £80,000, Cotmanhay Road at an average of £101,166 and Lathkill Avenue at an average of £102,000.
Which train stations are available in or near Ilkeston North?
Some of the train stations available in or near Ilkeston North are Ilkeston, Langley Mill and Bulwell.
Property Price Paid in Ilkeston North by Year
The average sold property price by year was:
| Year | Average Sold Price | Price Change |
Sold Properties
|
|---|---|---|---|
| 2025 | £168,895 | 9% |
43 Properties |
| 2024 | £153,330 | -1% |
50 Properties |
| 2023 | £154,914 | -3% |
53 Properties |
| 2022 | £159,525 | 4% |
61 Properties |
| 2021 | £153,006 | 21% |
66 Properties |
| 2020 | £120,884 | -2% |
44 Properties |
| 2019 | £123,802 | -0,3% |
43 Properties |
| 2018 | £124,196 | 1% |
63 Properties |
| 2017 | £123,088 | 11% |
50 Properties |
| 2016 | £109,303 | 15% |
41 Properties |
| 2015 | £93,297 | -12% |
51 Properties |
| 2014 | £104,578 | 9% |
40 Properties |
| 2013 | £94,817 | -6% |
40 Properties |
| 2012 | £100,315 | -2% |
28 Properties |
| 2011 | £102,200 | 1% |
29 Properties |
| 2010 | £101,254 | 11% |
31 Properties |
| 2009 | £90,614 | -14% |
25 Properties |
| 2008 | £102,943 | 8% |
50 Properties |
| 2007 | £95,143 | -9% |
75 Properties |
| 2006 | £103,502 | 14% |
104 Properties |
| 2005 | £88,589 | -7% |
55 Properties |
| 2004 | £95,008 | 37% |
50 Properties |
| 2003 | £59,650 | 18% |
53 Properties |
| 2002 | £48,671 | 8% |
54 Properties |
| 2001 | £44,790 | 17% |
51 Properties |
| 2000 | £37,178 | -11% |
52 Properties |
| 1999 | £41,392 | -0,2% |
38 Properties |
| 1998 | £41,484 | 13% |
37 Properties |
| 1997 | £36,287 | -3% |
37 Properties |
| 1996 | £37,426 | 12% |
34 Properties |
| 1995 | £33,005 | - |
35 Properties |
Property Price per Property Type in Ilkeston North
Here you can find historic sold price data in order to help with your property search.
The average Property Paid Price for specific property types in the last three years are:
| Property Type | Average Sold Price | Sold Properties |
|---|---|---|
| Semi Detached House | £148,821.00 | 70 Semi Detached Houses |
| Detached House | £237,891.00 | 28 Detached Houses |
| Terraced House | £126,361.00 | 47 Terraced Houses |
| Flat | £122,000.00 | 1 Flat |

