
Houses for sale & to rent in Codnor And Waingroves, Ripley
House Prices in Codnor And Waingroves
Properties in Codnor And Waingroves have an average house price of £191k and had 208 Property Transactions within the last 3 years¹.
Codnor And Waingroves is an area in Ripley, Derbyshire with 2,042 households², where the most expensive property was sold for £800k.
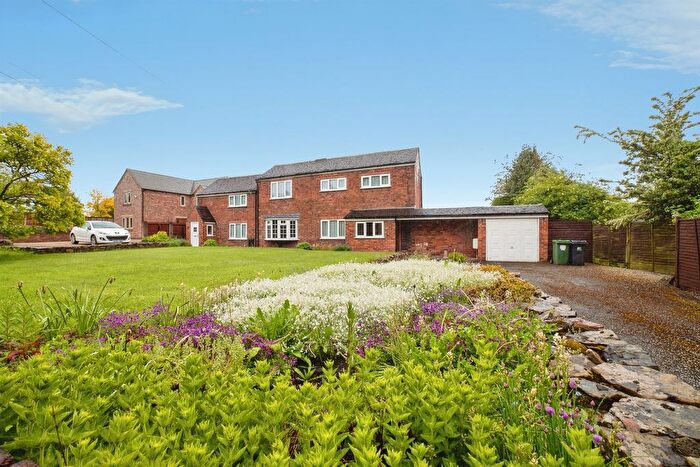
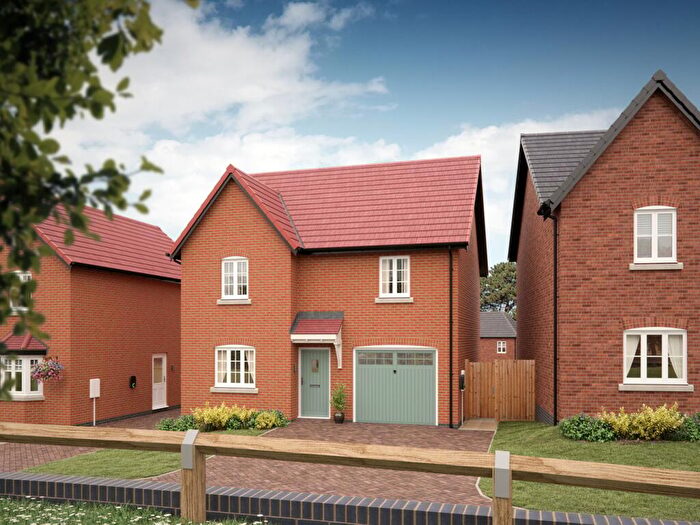
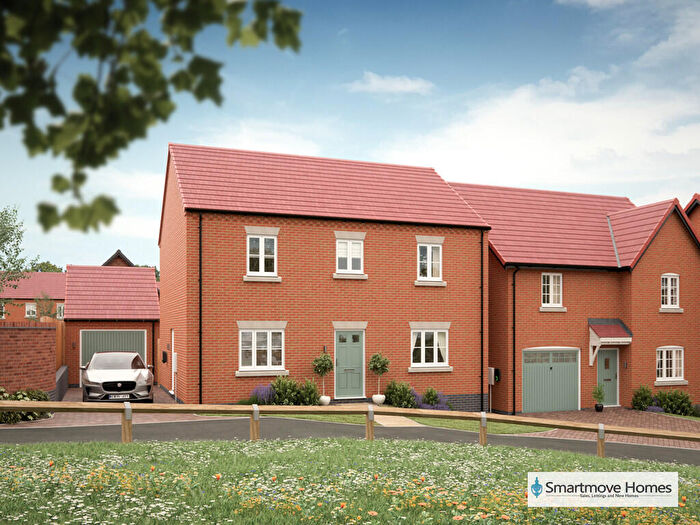
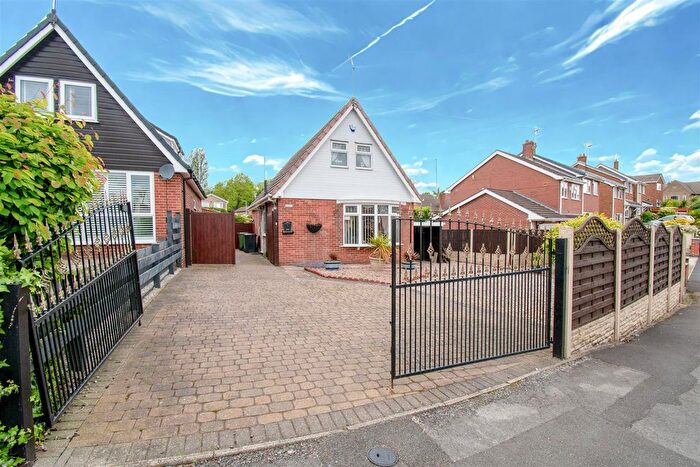
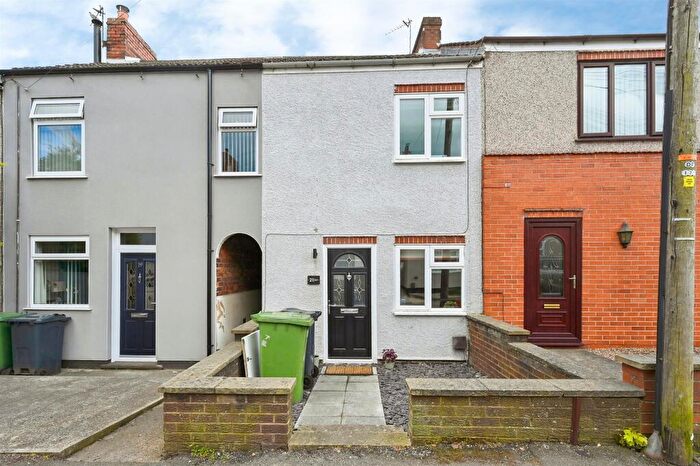
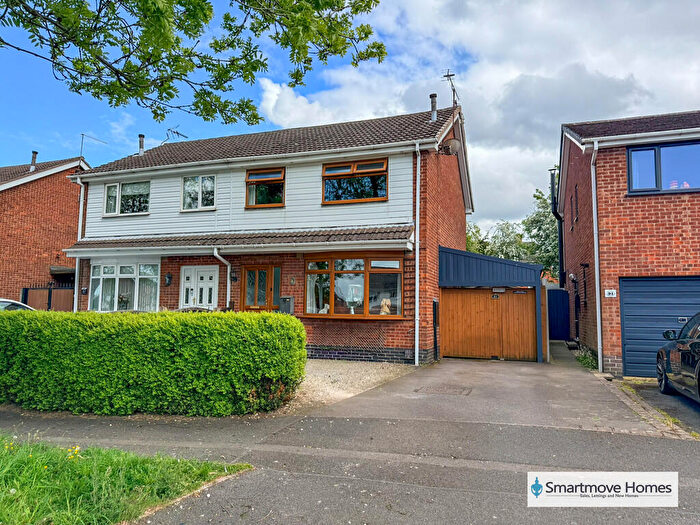
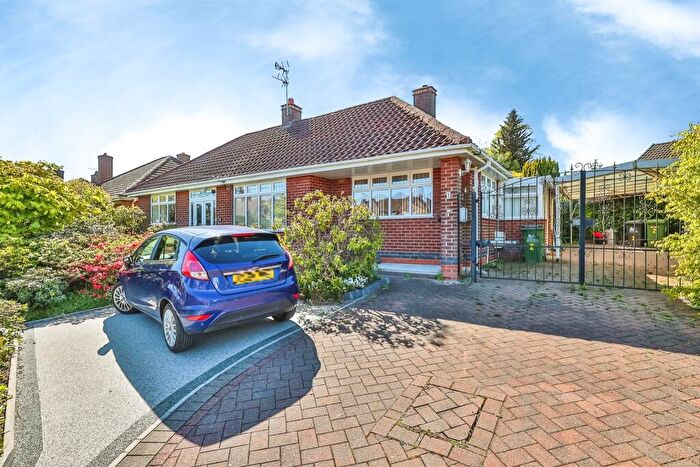
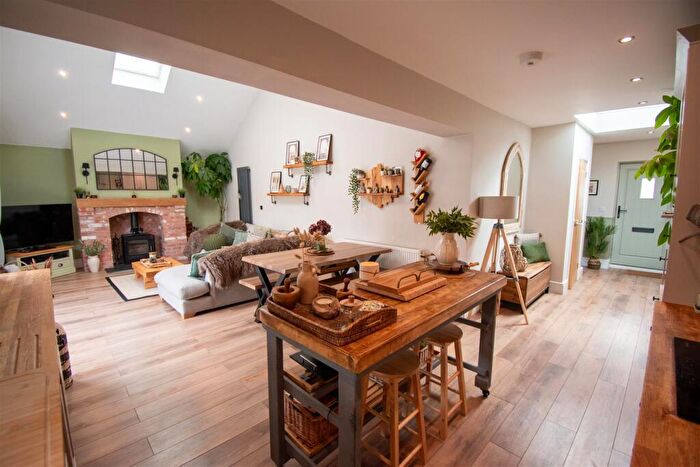
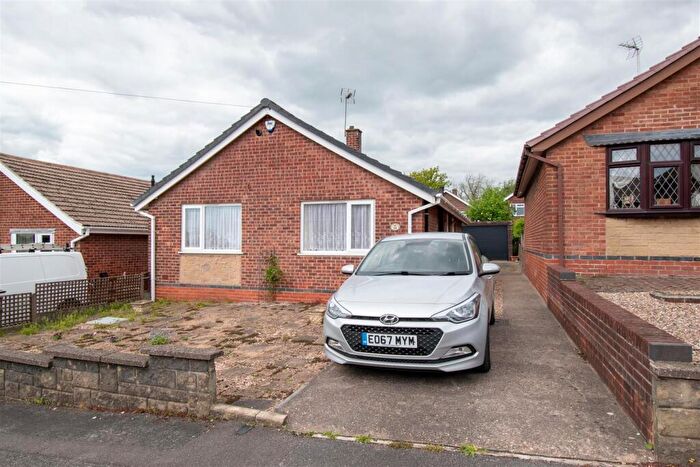
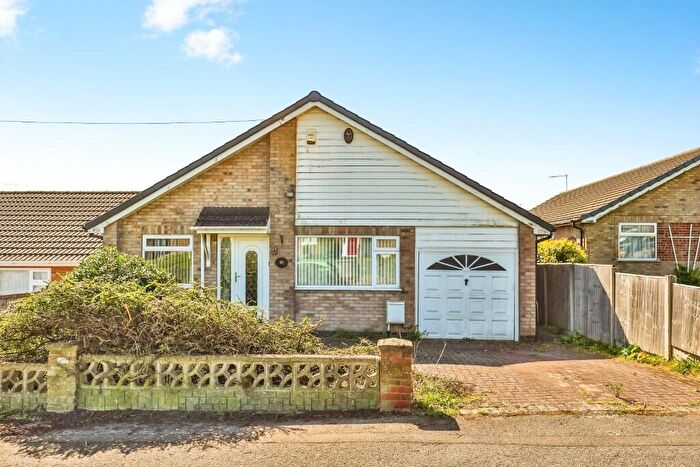
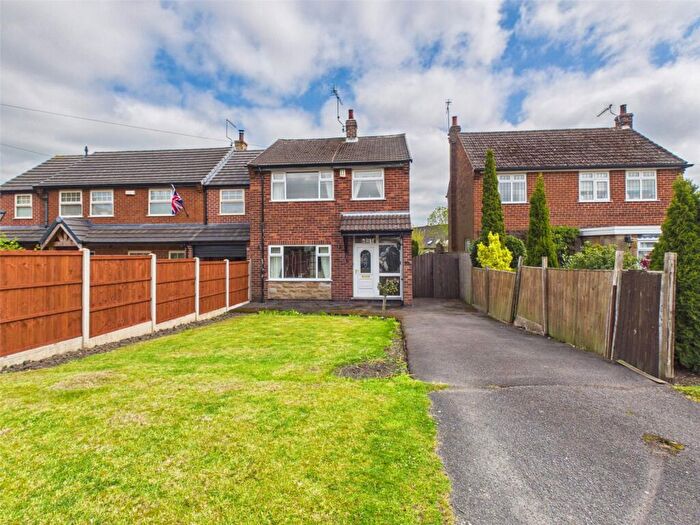
Properties for sale in Codnor And Waingroves
![]()
If you are looking to sell your house, let it out, or receive a property valuation, an expert can help you.
Click the button below to get started.


Roads and Postcodes in Codnor And Waingroves
Navigate through our locations to find the location of your next house in Codnor And Waingroves, Ripley for sale or to rent.
| Streets | Postcodes |
|---|---|
| Alfreton Road | DE5 9QY DE5 9QZ |
| Brierley Court | DE5 9TX |
| Brierley Road | DE5 9TS |
| Britannia Avenue | DE5 9TW |
| Brookfield Close | DE5 9PP |
| Brookvale Avenue | DE5 9QL |
| Broughton Close | DE5 9AE |
| Church Street | DE5 9TE DE5 9TF |
| Codnor Denby Lane | DE5 9SN DE5 9SP |
| Codnor Gate | DE5 9QW |
| Colin Avenue | DE5 9QQ |
| Colliers Court | DE5 9AN |
| Coupe Street | DE5 3QD |
| Cross Hill | DE5 9SQ |
| Cross Lane | DE5 9RZ |
| Crosshill | DE5 9SR |
| Dalby Green Close | DE5 9TY |
| Daykins Row | DE5 9RJ |
| Denby Lane | DE5 9TQ |
| Field Street | DE5 9RS DE5 9SA |
| Gate Brook Close | DE5 9RD |
| Glass House Hill | DE5 9QS DE5 9QT |
| Goose Lane | DE5 9RG |
| Grove Court | DE5 9TA |
| Hardy Crescent | DE5 9QH |
| Heanor Road | DE5 9SF DE5 9SH |
| High Holborn Road | DE5 3NT DE5 3NW |
| High Street | DE5 9QB |
| Highfields | DE5 9SB |
| Hill Crest Drive | DE5 9QR |
| Holborn View | DE5 9RB DE5 9RF |
| Hollywell Avenue | DE5 9SG |
| Jessop Lodge | DE5 9SW |
| Jessop Street | DE5 9RN DE5 9RP DE5 9TL |
| Lyndale Drive | DE5 9QJ |
| Market Place | DE5 9QA DE5 9RE |
| Meadow Avenue | DE5 9QN |
| Middleton Avenue | DE5 9SS |
| Mill Lane | DE5 9PW DE5 9QF DE5 9QG |
| Millicent Court | DE5 9AD |
| Milner Avenue | DE5 9SD |
| Needham Street | DE5 9RR |
| Nottingham Road | DE5 9RH DE5 9RL DE5 9SY |
| Old Gate Close | DE5 9SX |
| Orchard Close | DE5 9TN |
| Orchard Grove | DE5 9AB |
| Pinewood Avenue | DE5 9RY |
| Pit Lane | DE5 9TG |
| Queen Street | DE5 9TJ |
| Queens View Drive | DE5 9TP |
| Redmoor Close | DE5 9SJ |
| Rutland Avenue | DE5 9TR |
| Smith Avenue | DE5 9RA |
| Springhill Way | DE5 9PN |
| Station Lane | DE5 9SL |
| Stirland Street | DE5 9QU |
| The Orchard | DE5 9SE |
| Thomson Drive | DE5 9RT DE5 9RU |
| Thomson Walk | DE5 9ST |
| Waingroves Road | DE5 9TB DE5 9TD |
| West Hill | DE5 9RW DE5 9RX |
| White Gates | DE5 9QD |
| Windmill Close | DE5 9TU |
| Wood Street | DE5 9QP |
| Wright Street | DE5 9RQ |
Transport near Codnor And Waingroves

- FAQ
- Price Paid By Year
- Property Type Price
Frequently asked questions about Codnor And Waingroves
What is the average price for a property for sale in Codnor And Waingroves?
The average price for a property for sale in Codnor And Waingroves is £190,587. This amount is 9% lower than the average price in Ripley. There are 808 property listings for sale in Codnor And Waingroves.
What streets have the most expensive properties for sale in Codnor And Waingroves?
The streets with the most expensive properties for sale in Codnor And Waingroves are Crosshill at an average of £460,000, Heanor Road at an average of £307,611 and Cross Hill at an average of £282,500.
What streets have the most affordable properties for sale in Codnor And Waingroves?
The streets with the most affordable properties for sale in Codnor And Waingroves are Market Place at an average of £78,000, The Orchard at an average of £115,000 and White Gates at an average of £127,225.
Which train stations are available in or near Codnor And Waingroves?
Some of the train stations available in or near Codnor And Waingroves are Langley Mill, Alfreton and Ambergate.
Property Price Paid in Codnor And Waingroves by Year
The average sold property price by year was:
| Year | Average Sold Price | Price Change |
Sold Properties
|
|---|---|---|---|
| 2026 | £156,750 | -22% |
4 Properties |
| 2025 | £191,692 | 2% |
69 Properties |
| 2024 | £187,764 | -4% |
82 Properties |
| 2023 | £196,072 | -5% |
53 Properties |
| 2022 | £206,383 | 8% |
83 Properties |
| 2021 | £188,982 | 15% |
103 Properties |
| 2020 | £161,571 | 2% |
64 Properties |
| 2019 | £158,954 | -6% |
84 Properties |
| 2018 | £168,833 | 8% |
94 Properties |
| 2017 | £156,080 | 2% |
95 Properties |
| 2016 | £152,875 | 8% |
105 Properties |
| 2015 | £141,278 | 10% |
80 Properties |
| 2014 | £127,542 | 4% |
92 Properties |
| 2013 | £122,193 | 10% |
69 Properties |
| 2012 | £110,053 | -3% |
41 Properties |
| 2011 | £113,246 | -6% |
49 Properties |
| 2010 | £120,310 | 3% |
60 Properties |
| 2009 | £116,194 | -9% |
46 Properties |
| 2008 | £126,904 | -5% |
55 Properties |
| 2007 | £132,638 | 10% |
81 Properties |
| 2006 | £119,810 | 5% |
109 Properties |
| 2005 | £113,434 | 6% |
75 Properties |
| 2004 | £106,884 | 20% |
111 Properties |
| 2003 | £85,944 | 22% |
77 Properties |
| 2002 | £67,072 | 18% |
97 Properties |
| 2001 | £54,869 | 8% |
95 Properties |
| 2000 | £50,745 | 9% |
89 Properties |
| 1999 | £46,124 | 2% |
94 Properties |
| 1998 | £45,199 | 9% |
79 Properties |
| 1997 | £41,057 | 5% |
84 Properties |
| 1996 | £38,812 | -2% |
74 Properties |
| 1995 | £39,717 | - |
70 Properties |
Property Price per Property Type in Codnor And Waingroves
Here you can find historic sold price data in order to help with your property search.
The average Property Paid Price for specific property types in the last three years are:
| Property Type | Average Sold Price | Sold Properties |
|---|---|---|
| Semi Detached House | £182,645.00 | 87 Semi Detached Houses |
| Detached House | £284,322.00 | 51 Detached Houses |
| Terraced House | £132,167.00 | 70 Terraced Houses |