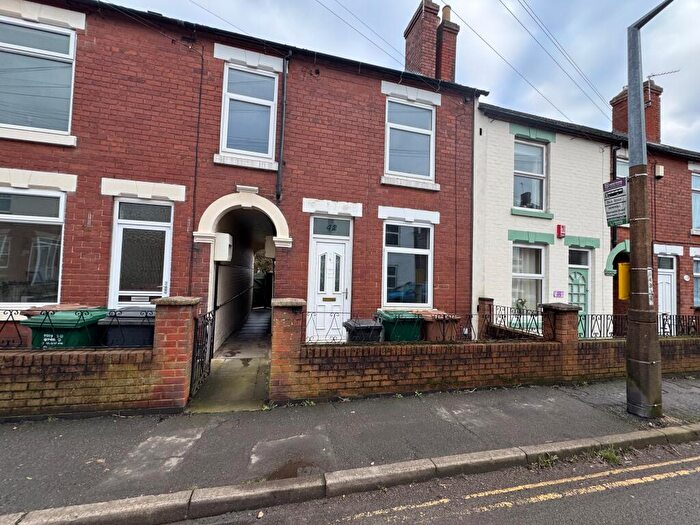
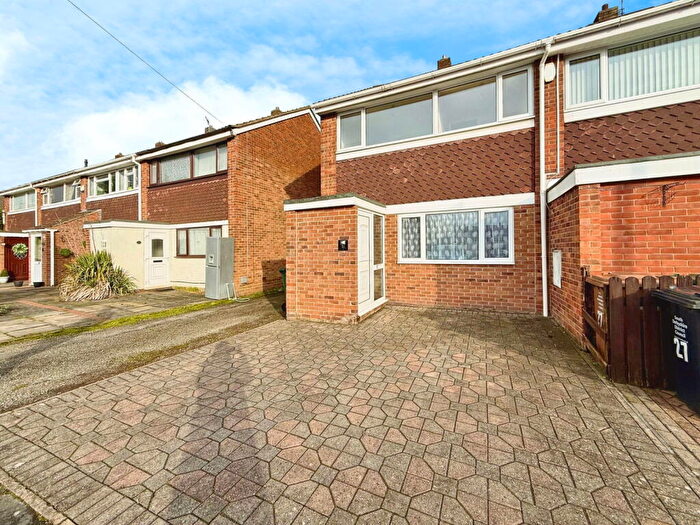
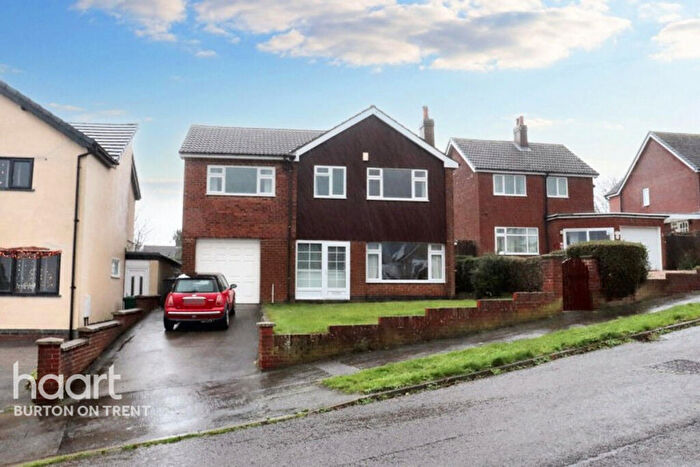
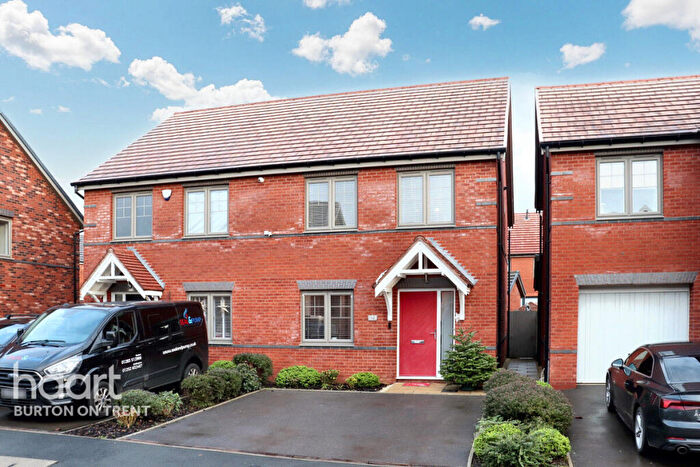
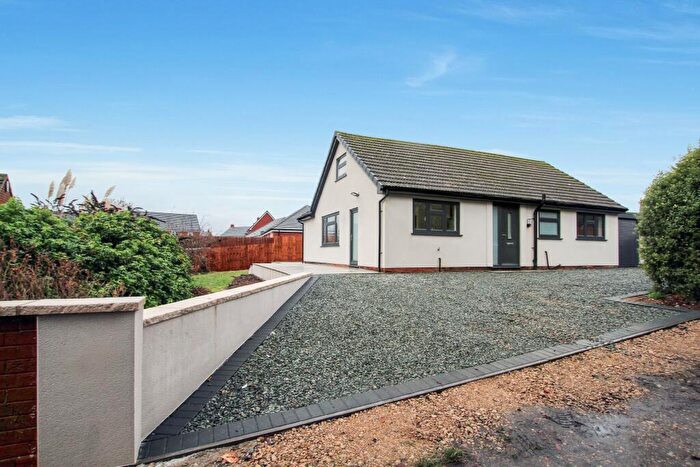
Houses for sale & to rent in Newhall And Stanton, Swadlincote
House Prices in Newhall And Stanton
Properties in Newhall And Stanton have an average house price of £190,968.00 and had 283 Property Transactions within the last 3 years¹.
Newhall And Stanton is an area in Swadlincote, Derbyshire with 3,326 households², where the most expensive property was sold for £499,950.00.
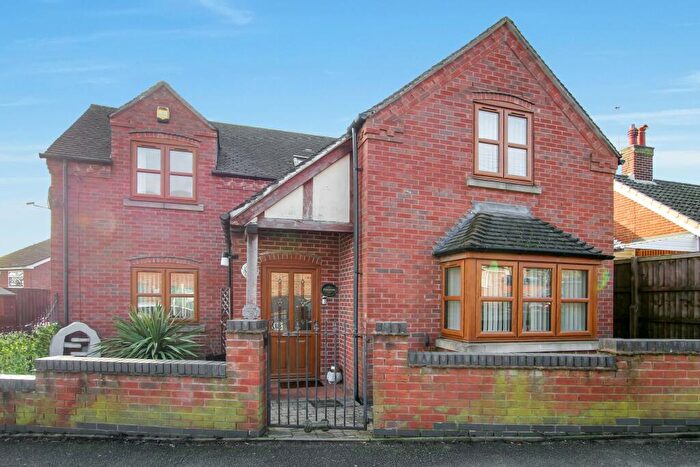
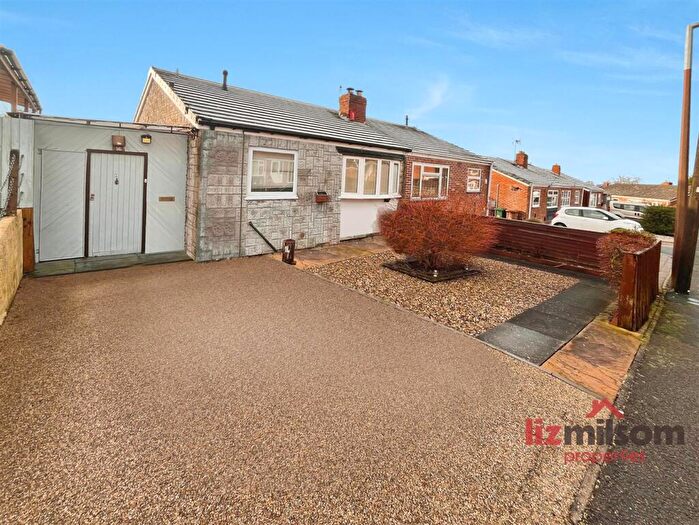
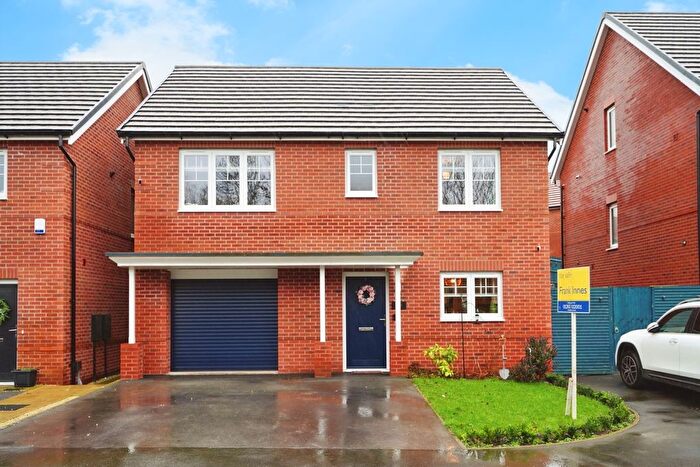
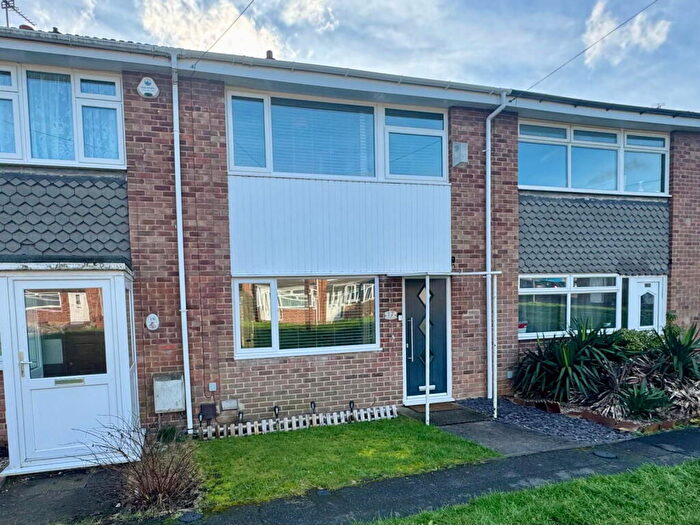
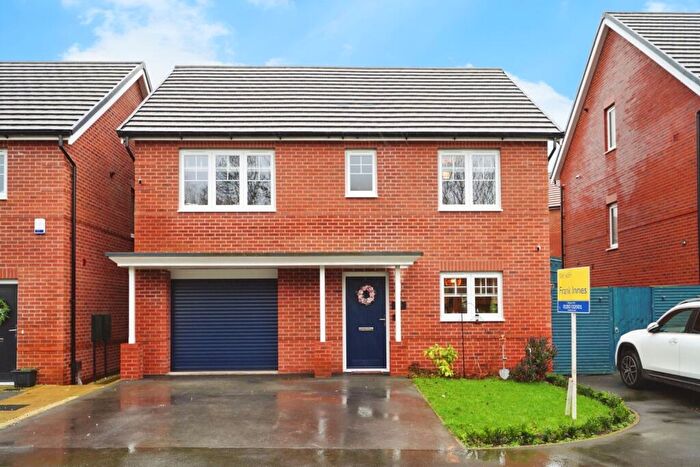
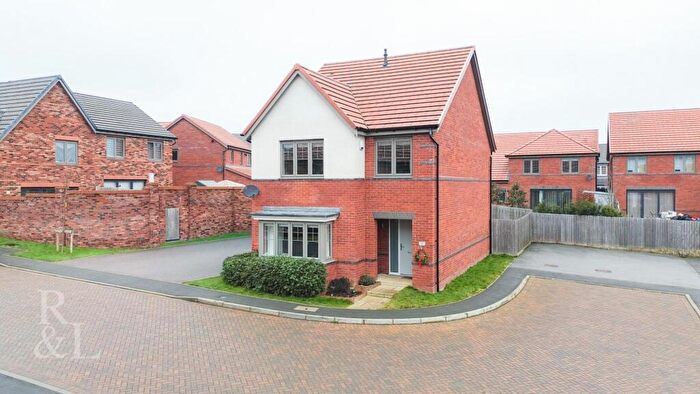
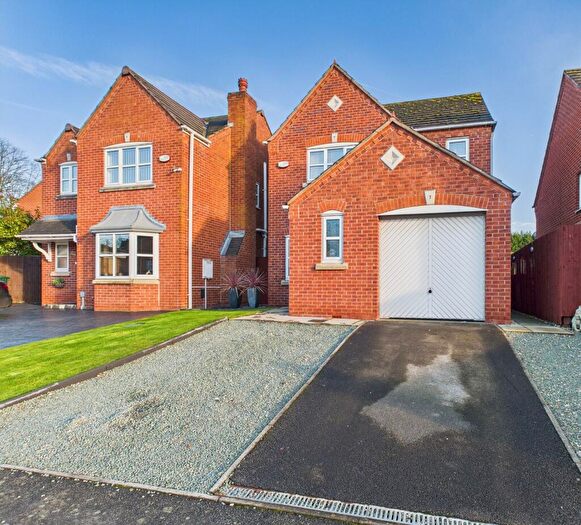
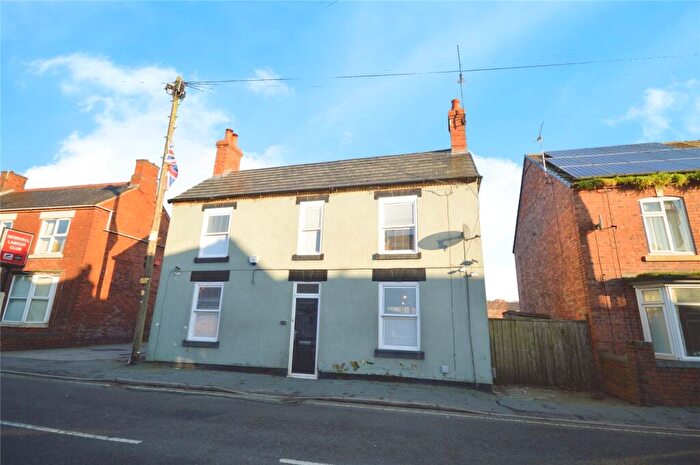
Properties for sale in Newhall And Stanton
Roads and Postcodes in Newhall And Stanton
Navigate through our locations to find the location of your next house in Newhall And Stanton, Swadlincote for sale or to rent.
| Streets | Postcodes |
|---|---|
| Alma Gardens | DE11 0WA |
| Alma Road | DE11 0SD |
| Almond Grove | DE11 0RD |
| Amber Place | DE11 0XT |
| Amberwood | DE11 0QQ |
| Appleton Close | DE11 0QU |
| Arthur Rice Close | DE11 0FQ |
| Ashleigh Avenue | DE11 0SE |
| Ashover Road | DE11 0YQ |
| Ashtree Close | DE11 0NS |
| Aspen Way | DE11 0GP |
| Bakewell Green | DE11 0TE |
| Baslow Green | DE11 0YH |
| Beech Grove | DE11 0NH |
| Beryl Close | DE11 0YG |
| Birch Avenue | DE11 0NG DE11 0NQ |
| Blossom Rise | DE11 0FR |
| Bodell Close | DE11 0FT |
| Brailsford Avenue | DE11 0TA |
| Bramblewood | DE11 0TQ |
| Bretby Heights | DE11 0BS |
| Bretby Hollow | DE11 0UE |
| Bretby Road | DE11 0LH DE11 0LJ DE11 0LL |
| Briar Close | DE11 0RX |
| Brook Street | DE11 0TS |
| Cadley Hill Road | DE11 9GE DE11 9GF |
| Cecil Road | DE11 0SA |
| Cedar Grove | DE11 0NF |
| Chapel Street | DE11 0JU |
| Cherry Tree Close | DE11 0JT |
| Chesterfield Avenue | DE11 0TR |
| Chrysanthemum Court | DE11 0RG |
| Church Road | DE11 0HZ |
| Church Street | DE11 0HY |
| Cobalt Lane | DE11 0FW |
| Colliers Close | DE11 0FD |
| Copperas Road | DE11 0UH |
| Coral Lane | DE11 0XU |
| Crich Way | DE11 0UU |
| Crown Court | DE11 0WX |
| Dales Close | DE11 0NY |
| Dalston Road | DE11 0QG |
| Elder Close | DE11 0GR |
| Emerald Gardens | DE11 0FZ |
| Fairfield Crescent | DE11 0SX DE11 0TB |
| Farm Side | DE11 0RP |
| Field Way | DE11 0RR |
| Grange Road | DE11 0SZ |
| Hawthorn Rise | DE11 0NN |
| Hazel Close | DE11 0RF |
| Higgins Road | DE11 0JY |
| High Street | DE11 0EA DE11 0HR DE11 0HT DE11 0HU DE11 0HX |
| Hill Street | DE11 0JR |
| Holly Bank Close | DE11 0ND |
| Honeysuckle Close | DE11 0QH |
| Horse Chestnut Close | DE11 0GX |
| Howden Close | DE11 0RE |
| Jade Close | DE11 0XR |
| John Street | DE11 0SR |
| Kay Drive | DE11 0RJ |
| Kilburn Way | DE11 0QY |
| Kinder Avenue | DE11 0RQ |
| Laburnum Road | DE11 0NR |
| Ladyfields Way | DE11 0RH |
| Larch Road | DE11 0NP |
| Leonard Gardens | DE11 0WQ |
| Leys Court | DE11 0UJ |
| Limestone Close | DE11 0XQ |
| Main Street | DE11 0TP DE11 0TW |
| Manton Close | DE11 0RA |
| Marble Drive | DE11 0YJ |
| Mayfair | DE11 0UB |
| Maypole Hill | DE11 0JP |
| Meadow Lane | DE11 0QP DE11 0QR DE11 0QW DE11 0UT DE11 0UW DE11 0FB |
| Meadow View Road | DE11 0UL |
| Meadow Way | DE11 0QS |
| Moonstone Way | DE11 0WZ |
| New Road | DE11 0SP DE11 0TH |
| Oakleigh Avenue | DE11 0SF |
| Opal Gardens | DE11 0XZ |
| Optimum Road | DE11 0WT |
| Orchard Street | DE11 0JS |
| Oversetts Court | DE11 0SH |
| Oversetts Road | DE11 0SJ DE11 0SL DE11 0SN DE11 0SW |
| Park Road | DE11 0TT DE11 0TU DE11 0TX |
| Park View | DE11 0UD |
| Parliament Street | DE11 0SG DE11 0SQ |
| Pear Tree Avenue | DE11 0LZ DE11 0NA DE11 0NB |
| Pearl Gardens | DE11 0YE |
| Peridot Close | DE11 0YF |
| Pine Grove | DE11 0SB |
| Pingle Farm Road | DE11 0QZ |
| Plummer Road | DE11 0QX |
| Potters Croft | DE11 0WD |
| Quartz Close | DE11 0XY |
| Rambler Close | DE11 0QL |
| Renshaw Drive | DE11 0RY |
| Robinson Road | DE11 0QT |
| Rose Tree Lane | DE11 0LN |
| Rose Valley | DE11 0QN |
| Roseleigh Crescent | DE11 0JX |
| South Drive | DE11 0RN DE11 0RW |
| St Catherines Road | DE11 0RZ |
| St Edwards Court | DE11 0TD |
| St Johns Drive | DE11 0ST DE11 0SU |
| Stoneydale Close | DE11 0UN |
| Sunnyside | DE11 0TJ DE11 0TN DE11 0TL |
| Sunnyside Court | DE11 0GY |
| Sunstone Drive | DE11 0YD |
| Swans Rest | DE11 0UY |
| Sycamore Avenue | DE11 0NJ |
| The Burrows | DE11 0RL |
| The Crescent | DE11 0SS |
| The Croft | DE11 0UA |
| The Fairway | DE11 0SY |
| The Gables | DE11 0TG |
| The Leys | DE11 0TY DE11 0TZ |
| The Paddocks | DE11 0UR |
| The Pastures | DE11 0US |
| The Rise | DE11 0RU |
| The Tramway | DE11 0PZ |
| Thorntree Lane | DE11 0LP DE11 0LW |
| Tideswell Green | DE11 0UX |
| Tilley Green | DE11 0UZ |
| Tom Mead Close | DE11 0WH |
| Walnut Close | DE11 0RB |
| Warren Hill | DE11 0PY |
| Watery Lane | DE11 0UF |
| Westwood Park | DE11 0RS DE11 0RT |
| Willow Drive | DE11 0NW |
| Winster Green | DE11 0NU |
| Wood Lane | DE11 0LX DE11 0LY |
| Woodview Road | DE11 0UG |
| Yew Tree Road | DE11 0NL |
| DE11 0YB |
Transport near Newhall And Stanton
- FAQ
- Price Paid By Year
- Property Type Price
Frequently asked questions about Newhall And Stanton
What is the average price for a property for sale in Newhall And Stanton?
The average price for a property for sale in Newhall And Stanton is £190,968. This amount is 13% lower than the average price in Swadlincote. There are 1,204 property listings for sale in Newhall And Stanton.
What streets have the most expensive properties for sale in Newhall And Stanton?
The streets with the most expensive properties for sale in Newhall And Stanton are Dalston Road at an average of £331,500, Bretby Hollow at an average of £317,983 and Bretby Heights at an average of £315,333.
What streets have the most affordable properties for sale in Newhall And Stanton?
The streets with the most affordable properties for sale in Newhall And Stanton are Field Way at an average of £123,000, Appleton Close at an average of £124,500 and Bretby Road at an average of £126,800.
Which train stations are available in or near Newhall And Stanton?
Some of the train stations available in or near Newhall And Stanton are Burton-On-Trent, Willington and Tutbury and Hatton.
Property Price Paid in Newhall And Stanton by Year
The average sold property price by year was:
| Year | Average Sold Price | Price Change |
Sold Properties
|
|---|---|---|---|
| 2025 | £194,408 | 0,1% |
88 Properties |
| 2024 | £194,229 | 6% |
110 Properties |
| 2023 | £183,188 | 2% |
85 Properties |
| 2022 | £179,076 | 10% |
97 Properties |
| 2021 | £162,043 | 3% |
119 Properties |
| 2020 | £157,647 | 4% |
109 Properties |
| 2019 | £151,172 | 6% |
125 Properties |
| 2018 | £142,817 | 3% |
119 Properties |
| 2017 | £138,595 | 6% |
143 Properties |
| 2016 | £130,515 | 2% |
125 Properties |
| 2015 | £128,403 | 3% |
110 Properties |
| 2014 | £124,151 | 13% |
106 Properties |
| 2013 | £108,208 | 3% |
118 Properties |
| 2012 | £104,999 | -5% |
66 Properties |
| 2011 | £109,866 | 2% |
84 Properties |
| 2010 | £108,007 | 2% |
62 Properties |
| 2009 | £105,395 | -13% |
66 Properties |
| 2008 | £119,364 | -4% |
88 Properties |
| 2007 | £124,106 | -2% |
183 Properties |
| 2006 | £126,649 | 8% |
171 Properties |
| 2005 | £116,130 | 3% |
138 Properties |
| 2004 | £112,858 | 21% |
189 Properties |
| 2003 | £89,567 | 20% |
169 Properties |
| 2002 | £71,355 | 16% |
218 Properties |
| 2001 | £59,858 | 10% |
208 Properties |
| 2000 | £54,018 | 13% |
199 Properties |
| 1999 | £46,815 | 16% |
146 Properties |
| 1998 | £39,177 | -4% |
140 Properties |
| 1997 | £40,638 | 9% |
90 Properties |
| 1996 | £37,002 | 9% |
110 Properties |
| 1995 | £33,582 | - |
75 Properties |
Property Price per Property Type in Newhall And Stanton
Here you can find historic sold price data in order to help with your property search.
The average Property Paid Price for specific property types in the last three years are:
| Property Type | Average Sold Price | Sold Properties |
|---|---|---|
| Semi Detached House | £180,660.00 | 139 Semi Detached Houses |
| Detached House | £257,010.00 | 79 Detached Houses |
| Terraced House | £132,746.00 | 65 Terraced Houses |

