
Houses for sale in EX21 5QW, Shebbear And Langtree, Beaworthy
House Prices in EX21 5QW, Shebbear And Langtree
Properties in EX21 5QW have no sales history available within the last 3 years. EX21 5QW is a postcode in Shebbear And Langtree, an area in Beaworthy, Devon, with 6 households².
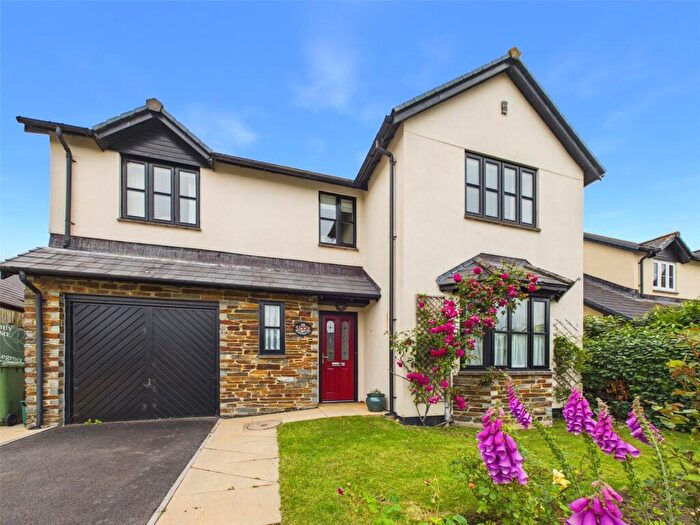
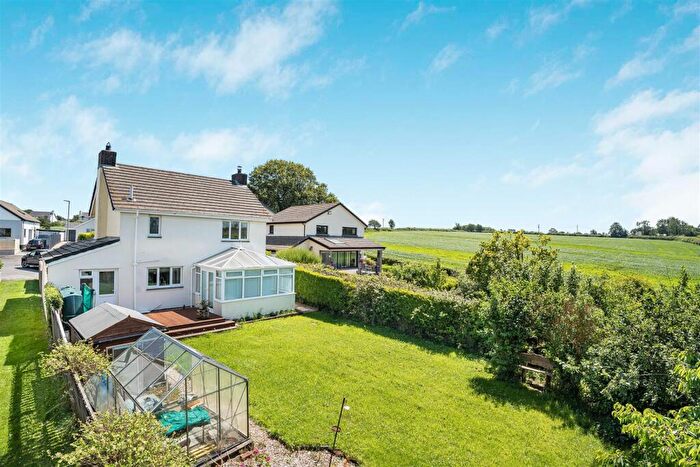
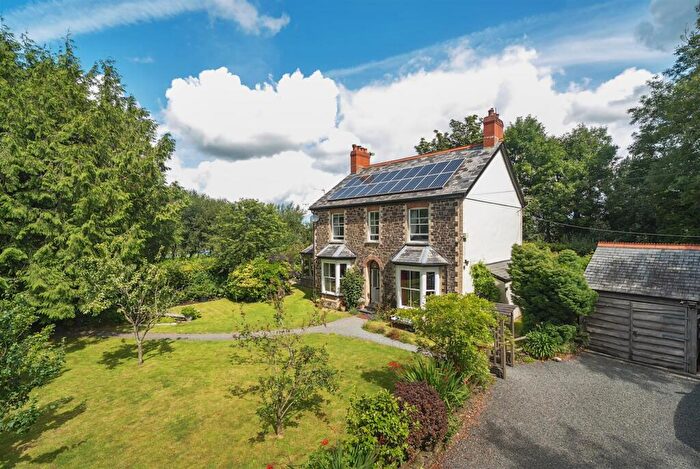
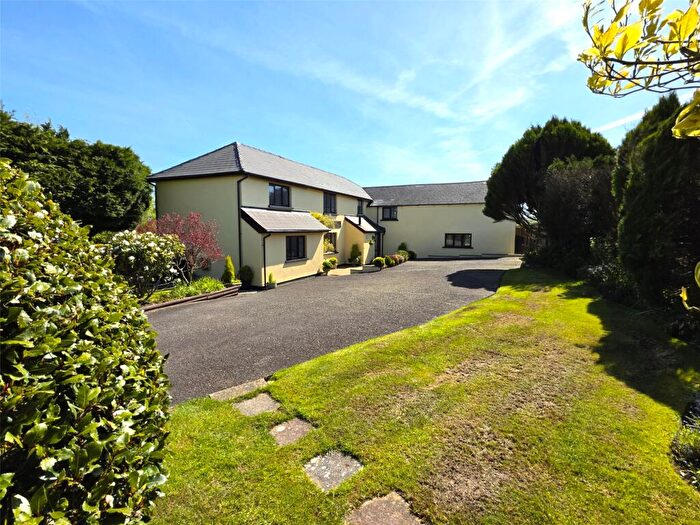
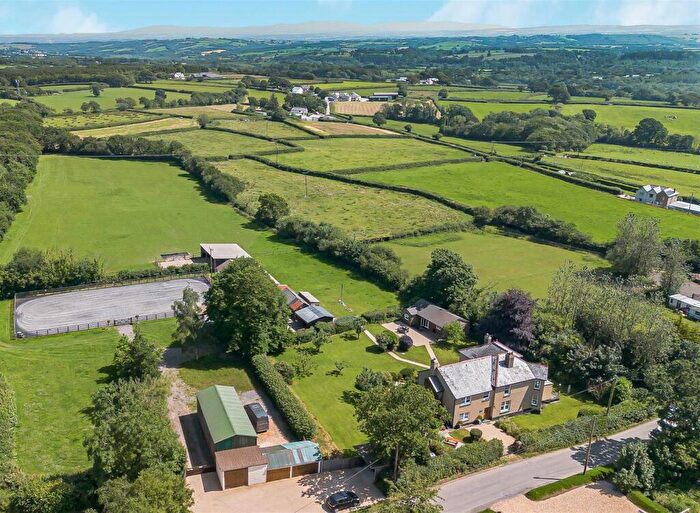
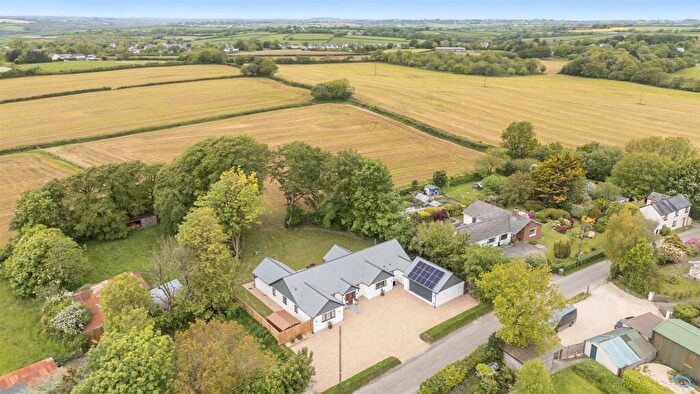
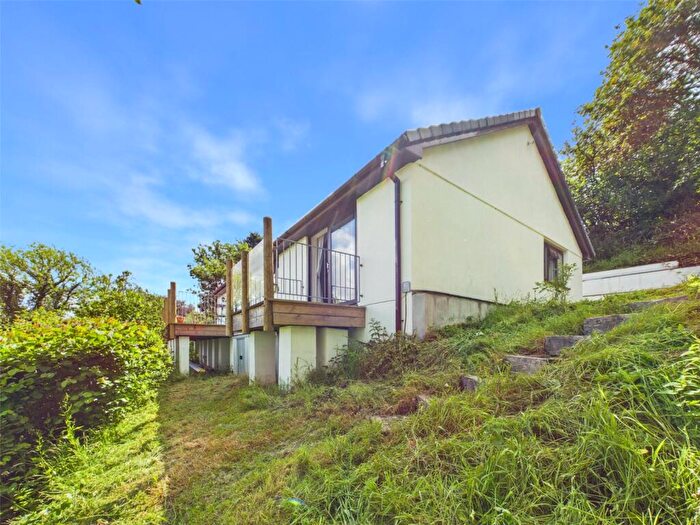
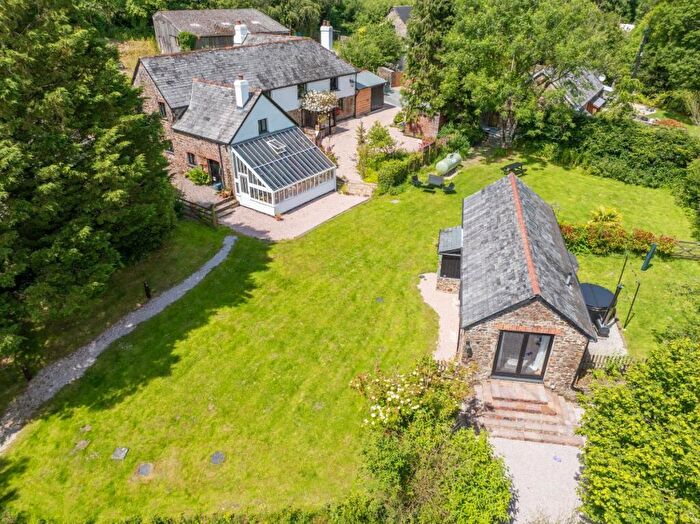
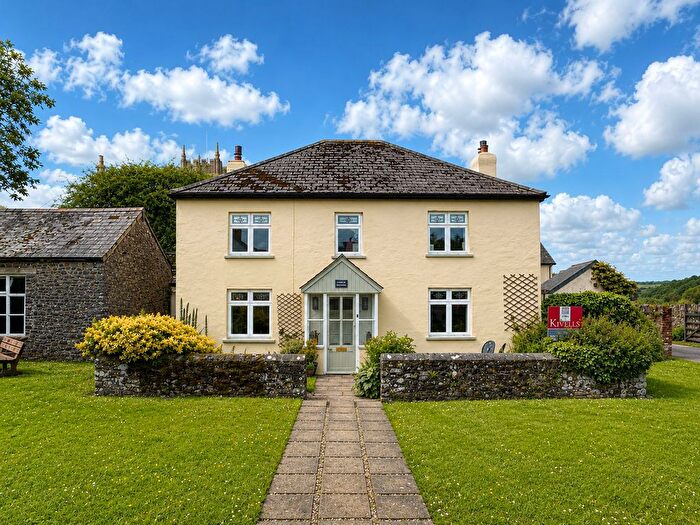
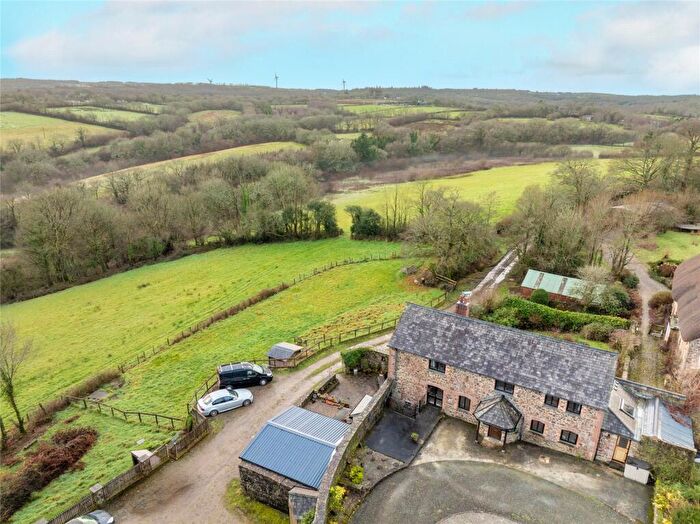
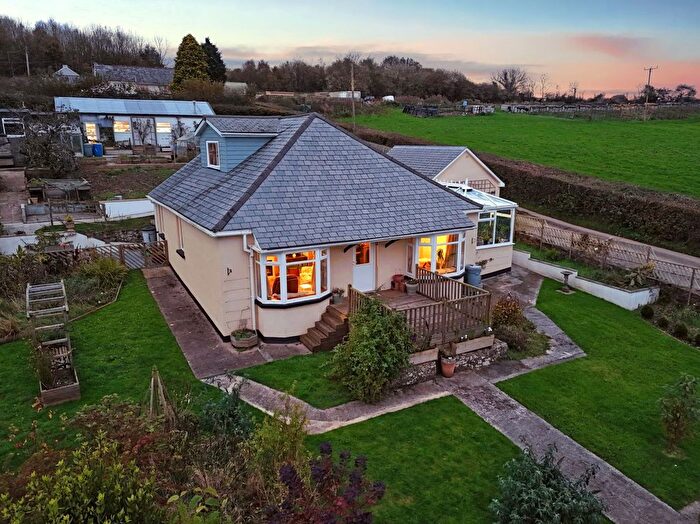
Properties for sale near EX21 5QW
![]()
If you are looking to sell your house, let it out, or receive a property valuation, an expert can help you.
Click the button below to get started.
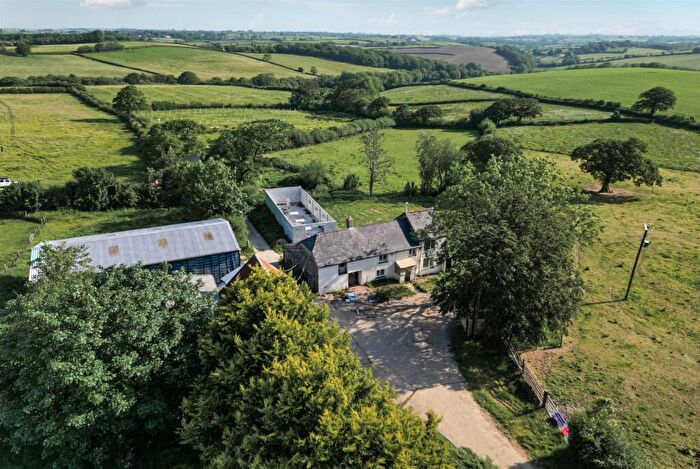
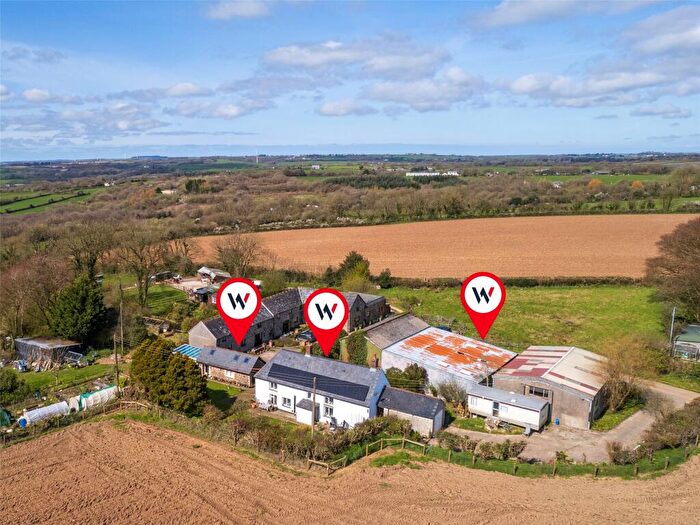
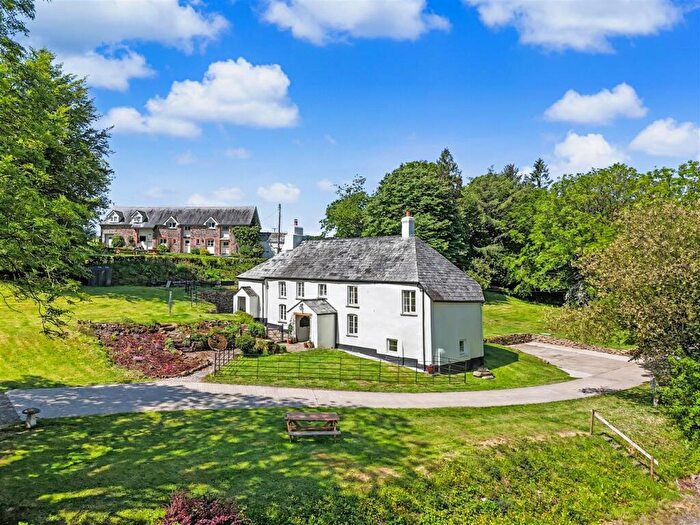
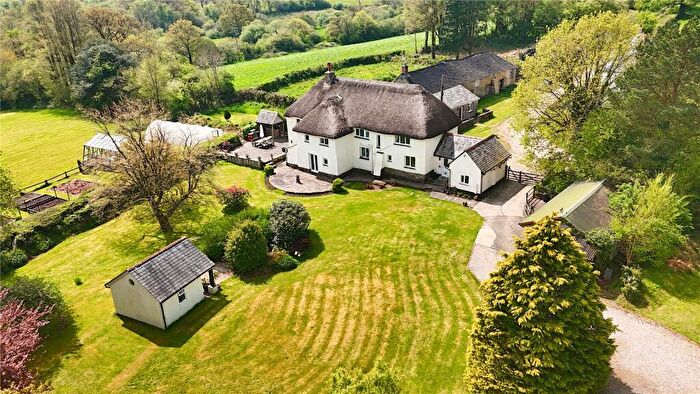
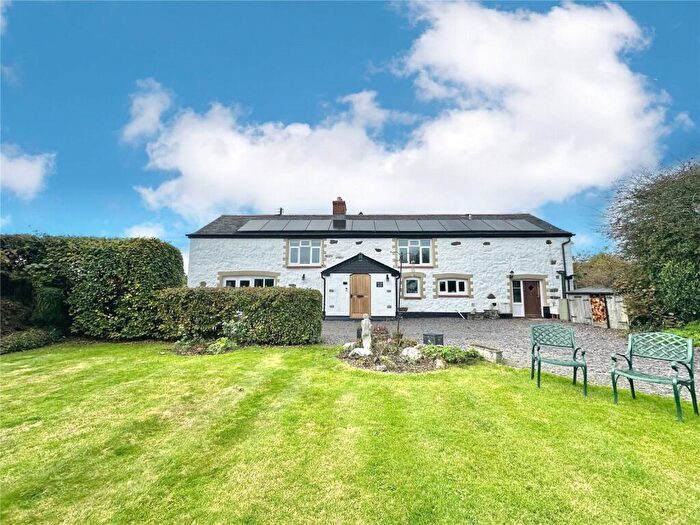
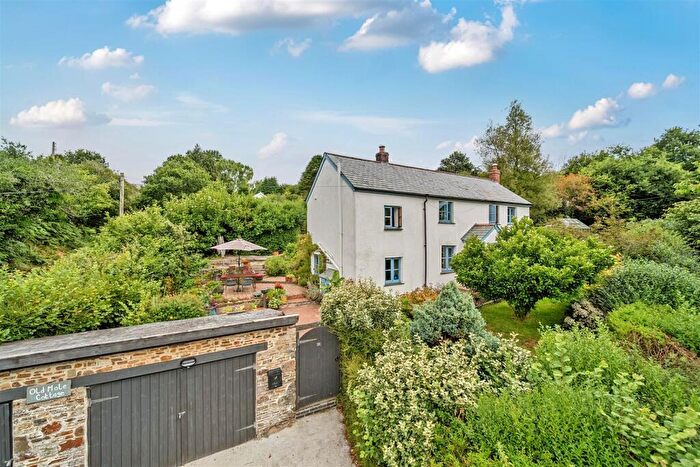
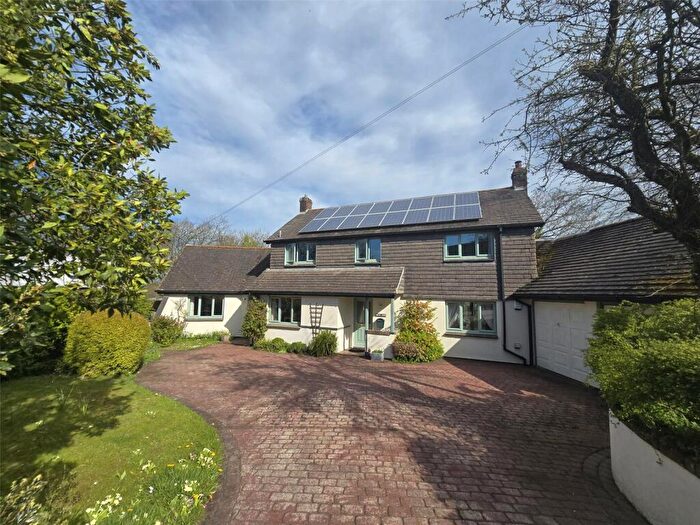
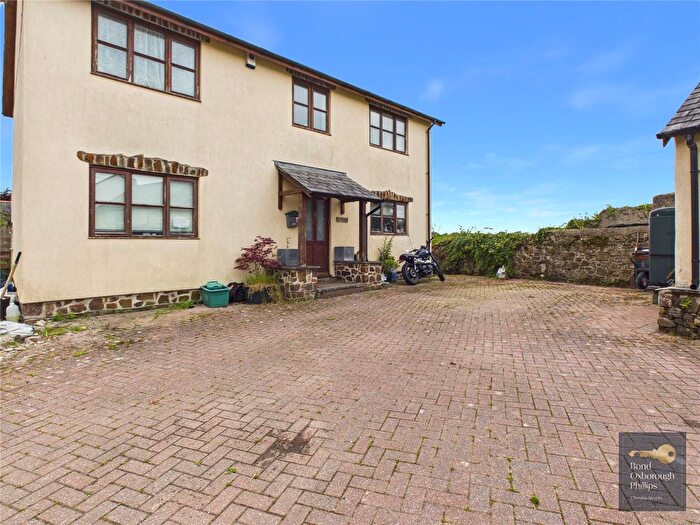
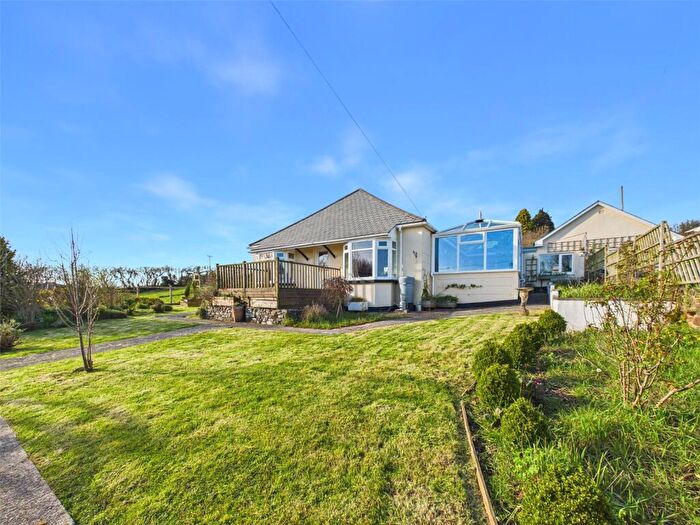
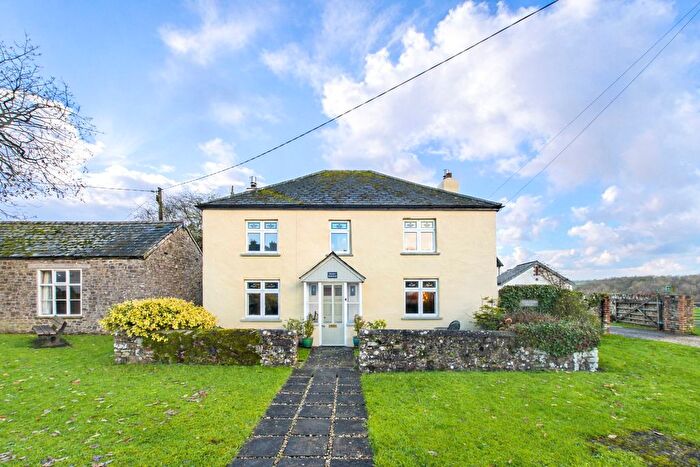
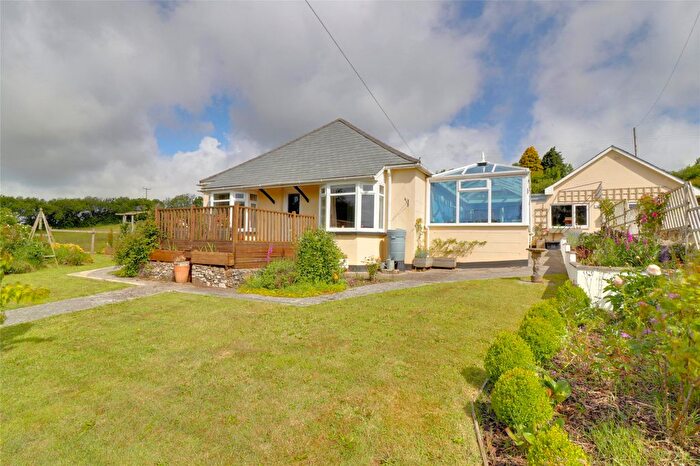
Previously listed properties near EX21 5QW
![]()
If you are looking to sell your house, let it out, or receive a property valuation, an expert can help you.
Click the button below to get started.

Price Paid in EX21 5QW, Shebbear And Langtree
WEST CROFT EX21 5QW, Shebbear And Langtree Beaworthy
Property WEST CROFT has been sold 4 times. The last time it was sold was in 05/09/2016 and the sold price was £262,000.00.
This detached house, sold as a freehold on 05/09/2016, is a 167 sqm detached house with an EPC rating of D.
| Date | Price | Property Type | Tenure | Classification |
|---|---|---|---|---|
| 05/09/2016 | £262,000.00 | Detached House | freehold | Established Building |
| 03/10/2012 | £265,000.00 | Detached House | freehold | Established Building |
| 11/12/2009 | £248,000.00 | Detached House | freehold | Established Building |
| 21/05/1999 | £47,500.00 | Detached House | freehold | Established Building |
DEER PARK EX21 5QW, Shebbear And Langtree Beaworthy
Property DEER PARK has been sold 1 time. The last time it was sold was in 27/02/2015 and the sold price was £245,000.00.
This is a Detached House which was sold as a freehold in 27/02/2015
| Date | Price | Property Type | Tenure | Classification |
|---|---|---|---|---|
| 27/02/2015 | £245,000.00 | Detached House | freehold | Established Building |
Property price trends in EX21 5QW
According to the latest Land Registry data, the average home in EX21 5QW sold for £262,000 in 2016. That figure comes from 5 sales logged over the past 17 years.
Prices have held fairly steady over the last three years. Compared with 2012, when the typical sale came in around £265,000, values are broadly unchanged.
Looking back five years, average prices are down about 1.1% since 2012, a drop of around £3,000 in cash terms.
Property Price Paid in EX21 5QW by Year
The average sold property price by year was:
| Year | Average Sold Price | Price Change |
Sold Properties
|
|---|---|---|---|
| 2016 | £262,000 | 6% |
1 Property |
| 2015 | £245,000 | -8% |
1 Property |
| 2012 | £265,000 | 6% |
1 Property |
| 2009 | £248,000 | 81% |
1 Property |
| 1999 | £47,500 | - |
1 Property |
