
Houses for sale in Shebbear And Langtree, Beaworthy
House Prices in Shebbear And Langtree
Properties in Shebbear And Langtree have an average house price of £350k and had 34 Property Transactions within the last 3 years¹.
Shebbear And Langtree is an area in Beaworthy, Devon with 364 households², where the most expensive property was sold for £813k.
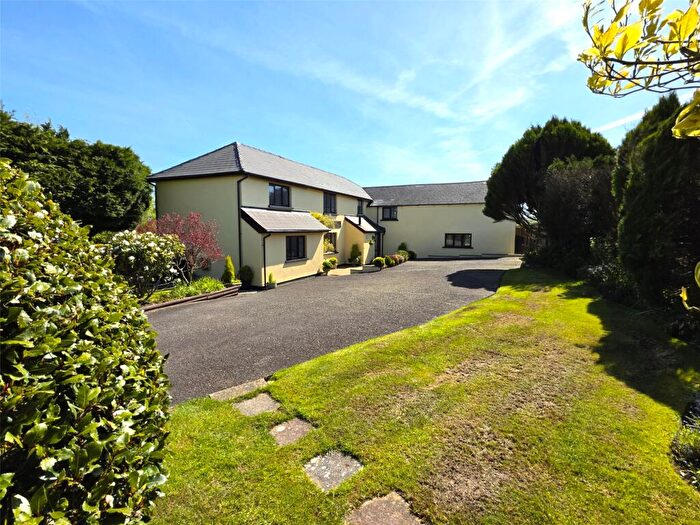
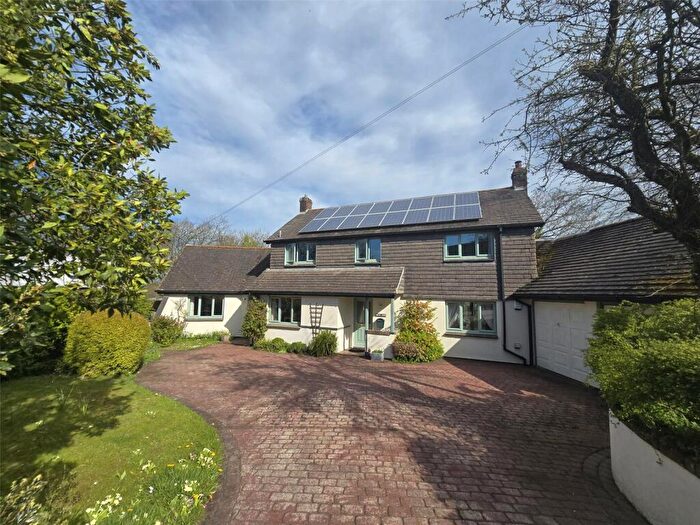
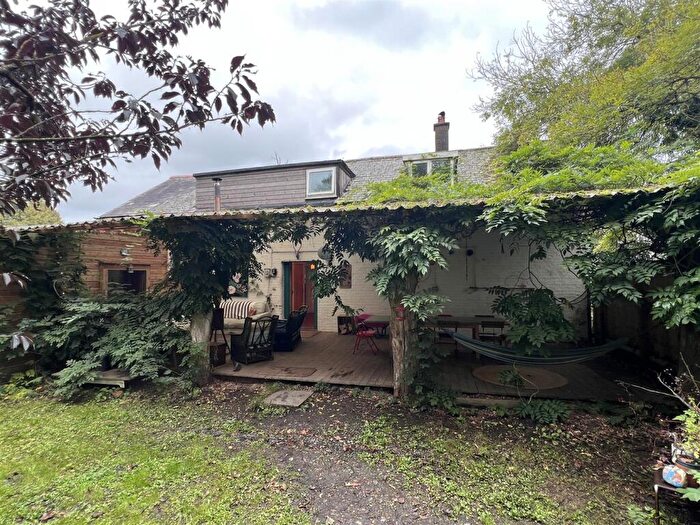
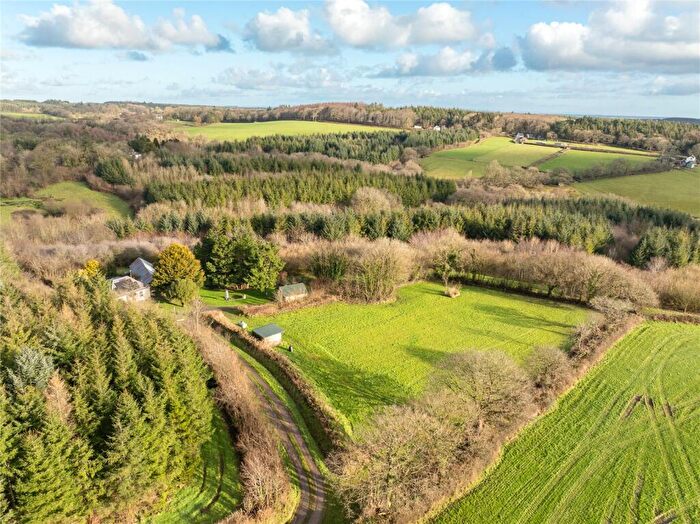
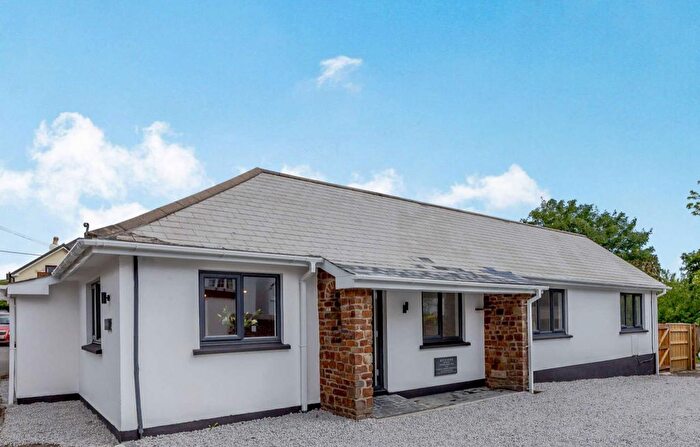
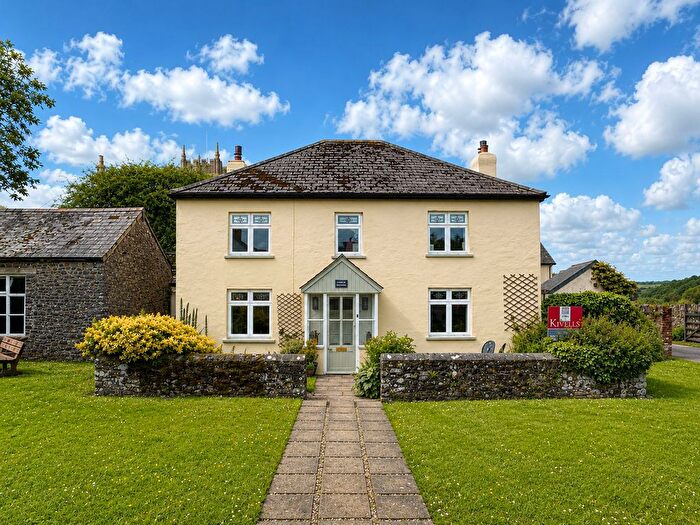
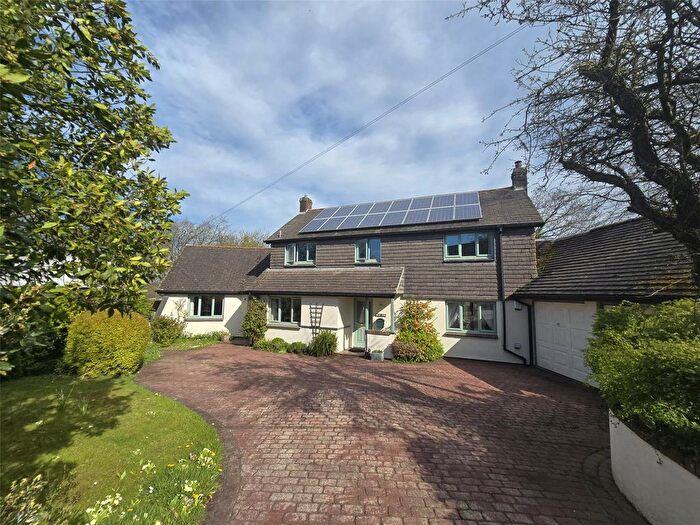
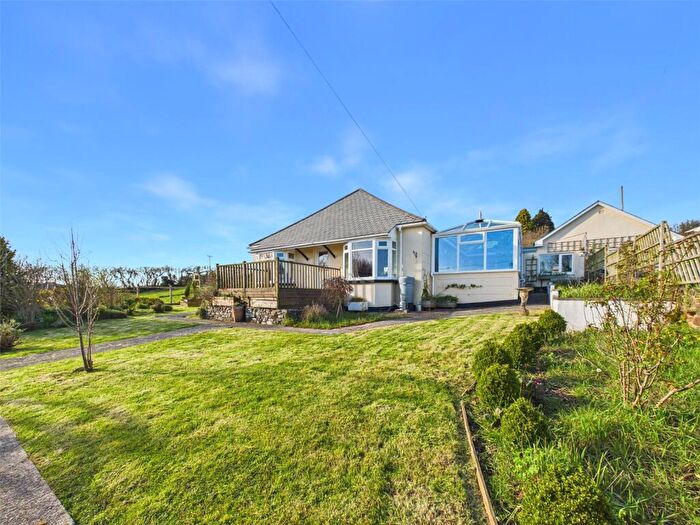
Properties for sale in Shebbear And Langtree
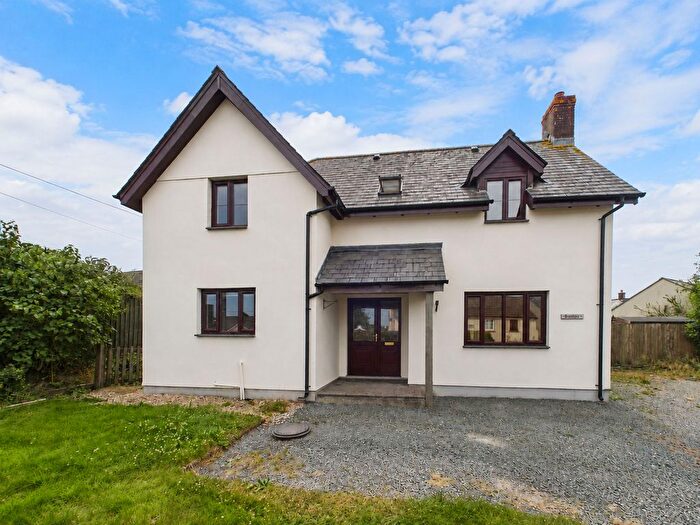
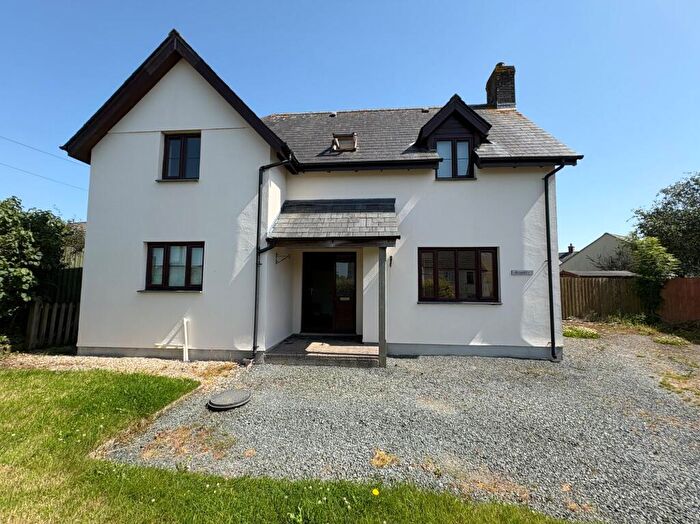
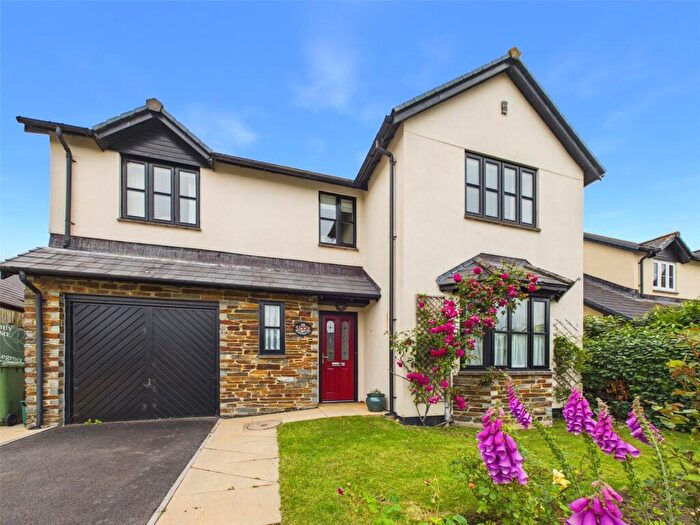
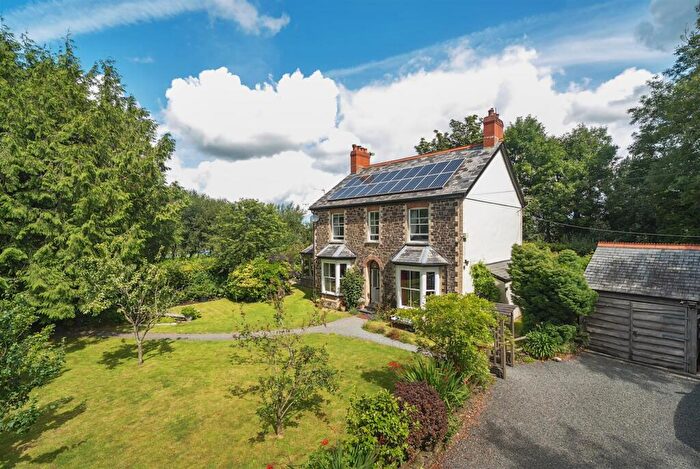
![]()
If you are looking to sell your house, let it out, or receive a property valuation, an expert can help you.
Click the button below to get started.
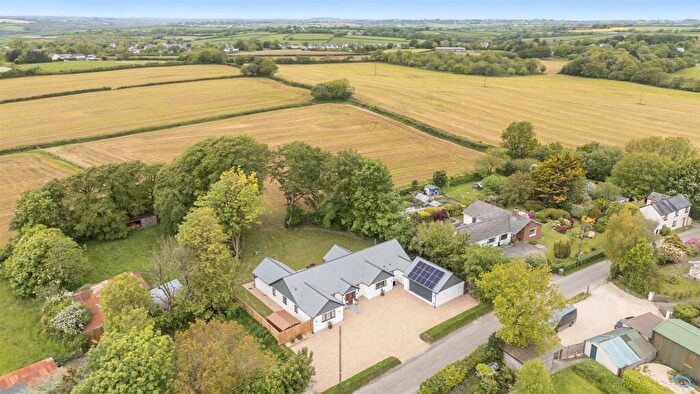
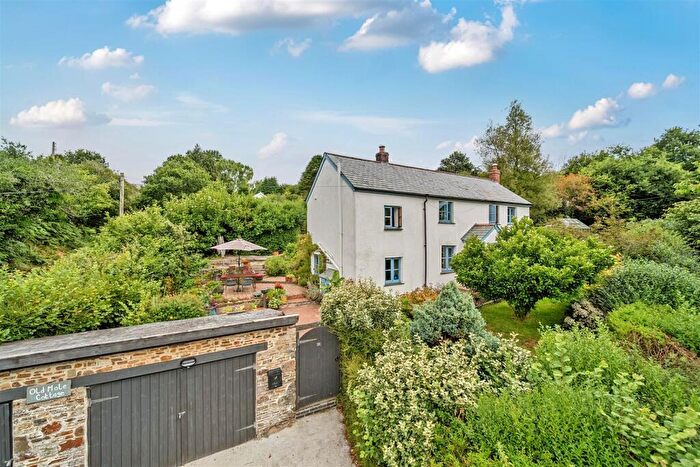
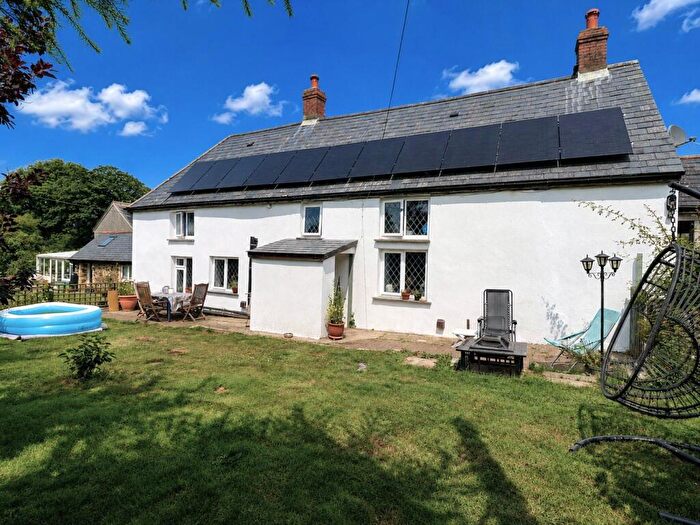
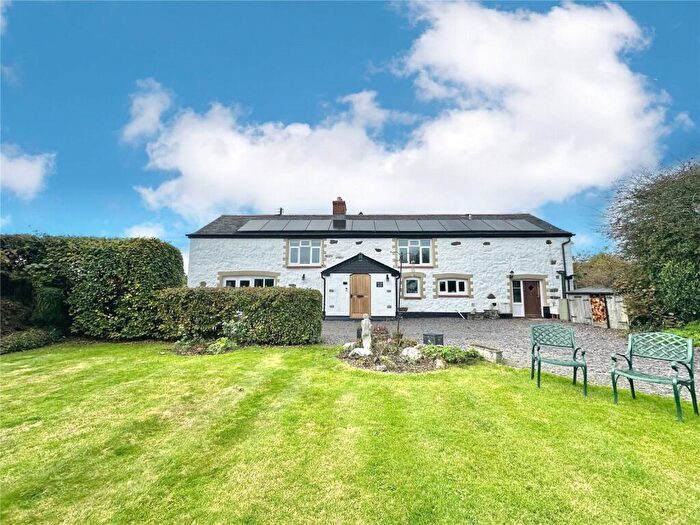
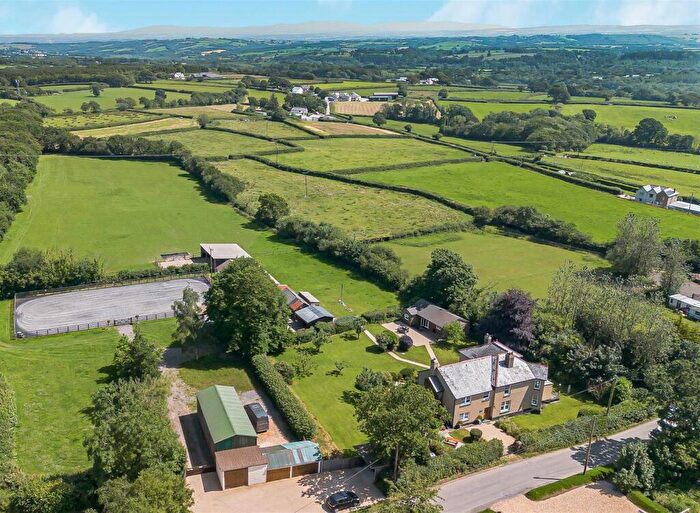
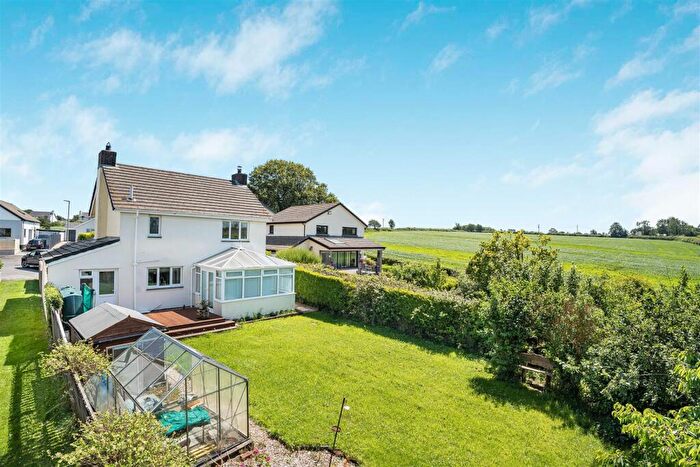
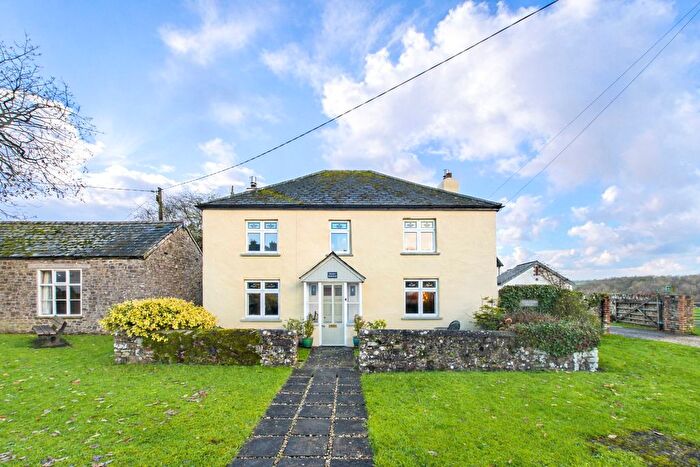
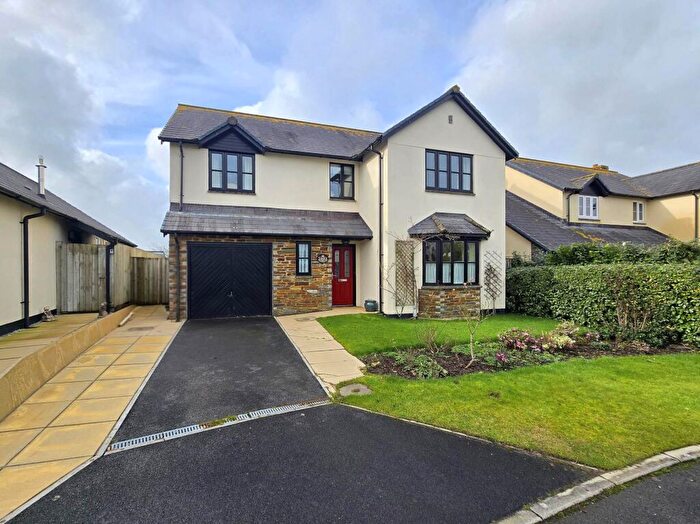
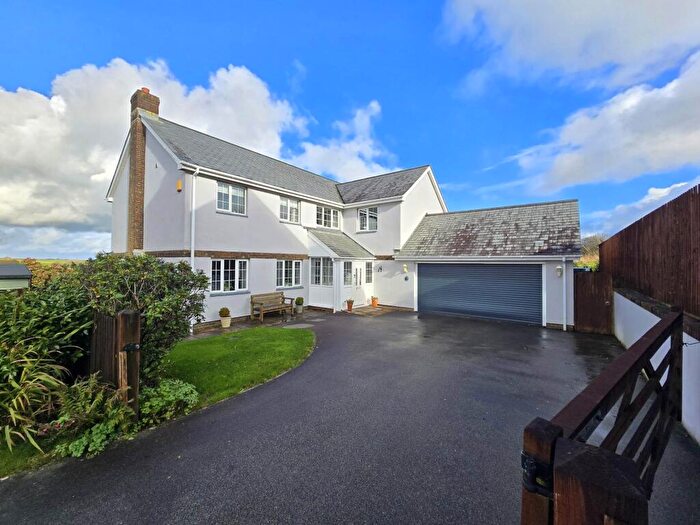
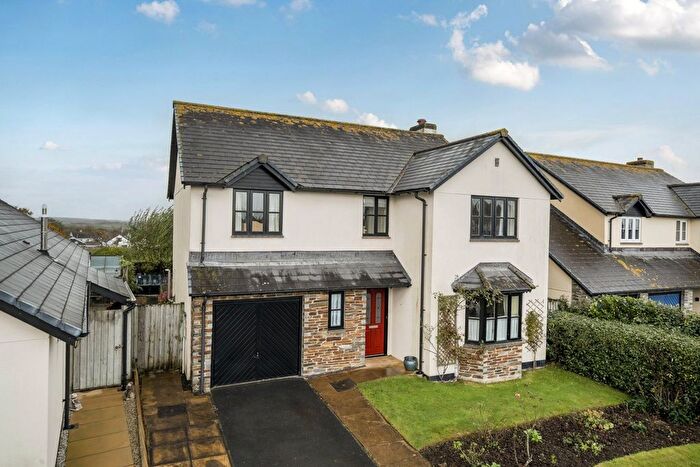
Previously listed properties in Shebbear And Langtree
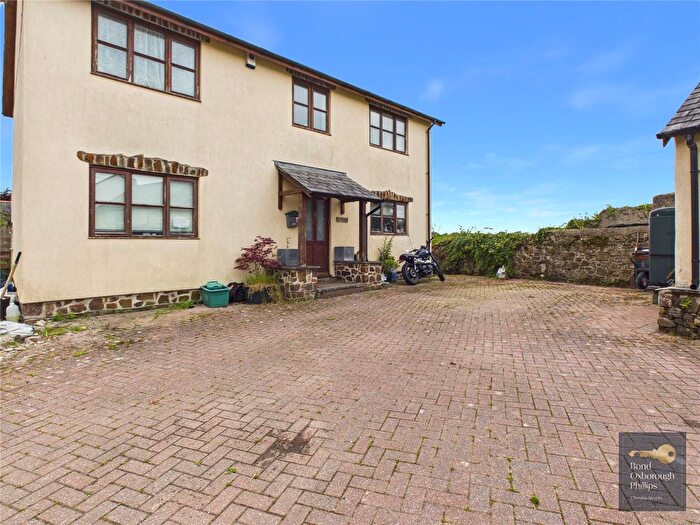
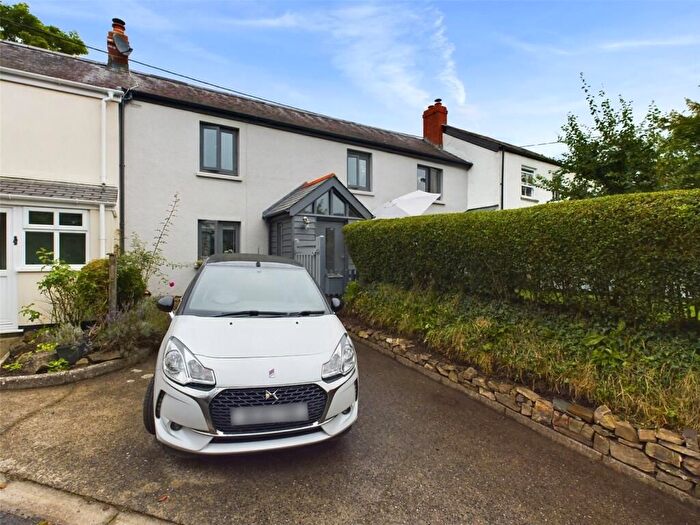
![]()
If you are looking to sell your house, let it out, or receive a property valuation, an expert can help you.
Click the button below to get started.
Roads and Postcodes in Shebbear And Langtree
Navigate through our locations to find the location of your next house in Shebbear And Langtree, Beaworthy for sale or to rent.
| Streets | Postcodes |
|---|---|
| Ackland Close | EX21 5AZ |
| Aish Park | EX21 5QL |
| Balkwill Cottages | EX21 5SB |
| Balleroy Close | EX21 5RT |
| Barn Close | EX21 5SD |
| College Road | EX21 5HH |
| Coronation Place | EX21 5SQ |
| Halwill Cottages | EX21 5SG |
| Holroyd Cottages | EX21 5SU |
| Meadow Park | EX21 5QJ |
| North View | EX21 5SF |
| Old Village Cottage | EX21 5RX |
| St Michaels View | EX21 5RS |
| EX21 5HN EX21 5HW EX21 5QN EX21 5QP EX21 5QR EX21 5QS EX21 5QT EX21 5QU EX21 5QW EX21 5QX EX21 5QY EX21 5QZ EX21 5RA EX21 5RB EX21 5RE EX21 5RF EX21 5RG EX21 5RH EX21 5RP EX21 5RR EX21 5RU EX21 5RY EX21 5RZ EX21 5SH EX21 5SJ EX21 5SL EX21 5SN EX21 5SR EX21 5SS EX21 5ST EX21 5SW EX21 5SX EX21 5SY EX21 5SZ EX21 5TD EX21 5TE |
Property price trends in Shebbear And Langtree
According to the latest Land Registry data, the average home in Shebbear And Langtree sold for £280,100 in 2025. That figure comes from 448 sales logged over the past 30 years.
Prices have fallen back over the last three years. Compared with 2022, when the typical sale came in around £596,388, that's a fall of roughly 53%.
Looking back five years, average prices are down about 4.8% since 2020, a drop of around £14,202 in cash terms.
Zoom out to the past decade for the fuller picture. Back in 2015, homes here averaged £276,000, so the typical sold price has climbed about 1.5% since then, roughly 0.1% a year. Stretch the view to fifteen years and that annual pace edges up closer to 1.7%.
Frequently asked questions about Shebbear And Langtree
What is the average price for a property for sale in Shebbear And Langtree?
The average price for a property for sale in Shebbear And Langtree is £349,529. This amount is 3% lower than the average price in Beaworthy. There are 206 property listings for sale in Shebbear And Langtree.
What streets have the most expensive properties for sale in Shebbear And Langtree?
The streets with the most expensive properties for sale in Shebbear And Langtree are Aish Park at an average of £463,333, Meadow Park at an average of £444,250 and Coronation Place at an average of £332,500.
What streets have the most affordable properties for sale in Shebbear And Langtree?
The streets with the most affordable properties for sale in Shebbear And Langtree are Balkwill Cottages at an average of £200,000, Barn Close at an average of £226,333 and Ackland Close at an average of £234,900.
Which train stations are available in or near Shebbear And Langtree?
Some of the train stations available in or near Shebbear And Langtree are Okehampton, Portsmouth Arms and Sampford Courtenay.
Property Price Paid in Shebbear And Langtree by Year
The average sold property price by year was:
| Year | Average Sold Price | Price Change |
Sold Properties
|
|---|---|---|---|
| 2025 | £280,100 | -45% |
15 Properties |
| 2024 | £406,500 | 1% |
11 Properties |
| 2023 | £401,375 | -49% |
8 Properties |
| 2022 | £596,388 | 32% |
9 Properties |
| 2021 | £406,680 | 28% |
25 Properties |
| 2020 | £294,302 | -7% |
18 Properties |
| 2019 | £314,552 | 15% |
19 Properties |
| 2018 | £267,187 | -23% |
16 Properties |
| 2017 | £329,388 | 18% |
9 Properties |
| 2016 | £270,027 | -2% |
18 Properties |
Property Price per Property Type in Shebbear And Langtree
Here you can find historic sold price data in order to help with your property search.
The average Property Paid Price for specific property types in the last three years are:
| Property Type | Average Sold Price | Sold Properties |
|---|---|---|
| Semi Detached House | £230,200.00 | 10 Semi Detached Houses |
| Detached House | £453,823.00 | 17 Detached Houses |
| Terraced House | £266,714.00 | 7 Terraced Houses |
