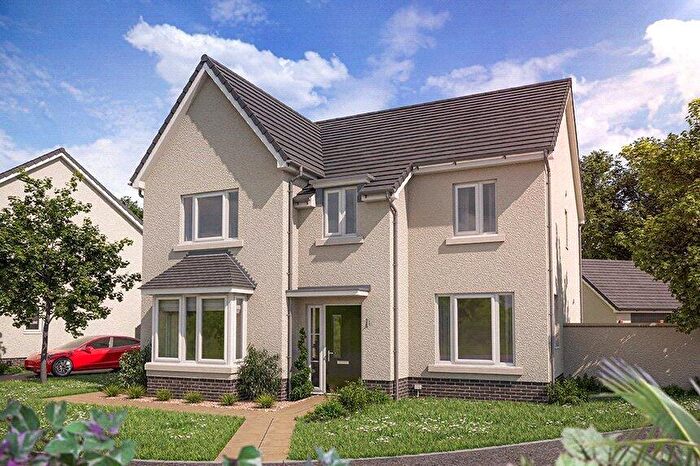
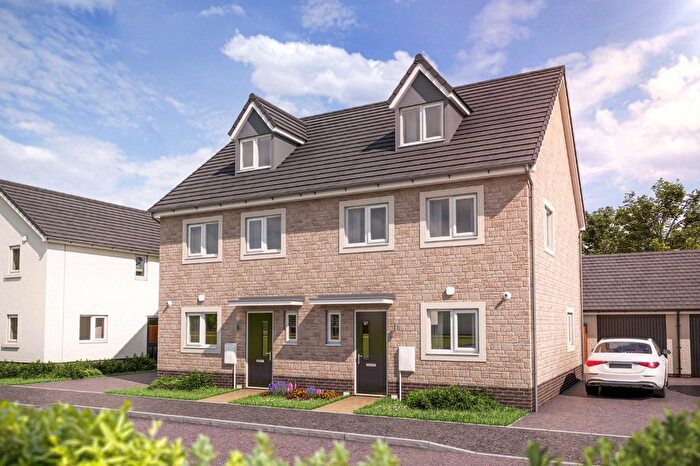
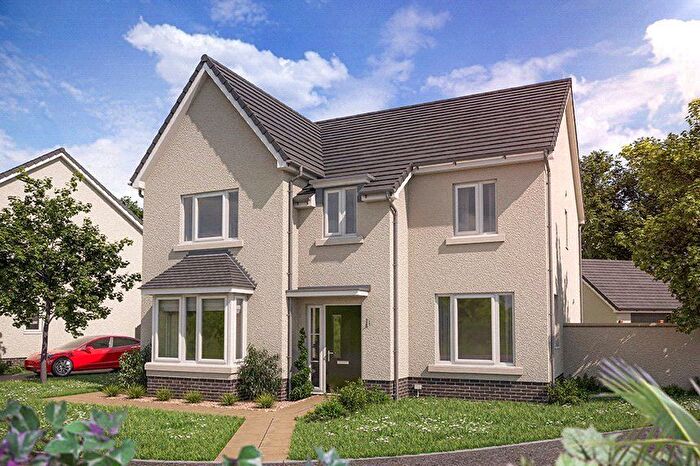
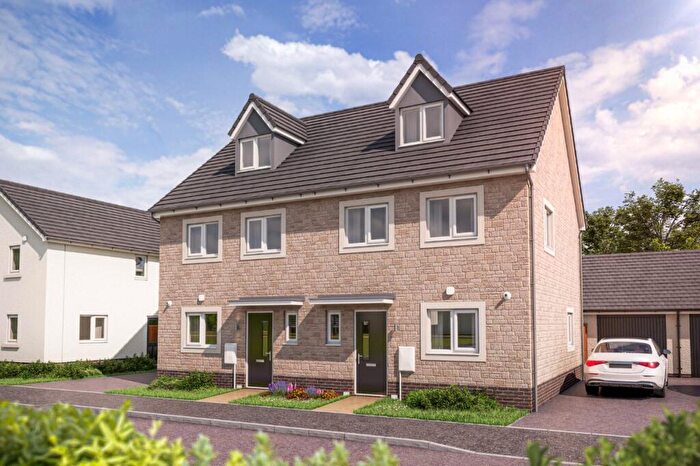
Houses for sale & to rent in Kenwith, Bideford
House Prices in Kenwith
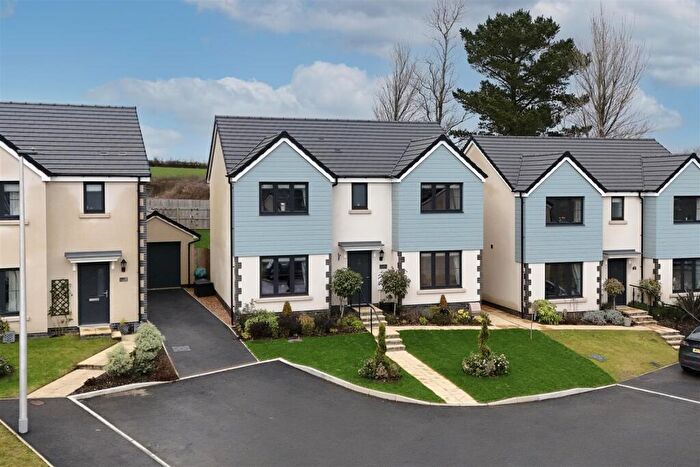
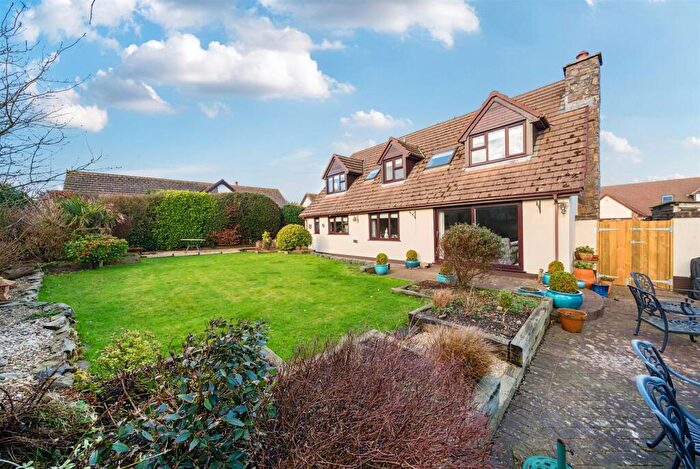
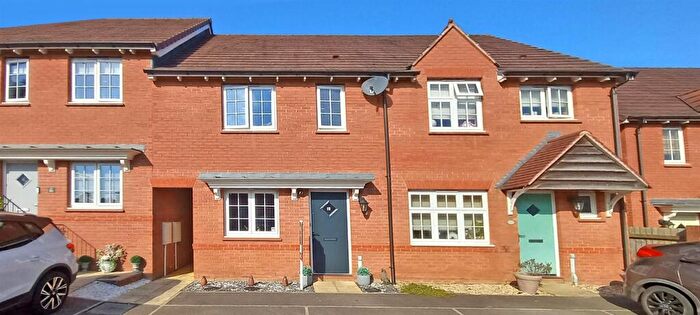
Properties in Kenwith have an average house price of £385,008.00 and had 52 Property Transactions within the last 3 years¹.
Kenwith is an area in Bideford, Devon with 635 households², where the most expensive property was sold for £1,235,000.00.
Properties for sale in Kenwith
Roads and Postcodes in Kenwith
Navigate through our locations to find the location of your next house in Kenwith, Bideford for sale or to rent.
| Streets | Postcodes |
|---|---|
| Acre Road | EX39 5EB |
| Arthurs Lea | EX39 5AN |
| Barton Close | EX39 5NZ |
| Barton Court | EX39 5RJ |
| Barton Mews | EX39 5RL |
| Bucks Mills | EX39 5DY |
| Chiddlescombe Cottages | EX39 5DE |
| Fairy Cross | EX39 5BU EX39 5BX EX39 5BY EX39 5DA EX39 5DD EX39 5DF EX39 5PB |
| Forestry Houses | EX39 5PP |
| Horns Cross | EX39 5DG EX39 5DH EX39 5DJ EX39 5DN EX39 5DW |
| Jacobs Field | EX39 5UZ |
| Kenwith Castle Gardens | EX39 5BE |
| Knotty Corner Cottages | EX39 5BT |
| Portledge Place | EX39 5AW |
| Pound Meadow | EX39 5UD |
| Pump Lane | EX39 5AY EX39 5AZ |
| Pusehill | EX39 5AH |
| Rickards Green | EX39 5BB |
| Shepherds Meadow | EX39 5BP |
| Silford Cross | EX39 3PT |
| Sloo Cottages | EX39 5EA |
| St Helens | EX39 5BR |
| St James Close | EX39 5TU |
| Woodtown | EX39 5BZ |
| Yeo Vale | EX39 5ER EX39 5ES EX39 5ET |
| EX39 5AP EX39 5AS EX39 5AT EX39 5AU EX39 5AX EX39 5BA EX39 5BD EX39 5BG EX39 5BH EX39 5BJ EX39 5BL EX39 5BW EX39 5EE EX39 5EN EX39 5PD EX39 5PE EX39 5PF EX39 5PG EX39 5PH EX39 5PJ EX39 5PL EX39 5PN EX39 5PQ EX39 5PR EX39 5PS EX39 5PT EX39 5PW EX39 5SS |
Transport near Kenwith
- FAQ
- Price Paid By Year
- Property Type Price
Frequently asked questions about Kenwith
What is the average price for a property for sale in Kenwith?
The average price for a property for sale in Kenwith is £385,008. This amount is 25% higher than the average price in Bideford. There are 1,825 property listings for sale in Kenwith.
What streets have the most expensive properties for sale in Kenwith?
The streets with the most expensive properties for sale in Kenwith are Silford Cross at an average of £675,000, Bucks Mills at an average of £585,000 and Fairy Cross at an average of £526,900.
What streets have the most affordable properties for sale in Kenwith?
The streets with the most affordable properties for sale in Kenwith are Horns Cross at an average of £211,666, Pump Lane at an average of £279,250 and Kenwith Castle Gardens at an average of £281,600.
Which train stations are available in or near Kenwith?
Some of the train stations available in or near Kenwith are Barnstaple, Chapelton and Umberleigh.
Property Price Paid in Kenwith by Year
The average sold property price by year was:
| Year | Average Sold Price | Price Change |
Sold Properties
|
|---|---|---|---|
| 2025 | £425,266 | 17% |
15 Properties |
| 2024 | £354,621 | -7% |
16 Properties |
| 2023 | £379,404 | -10% |
21 Properties |
| 2022 | £417,359 | 12% |
32 Properties |
| 2021 | £368,377 | 10% |
29 Properties |
| 2020 | £333,180 | 8% |
33 Properties |
| 2019 | £304,983 | -9% |
25 Properties |
| 2018 | £331,679 | 7% |
27 Properties |
| 2017 | £307,129 | 12% |
36 Properties |
| 2016 | £269,129 | -7% |
22 Properties |
| 2015 | £287,322 | 5% |
31 Properties |
| 2014 | £271,530 | 2% |
36 Properties |
| 2013 | £264,835 | 1% |
31 Properties |
| 2012 | £263,127 | -6% |
27 Properties |
| 2011 | £278,120 | 5% |
25 Properties |
| 2010 | £263,045 | 12% |
21 Properties |
| 2009 | £230,541 | 3% |
29 Properties |
| 2008 | £223,545 | -38% |
24 Properties |
| 2007 | £308,313 | 19% |
30 Properties |
| 2006 | £248,975 | -7% |
32 Properties |
| 2005 | £266,856 | 16% |
22 Properties |
| 2004 | £224,584 | 9% |
23 Properties |
| 2003 | £203,263 | 15% |
22 Properties |
| 2002 | £172,967 | 17% |
42 Properties |
| 2001 | £143,426 | 16% |
36 Properties |
| 2000 | £120,509 | 10% |
43 Properties |
| 1999 | £107,929 | 14% |
41 Properties |
| 1998 | £92,992 | 26% |
34 Properties |
| 1997 | £69,030 | 2% |
20 Properties |
| 1996 | £67,537 | -32% |
12 Properties |
| 1995 | £88,950 | - |
17 Properties |
Property Price per Property Type in Kenwith
Here you can find historic sold price data in order to help with your property search.
The average Property Paid Price for specific property types in the last three years are:
| Property Type | Average Sold Price | Sold Properties |
|---|---|---|
| Semi Detached House | £277,142.00 | 7 Semi Detached Houses |
| Detached House | £456,573.00 | 34 Detached Houses |
| Terraced House | £232,450.00 | 11 Terraced Houses |

