
Houses for sale in Bideford, Devon
House Prices in Bideford
Properties in Bideford have an average house price of £307k and had 1,915 Property Transactions within the last 3 years.¹
Bideford is an area in Devon with 18,097 households², where the most expensive property was sold for £1.5M.
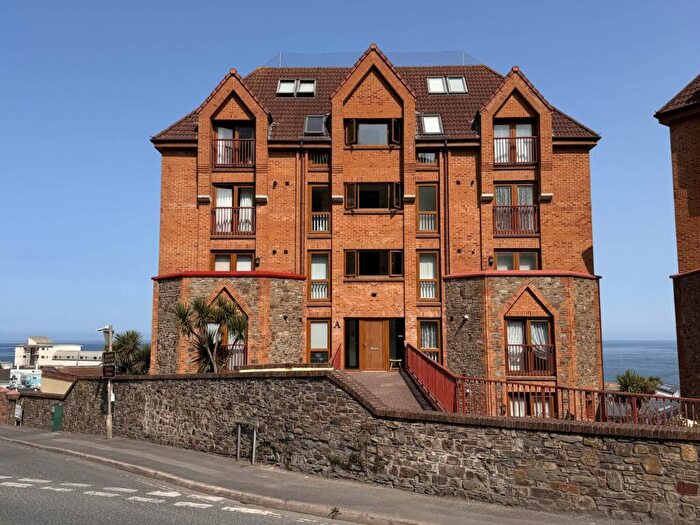
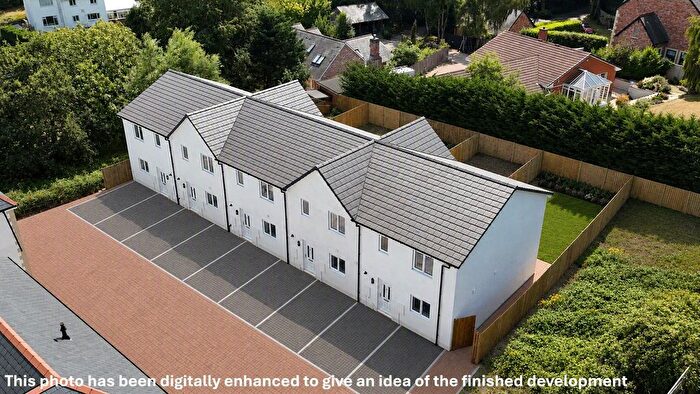
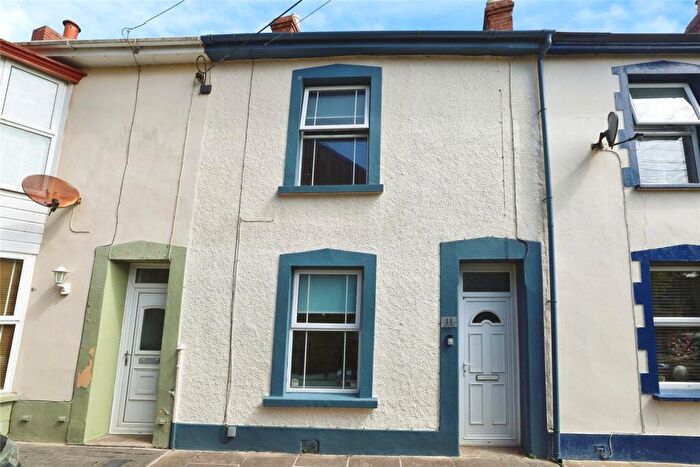
Properties for sale in Bideford
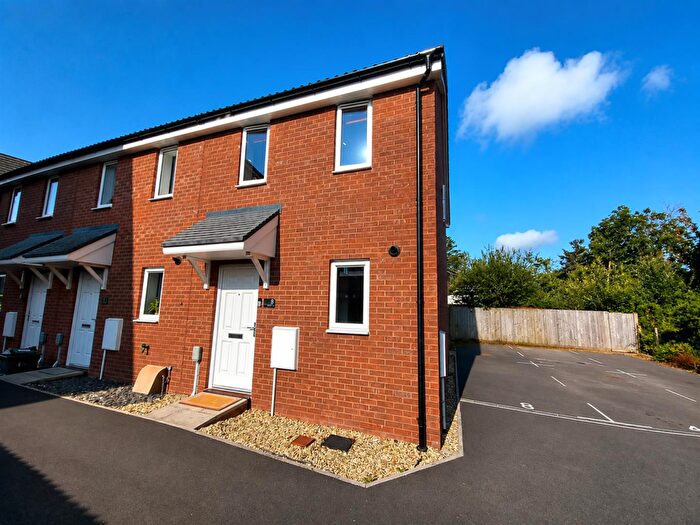
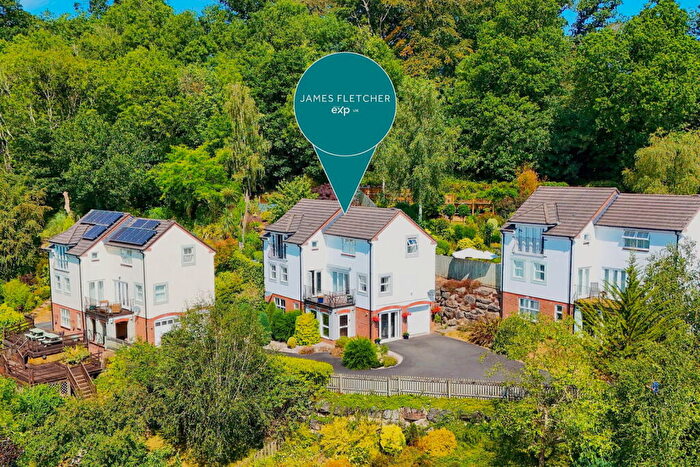
![]()
If you are looking to sell your house, let it out, or receive a property valuation, an expert can help you.
Click the button below to get started.
Neighbourhoods in Bideford
Navigate through our locations to find the location of your next house in Bideford, Devon for sale or to rent.
Property price trends in Bideford
According to the latest Land Registry data, the average home in Bideford sold for £280,217 in 2026. That figure comes from a substantial record of 26,900 sales logged over the past 31 years.
Prices have fallen back over the last three years. Compared with 2023, when the typical sale came in around £318,797, that's a fall of roughly 12.1%.
Looking back five years, average prices are down about 1.3% since 2021, a drop of around £3,705 in cash terms.
Zoom out to the past decade for the fuller picture. Back in 2016, homes here averaged £223,389, so the typical sold price has climbed about 25.4% since then, roughly 2.3% a year. Stretch the view to fifteen years and that annual pace holds at about 2.4%.
Frequently asked questions about Bideford
What is the average price for a property for sale in Bideford?
The average price for a property for sale in Bideford is £306,502. This amount is 15% lower than the average price in Devon. There are more than 10,000 property listings for sale in Bideford.
What locations have the most expensive properties for sale in Bideford?
The locations with the most expensive properties for sale in Bideford are Instow at an average of £557,625, Monkleigh And Littleham at an average of £391,832 and Kenwith at an average of £383,534.
What locations have the most affordable properties for sale in Bideford?
The locations with the most affordable properties for sale in Bideford are Bideford North at an average of £229,132, Bideford South at an average of £237,169 and Hartland at an average of £246,250.
Which train stations are available in or near Bideford?
Some of the train stations available in or near Bideford are Barnstaple, Chapelton and Umberleigh.
Property Price Paid in Bideford by Year
The average sold property price by year was:
| Year | Average Sold Price | Price Change |
Sold Properties
|
|---|---|---|---|
| 2026 | £280,217 | -7% |
39 Properties |
| 2025 | £300,299 | -1% |
615 Properties |
| 2024 | £302,367 | -5% |
649 Properties |
| 2023 | £318,797 | -5% |
612 Properties |
| 2022 | £334,502 | 15% |
730 Properties |
| 2021 | £283,922 | 5% |
1,036 Properties |
| 2020 | £270,076 | 11% |
802 Properties |
| 2019 | £240,443 | -1% |
883 Properties |
| 2018 | £243,292 | 4% |
926 Properties |
| 2017 | £233,346 | 4% |
955 Properties |
Property Price per Property Type in Bideford
Here you can find historic sold price data in order to help with your property search.
The average Property Paid Price for specific property types in the last three years are:
| Property Type | Average Sold Price | Sold Properties |
|---|---|---|
| Semi Detached House | £287,636.00 | 291 Semi Detached Houses |
| Terraced House | £237,855.00 | 746 Terraced Houses |
| Detached House | £434,841.00 | 652 Detached Houses |
| Flat | £187,142.00 | 226 Flats |
Transport in Bideford
Please see below transportation links in this area:
