Houses for sale & to rent in Ashburton And Buckfastleigh, Buckfastleigh
House Prices in Ashburton And Buckfastleigh
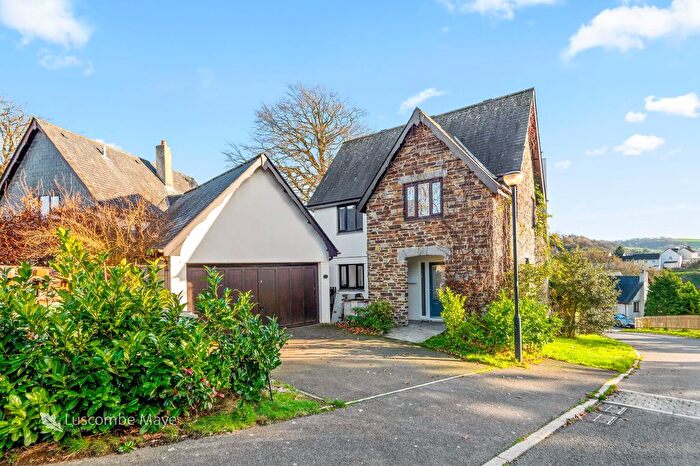
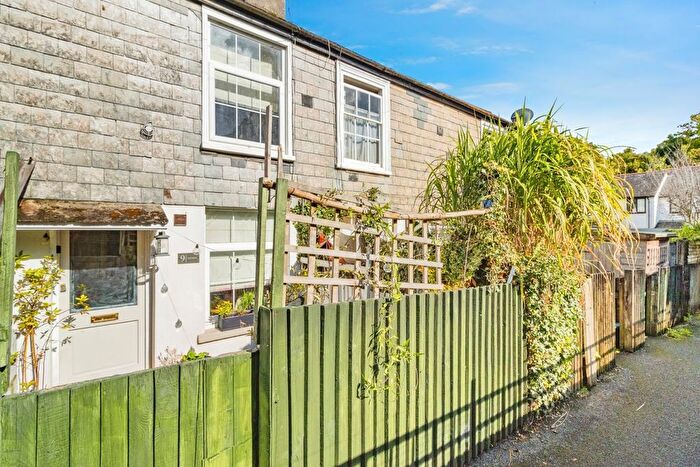
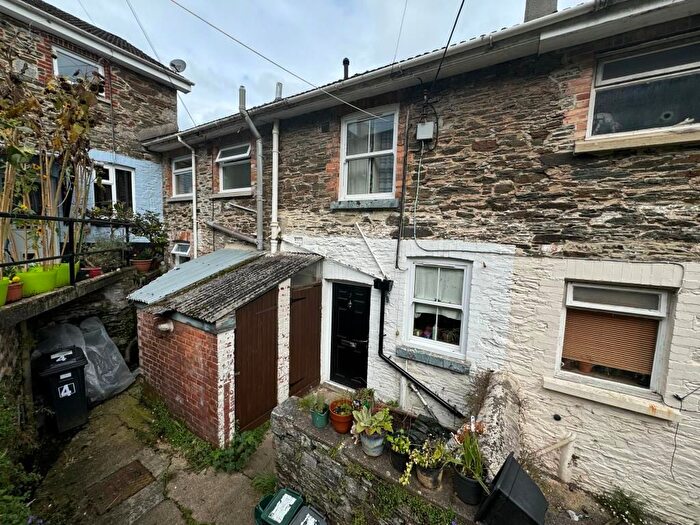
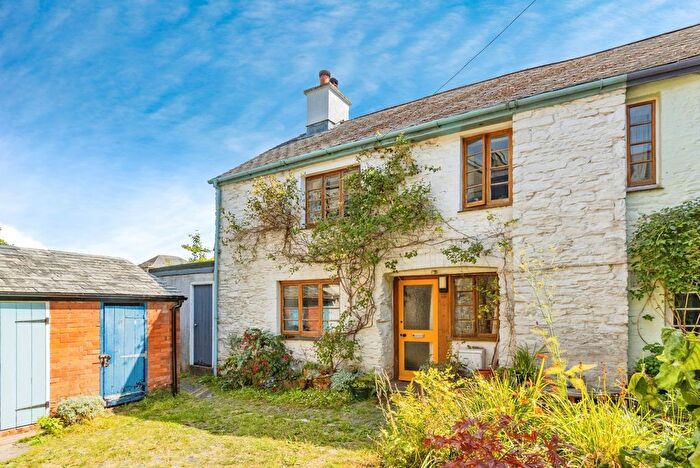
Properties in Ashburton And Buckfastleigh have an average house price of £249,314.00 and had 118 Property Transactions within the last 3 years¹.
Ashburton And Buckfastleigh is an area in Buckfastleigh, Devon with 1,522 households², where the most expensive property was sold for £530,000.00.
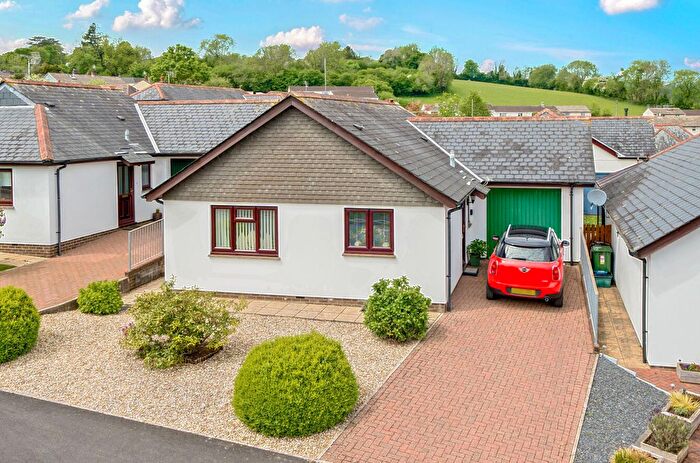
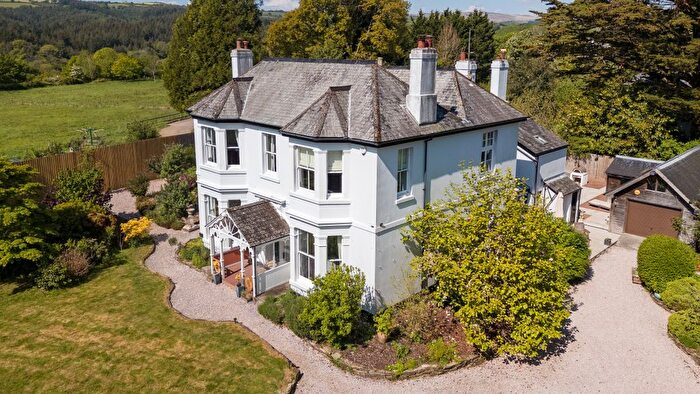
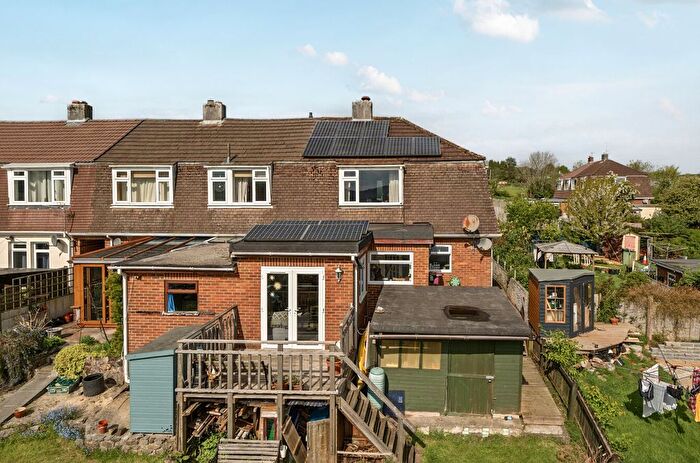
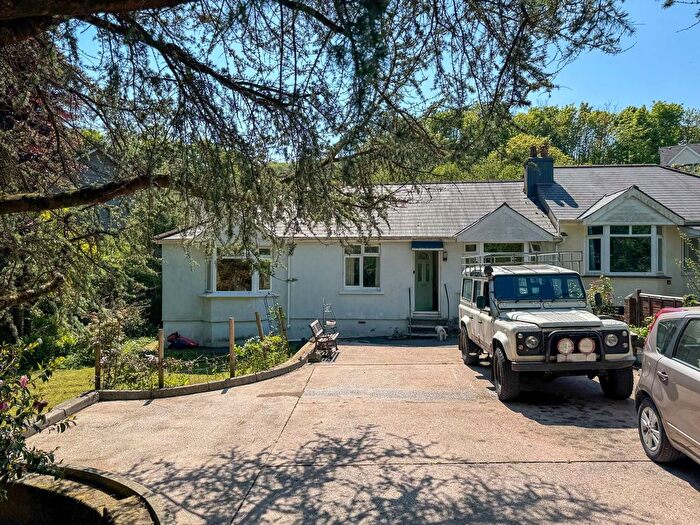
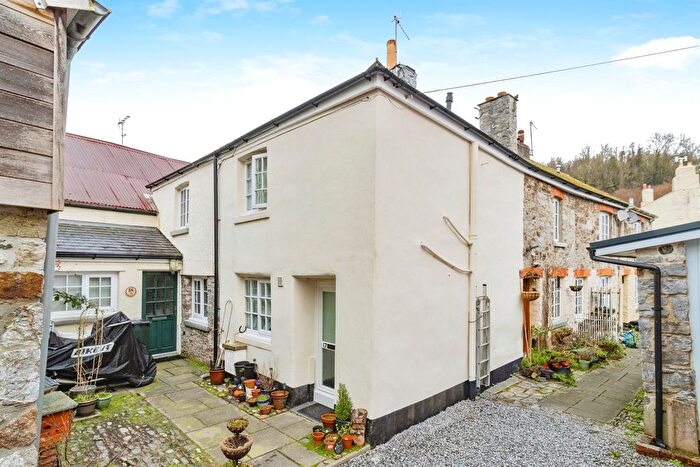
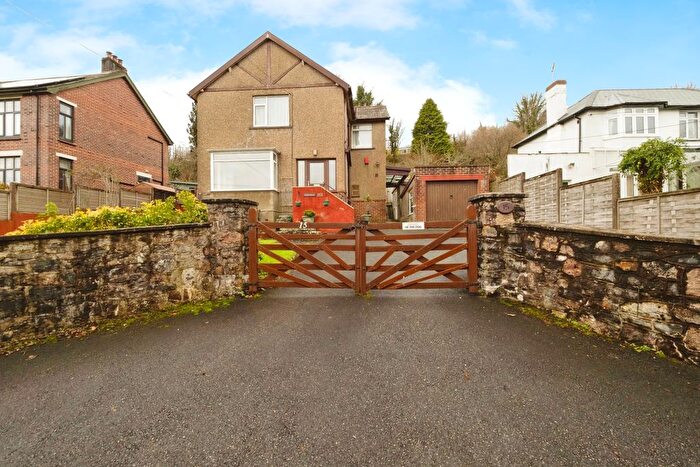
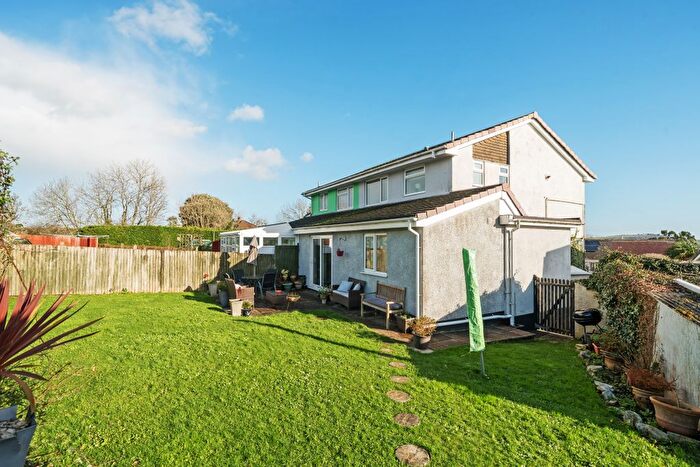
Properties for sale in Ashburton And Buckfastleigh
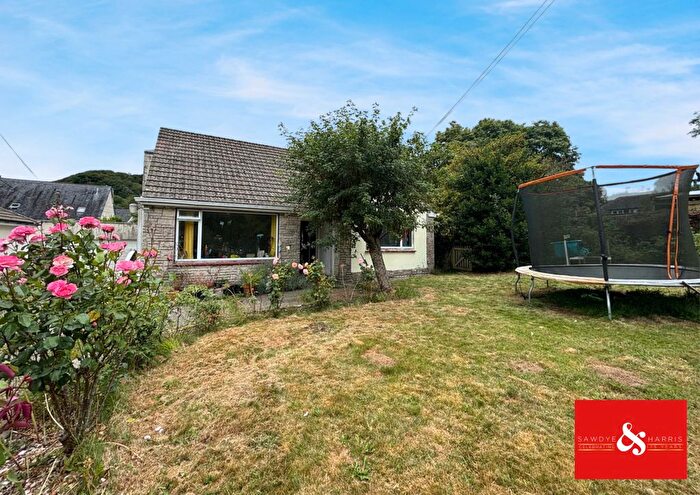
Previously listed properties in Ashburton And Buckfastleigh
Roads and Postcodes in Ashburton And Buckfastleigh
Navigate through our locations to find the location of your next house in Ashburton And Buckfastleigh, Buckfastleigh for sale or to rent.
| Streets | Postcodes |
|---|---|
| Abbey Grange Close | TQ11 0EU |
| Abbey Meadow | TQ11 0EJ |
| Ashburton Road | TQ11 0JP |
| Barn Park | TQ11 0AS TQ11 0AT |
| Barnsfield Lane | TQ11 0NP |
| Bossell Park | TQ11 0DX |
| Bossell Road | TQ11 0AW TQ11 0DD |
| Bossell Terrace | TQ11 0AE |
| Bridge Street | TQ11 0BB |
| Buckfast Close | TQ11 0EW |
| Buckfast Road | TQ11 0EA |
| Chapel Street | TQ11 0AB TQ11 0AQ |
| Church Street | TQ11 0BD TQ11 0FD |
| Colston Road | TQ11 0LN TQ11 0LW |
| Crest Hill | TQ11 0AN |
| Croppins Close | TQ11 0EY |
| Dart Bridge Road | TQ11 0DY TQ11 0DZ |
| Dartbridge Manor | TQ11 0EX TQ11 0PR |
| Duckspond Close | TQ11 0NH |
| Duckspond Road | TQ11 0NL |
| Elliott Plain | TQ11 0BZ |
| Elmbank | TQ11 0DN |
| Fairy Lane | TQ11 0DP |
| Fore Street | TQ11 0AA TQ11 0BS TQ11 0BT TQ11 0FE |
| Fullaford Park | TQ11 0NJ |
| Furlong Close | TQ11 0ER |
| Gipsy Lane | TQ11 0DL |
| Glebelands | TQ11 0BH TQ11 0BJ |
| Grange Road | TQ11 0EH |
| Halfmoon Court | TQ11 0GA |
| Hembury Park | TQ11 0ES |
| High Holly | TQ11 0DF |
| Higher Mill Lane | TQ11 0EN |
| Holne Road | TQ11 0BE |
| Jordan Orchard | TQ11 0NG |
| Jordan Street | TQ11 0AU TQ11 0AX TQ11 0AY |
| Kingcome Court | TQ11 0NN |
| Market Close | TQ11 0QA |
| Market Street | TQ11 0BA |
| Moorland View | TQ11 0AF |
| New Road | TQ11 0AJ |
| Newcause | TQ11 0AZ |
| Oaklands Close | TQ11 0NY |
| Oaklands Park | TQ11 0BP TQ11 0BW |
| Oaklands Road | TQ11 0BL |
| Old Totnes Road | TQ11 0BY TQ11 0LQ TQ11 0LR |
| Orchard Terrace | TQ11 0AH |
| Plymouth Road | TQ11 0DA TQ11 0DB TQ11 0DG TQ11 0DH |
| Rangers Close | TQ11 0PG |
| Silver Street | TQ11 0BG TQ11 0BQ |
| Springfield Park | TQ11 0LL |
| St Bernards Close | TQ11 0EL TQ11 0EP |
| Station Road | TQ11 0BU |
| Strode Road | TQ11 0BX TQ11 0PF |
| The Orchard | TQ11 0FG |
| Timbers Close | TQ11 0DR |
| Tweenaways | TQ11 0DW |
| Wallaford Road | TQ11 0AR |
| West End Road | TQ11 0DJ |
| Williams Court | TQ11 0BN |
| TQ11 0HN TQ11 0ND |
Transport near Ashburton And Buckfastleigh
- FAQ
- Price Paid By Year
- Property Type Price
Frequently asked questions about Ashburton And Buckfastleigh
What is the average price for a property for sale in Ashburton And Buckfastleigh?
The average price for a property for sale in Ashburton And Buckfastleigh is £249,314. This amount is 15% lower than the average price in Buckfastleigh. There are 132 property listings for sale in Ashburton And Buckfastleigh.
What streets have the most expensive properties for sale in Ashburton And Buckfastleigh?
The streets with the most expensive properties for sale in Ashburton And Buckfastleigh are Buckfast Close at an average of £530,000, New Road at an average of £490,000 and Barnsfield Lane at an average of £475,000.
What streets have the most affordable properties for sale in Ashburton And Buckfastleigh?
The streets with the most affordable properties for sale in Ashburton And Buckfastleigh are Chapel Street at an average of £160,816, Elliott Plain at an average of £163,250 and Orchard Terrace at an average of £175,999.
Which train stations are available in or near Ashburton And Buckfastleigh?
Some of the train stations available in or near Ashburton And Buckfastleigh are Totnes, Ivybridge and Newton Abbot.
Property Price Paid in Ashburton And Buckfastleigh by Year
The average sold property price by year was:
| Year | Average Sold Price | Price Change |
Sold Properties
|
|---|---|---|---|
| 2025 | £282,548 | 15% |
31 Properties |
| 2024 | £240,488 | 3% |
47 Properties |
| 2023 | £233,929 | -28% |
40 Properties |
| 2022 | £300,371 | 16% |
59 Properties |
| 2021 | £251,394 | 7% |
76 Properties |
| 2020 | £232,541 | 7% |
57 Properties |
| 2019 | £215,637 | -7% |
51 Properties |
| 2018 | £230,112 | 5% |
75 Properties |
| 2017 | £217,955 | 1% |
58 Properties |
| 2016 | £214,906 | 9% |
75 Properties |
| 2015 | £195,999 | 2% |
50 Properties |
| 2014 | £192,867 | 14% |
61 Properties |
| 2013 | £165,903 | -20% |
44 Properties |
| 2012 | £198,604 | -7% |
43 Properties |
| 2011 | £212,712 | 9% |
33 Properties |
| 2010 | £192,816 | 7% |
34 Properties |
| 2009 | £179,978 | -5% |
49 Properties |
| 2008 | £189,371 | -11% |
41 Properties |
| 2007 | £210,294 | 13% |
83 Properties |
| 2006 | £182,716 | 5% |
74 Properties |
| 2005 | £172,964 | 2% |
72 Properties |
| 2004 | £169,092 | 12% |
64 Properties |
| 2003 | £148,526 | 11% |
86 Properties |
| 2002 | £131,537 | 34% |
86 Properties |
| 2001 | £87,440 | -9% |
92 Properties |
| 2000 | £95,266 | 27% |
88 Properties |
| 1999 | £69,582 | 13% |
104 Properties |
| 1998 | £60,578 | -3% |
77 Properties |
| 1997 | £62,413 | 21% |
87 Properties |
| 1996 | £49,486 | -23% |
67 Properties |
| 1995 | £60,827 | - |
51 Properties |
Property Price per Property Type in Ashburton And Buckfastleigh
Here you can find historic sold price data in order to help with your property search.
The average Property Paid Price for specific property types in the last three years are:
| Property Type | Average Sold Price | Sold Properties |
|---|---|---|
| Semi Detached House | £265,500.00 | 17 Semi Detached Houses |
| Detached House | £352,096.00 | 31 Detached Houses |
| Terraced House | £205,494.00 | 62 Terraced Houses |
| Flat | £156,243.00 | 8 Flats |

