
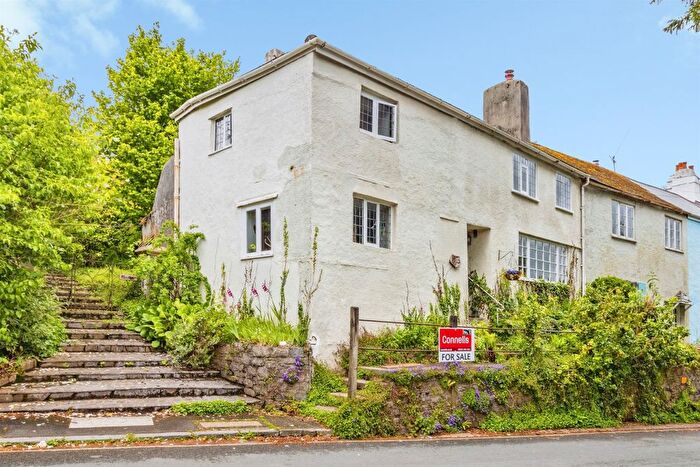
Houses for sale in Eastmoor, Newton Abbot
House Prices in Eastmoor
Properties in Eastmoor have an average house price of £581k and had 13 Property Transactions within the last 3 years¹.
Eastmoor is an area in Newton Abbot, Devon with 216 households², where the most expensive property was sold for £1.3M.
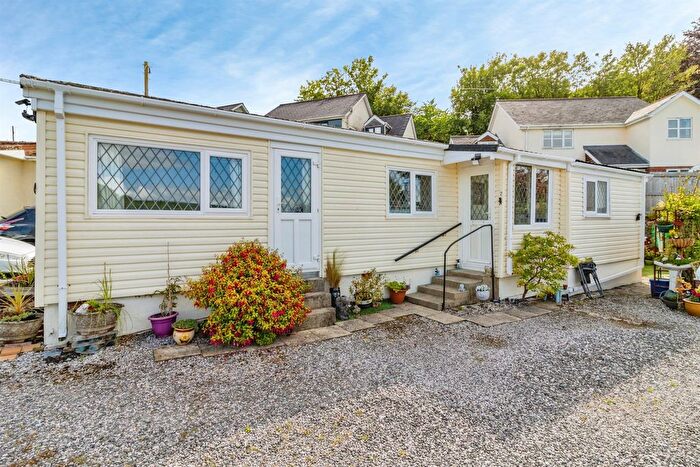
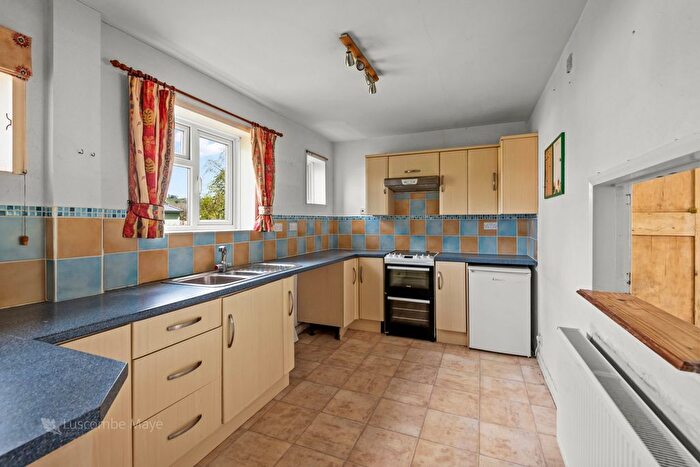
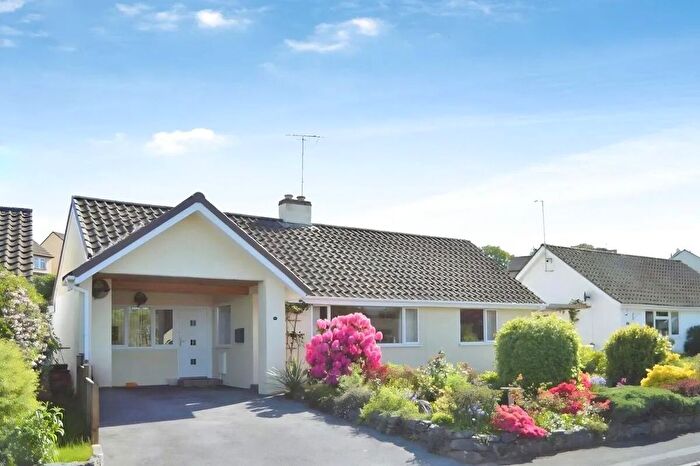
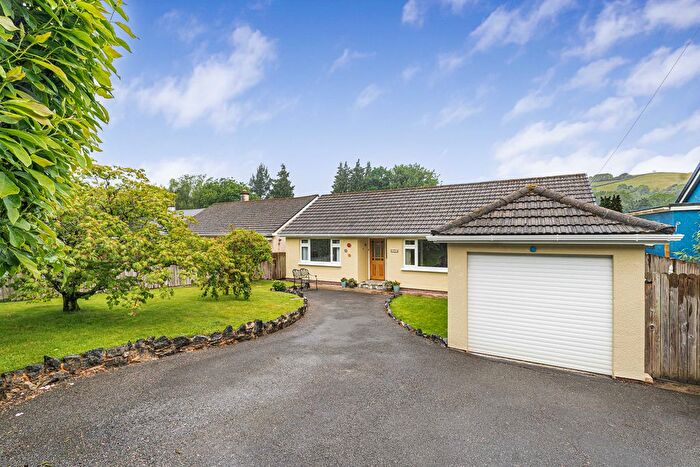
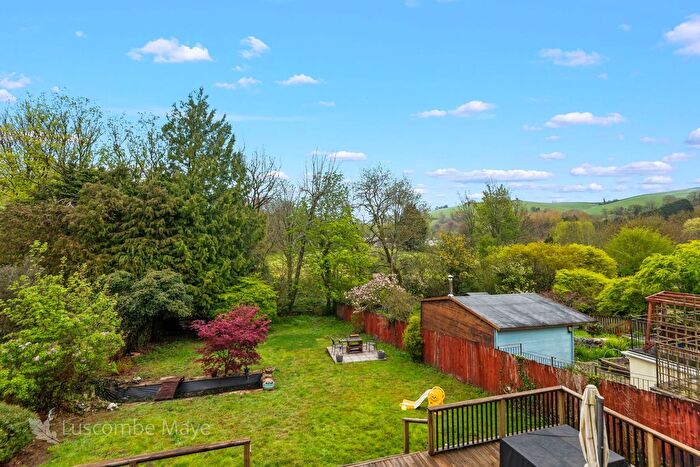
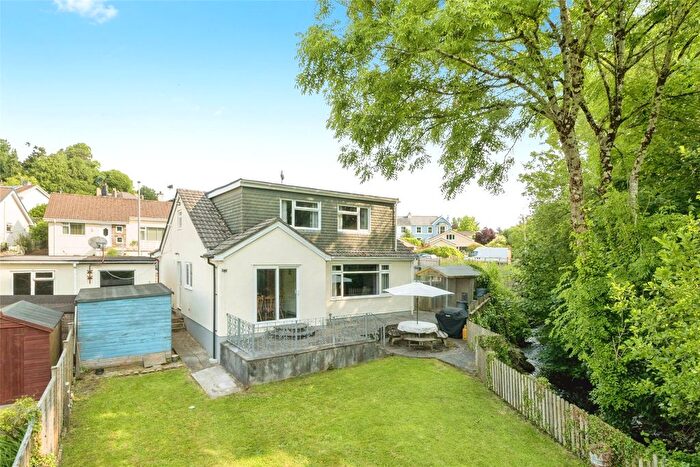
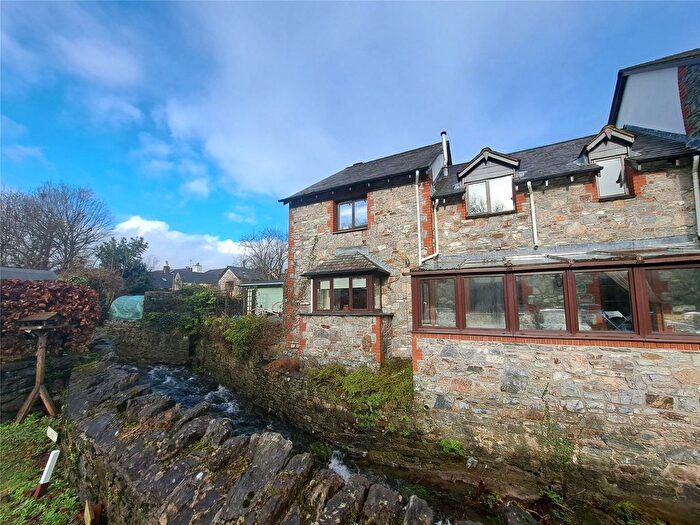
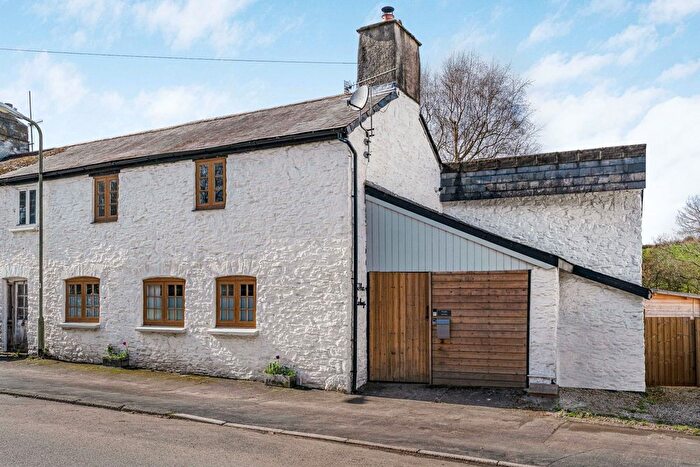
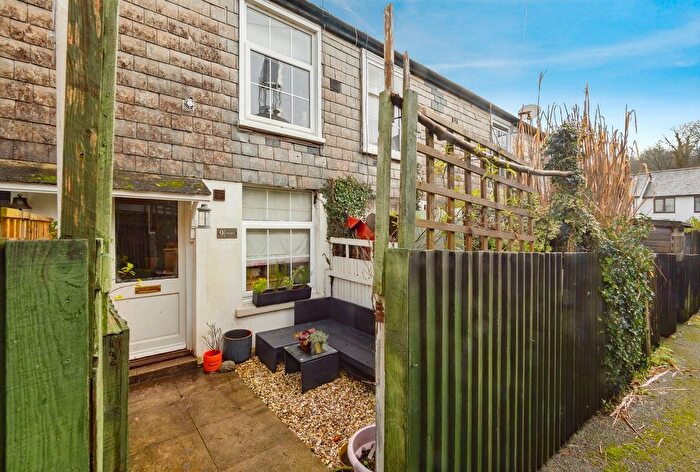
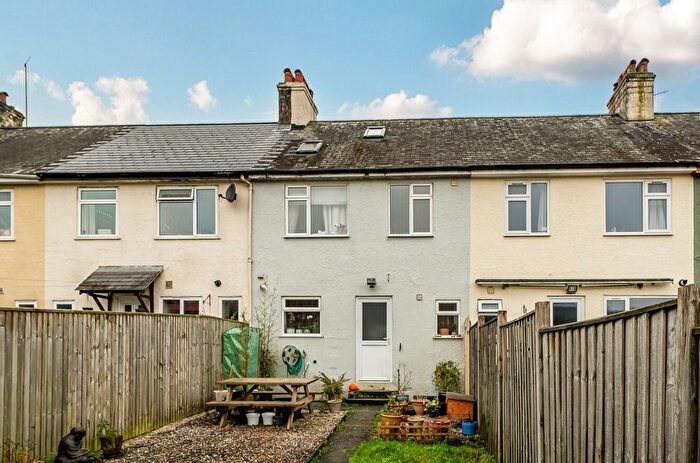
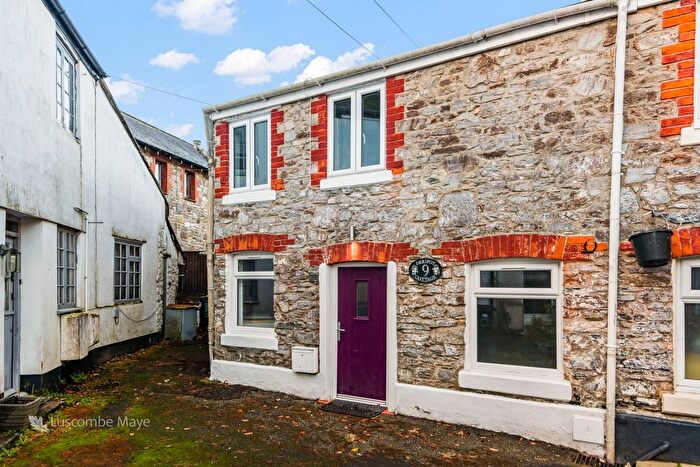
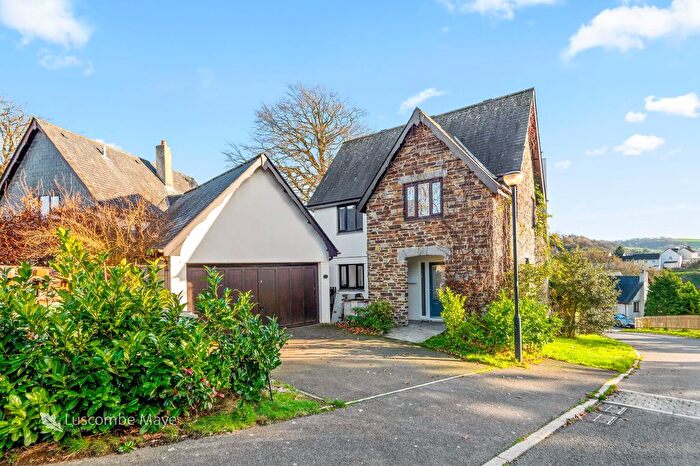
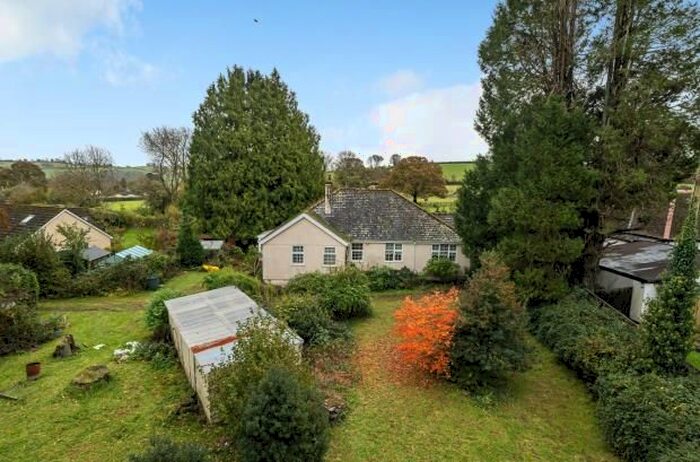
Properties for sale in Eastmoor
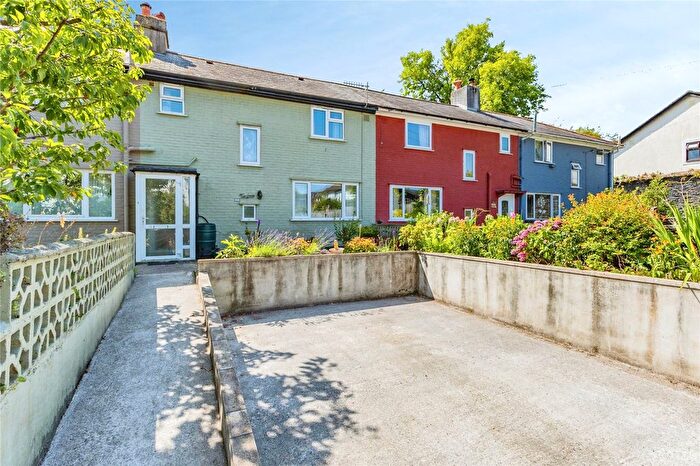
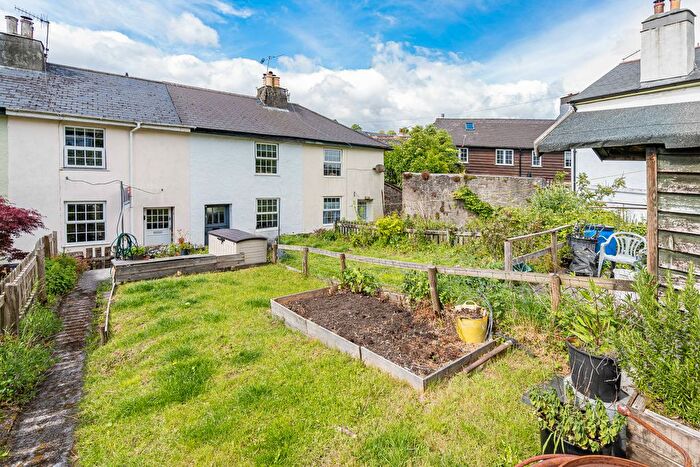
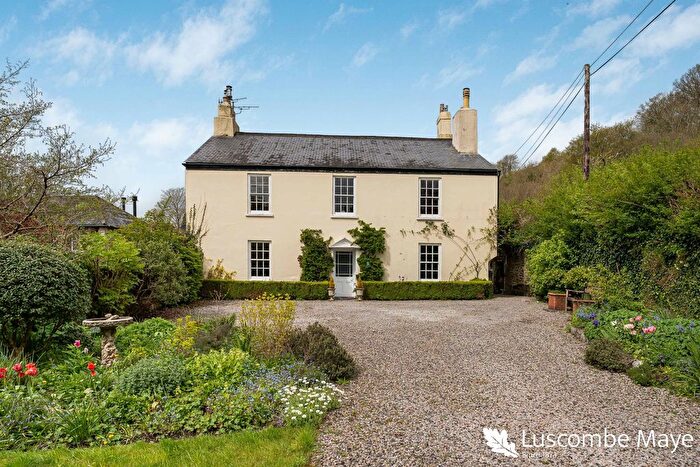
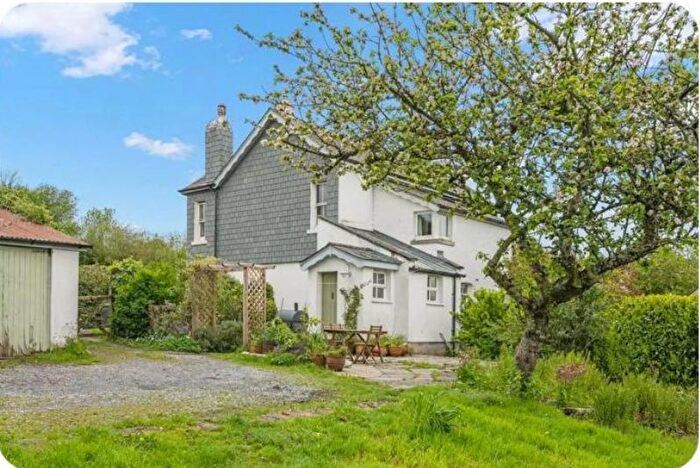
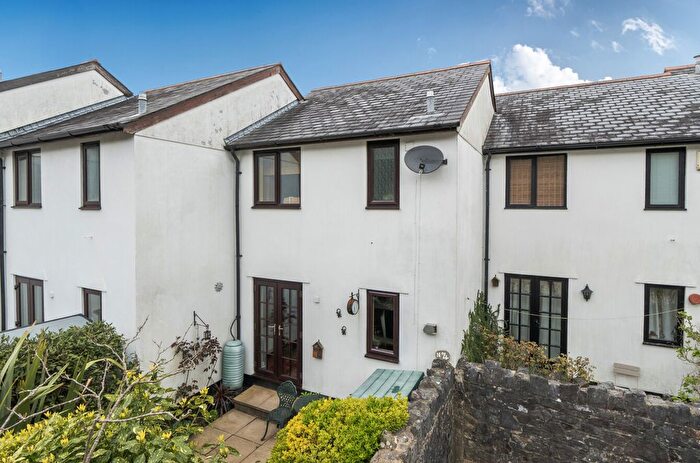
Previously listed properties in Eastmoor
![]()
If you are looking to sell your house, let it out, or receive a property valuation, an expert can help you.
Click the button below to get started.
Roads and Postcodes in Eastmoor
Navigate through our locations to find the location of your next house in Eastmoor, Newton Abbot for sale or to rent.
| Streets | Postcodes |
|---|---|
| Bakers Orchard | TQ13 7LE |
| Bakers Park | TQ13 7SN |
| Church Park Cottages | TQ13 7SG |
| Landscove | TQ13 7LT TQ13 7LU TQ13 7LX TQ13 7LY TQ13 7LZ TQ13 7NA TQ13 7NQ |
| Memory Cross | TQ13 7NB |
| Parkfield Cottages | TQ13 7ND |
| Woolston Green | TQ13 7RR |
| TQ13 7JJ TQ13 7NG TQ13 7NT TQ13 7RT TQ13 7RX TQ13 7RY TQ13 7SH TQ13 7SJ TQ13 7SL TQ13 7SP TQ13 7SQ TQ13 7SR TQ13 7SS TQ13 7ST |
Property price trends in Eastmoor
According to the latest Land Registry data, the average home in Eastmoor sold for £431,875 in 2025. That figure comes from 226 sales logged over the past 30 years.
Prices have fallen back over the last three years. Compared with 2022, when the typical sale came in around £730,666, that's a fall of roughly 40.9%.
Looking back five years, average prices are up about 0.4% since 2020, a gain of around £1,875 in cash terms.
Zoom out to the past decade for the fuller picture. Back in 2015, homes here averaged £349,571, so the typical sold price has climbed about 23.5% since then, roughly 2.1% a year. Stretch the view to fifteen years and that annual pace eases back to about 1%.
Frequently asked questions about Eastmoor
What is the average price for a property for sale in Eastmoor?
The average price for a property for sale in Eastmoor is £581,038. This amount is 74% higher than the average price in Newton Abbot. There are 262 property listings for sale in Eastmoor.
What streets have the most expensive properties for sale in Eastmoor?
The streets with the most expensive properties for sale in Eastmoor are Landscove at an average of £840,000 and Parkfield Cottages at an average of £650,000.
What streets have the most affordable properties for sale in Eastmoor?
The streets with the most affordable properties for sale in Eastmoor are Bakers Park at an average of £353,750 and Memory Cross at an average of £445,000.
Which train stations are available in or near Eastmoor?
Some of the train stations available in or near Eastmoor are Totnes, Newton Abbot and Ivybridge.
Property Price Paid in Eastmoor by Year
The average sold property price by year was:
| Year | Average Sold Price | Price Change |
Sold Properties
|
|---|---|---|---|
| 2025 | £431,875 | -30% |
4 Properties |
| 2024 | £562,500 | -27% |
4 Properties |
| 2023 | £715,200 | -2% |
5 Properties |
| 2022 | £730,666 | 37% |
9 Properties |
| 2021 | £456,857 | 6% |
7 Properties |
| 2020 | £430,000 | -28% |
5 Properties |
| 2019 | £549,700 | 23% |
5 Properties |
| 2018 | £424,266 | -0,1% |
9 Properties |
| 2017 | £424,777 | 14% |
9 Properties |
| 2016 | £366,600 | 5% |
5 Properties |
Property Price per Property Type in Eastmoor
Here you can find historic sold price data in order to help with your property search.
The average Property Paid Price for specific property types in the last three years are:
| Property Type | Average Sold Price | Sold Properties |
|---|---|---|
| Semi Detached House | £544,500.00 | 5 Semi Detached Houses |
| Terraced House | £412,500.00 | 2 Terraced Houses |
| Detached House | £667,666.00 | 6 Detached Houses |
