
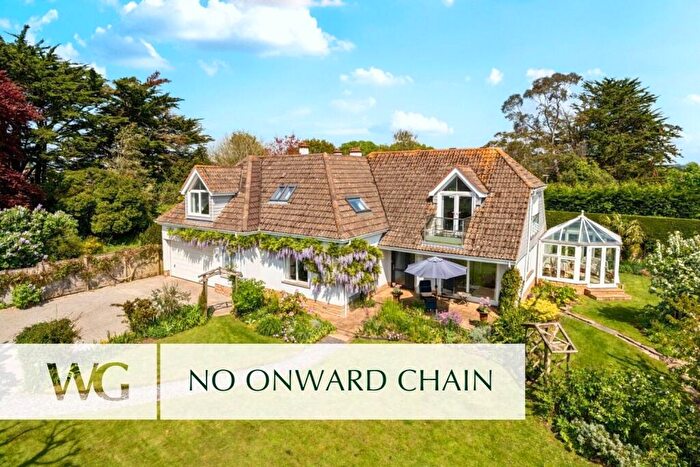
Houses for sale in Budleigh & Raleigh, Budleigh Salterton
House Prices in Budleigh & Raleigh
Properties in Budleigh & Raleigh have an average house price of £423k and had 5 Property Transactions within the last 3 years¹.
Budleigh & Raleigh is an area in Budleigh Salterton, Devon with 184 households², where the most expensive property was sold for £790k.
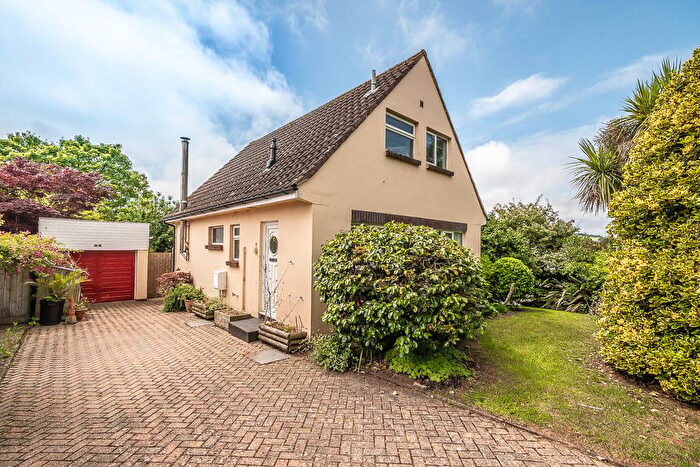
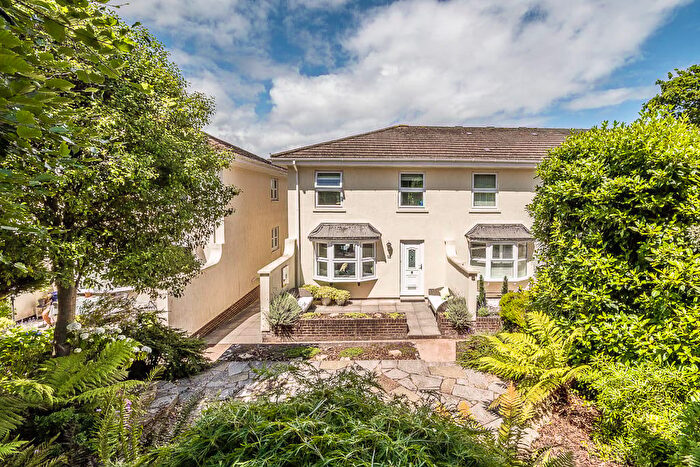
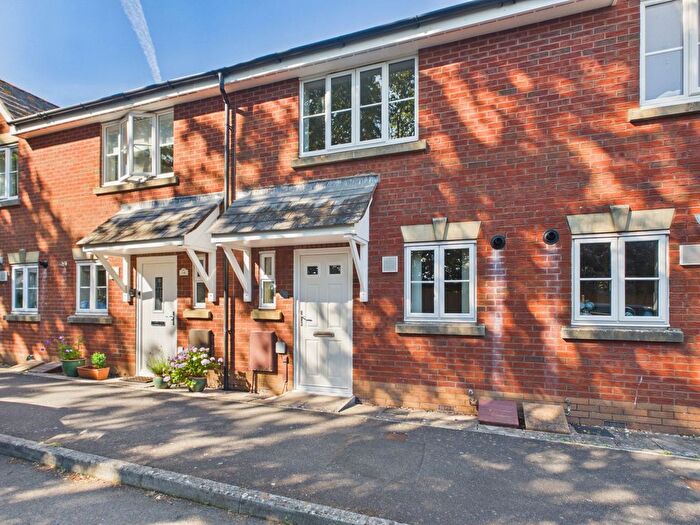
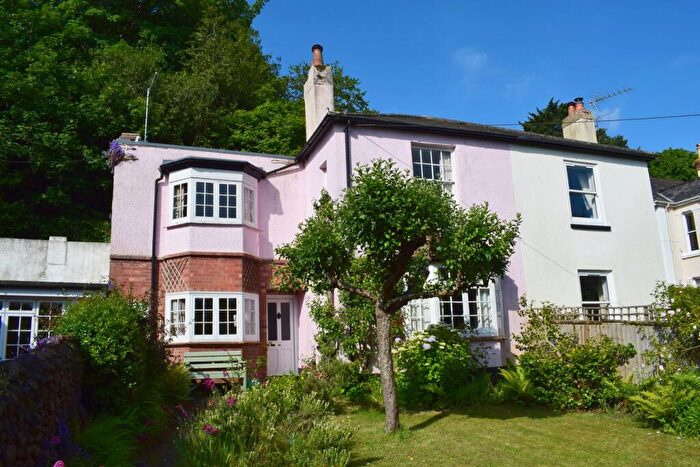
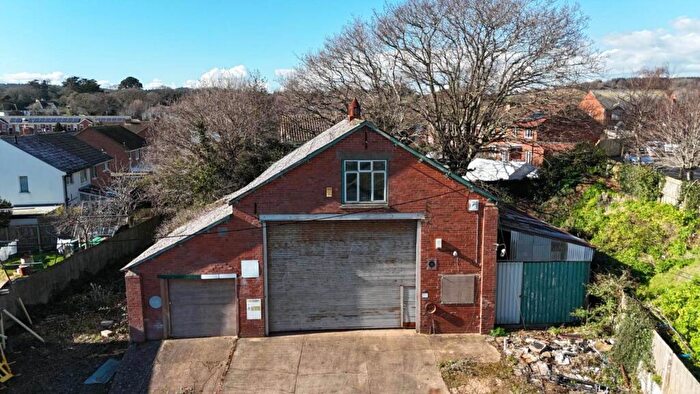
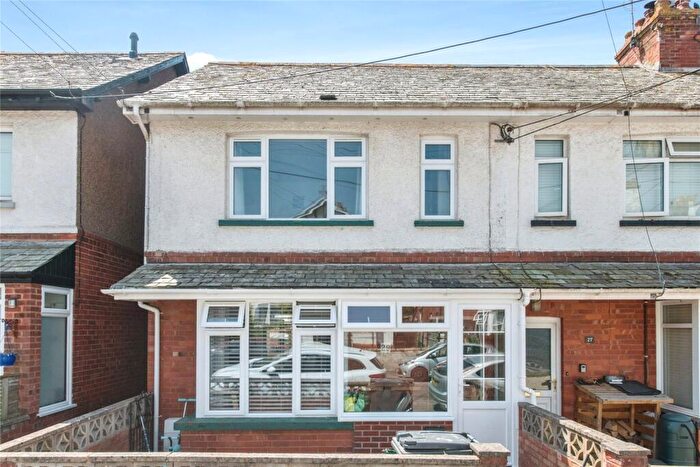
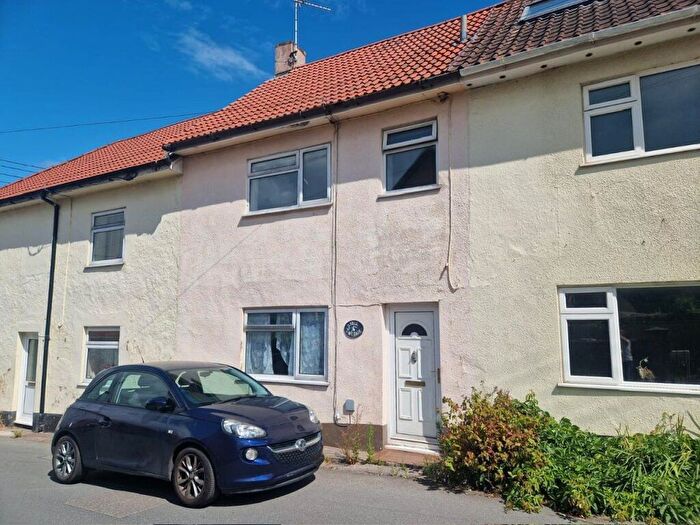
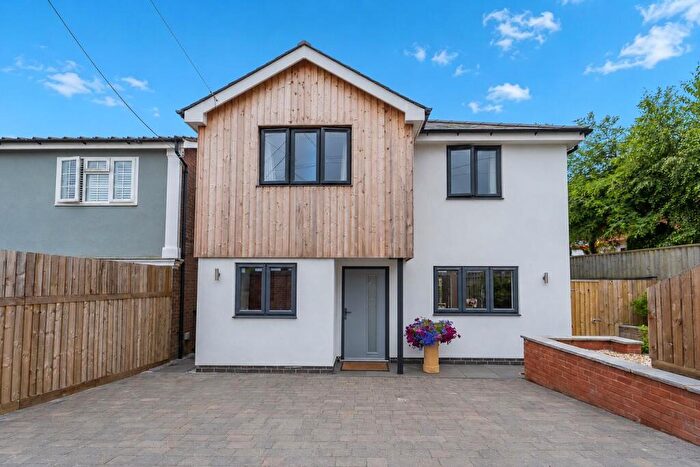
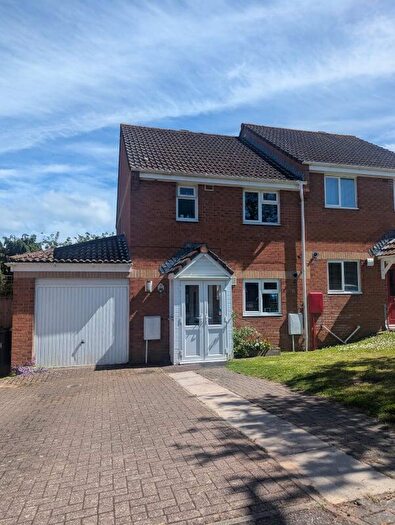
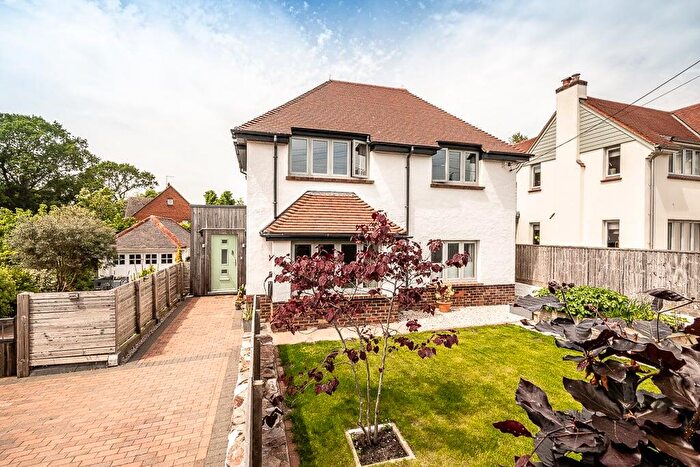
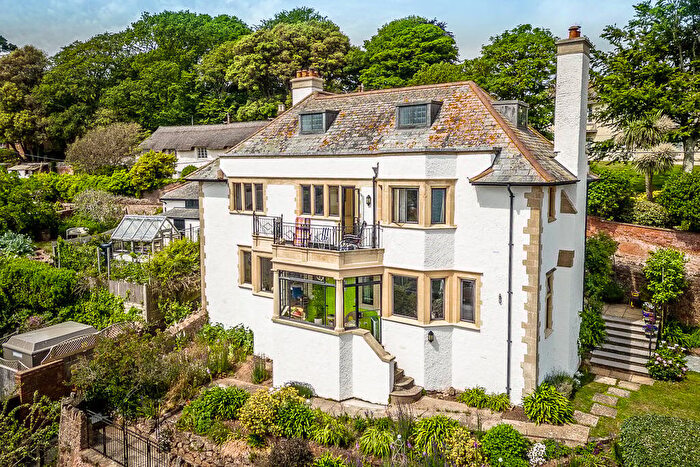
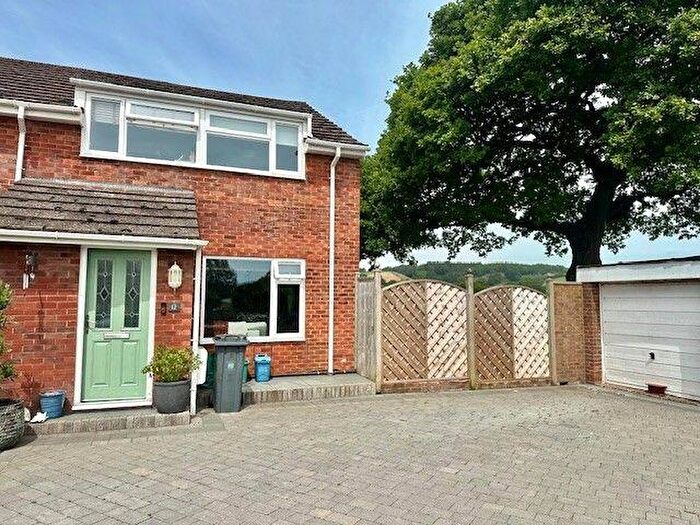
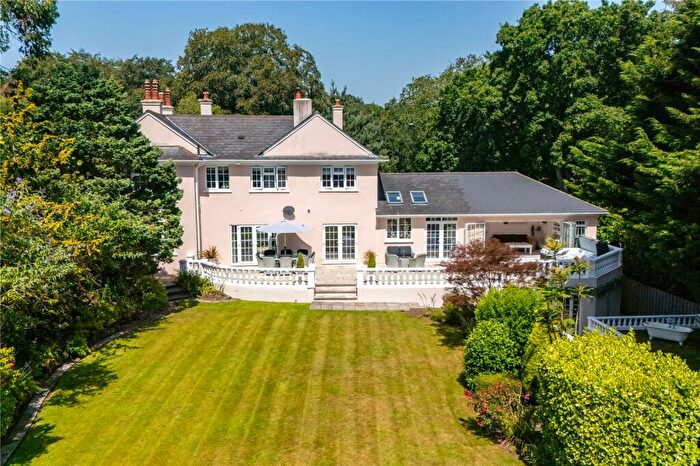
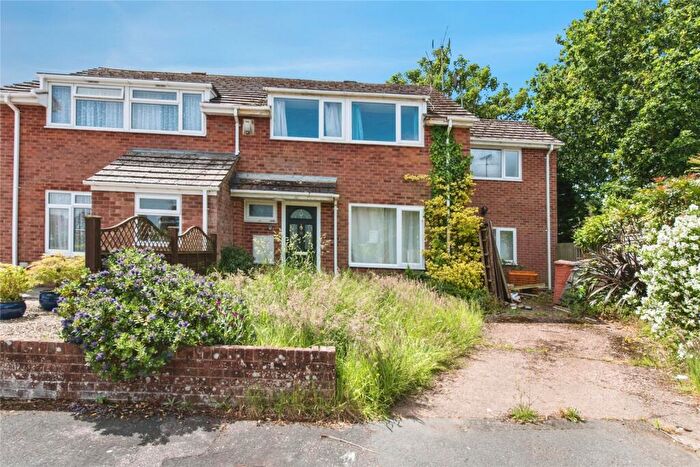
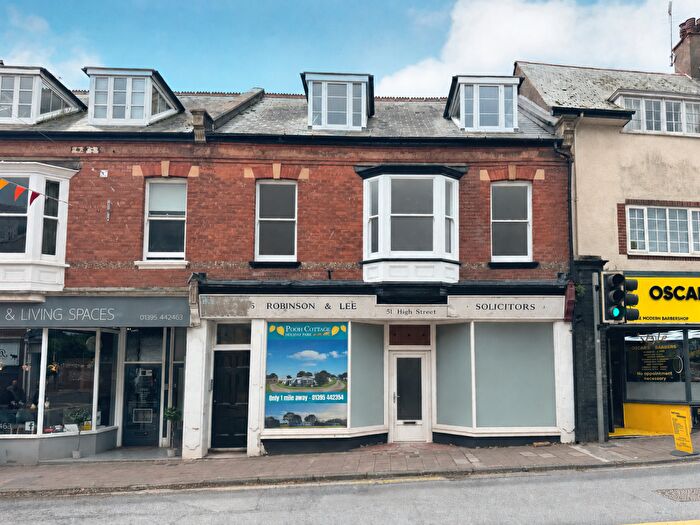
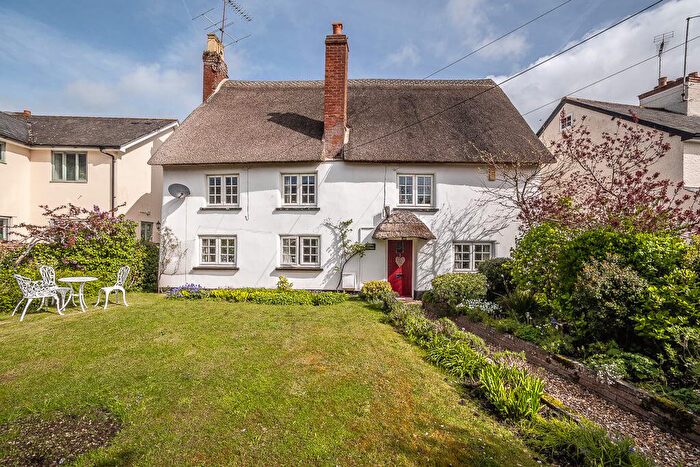
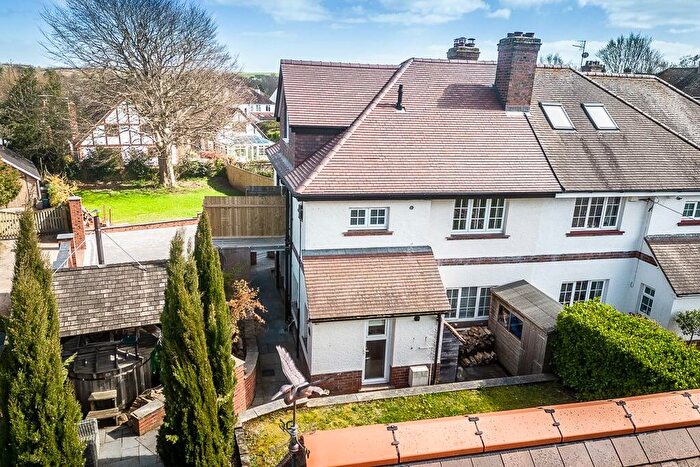
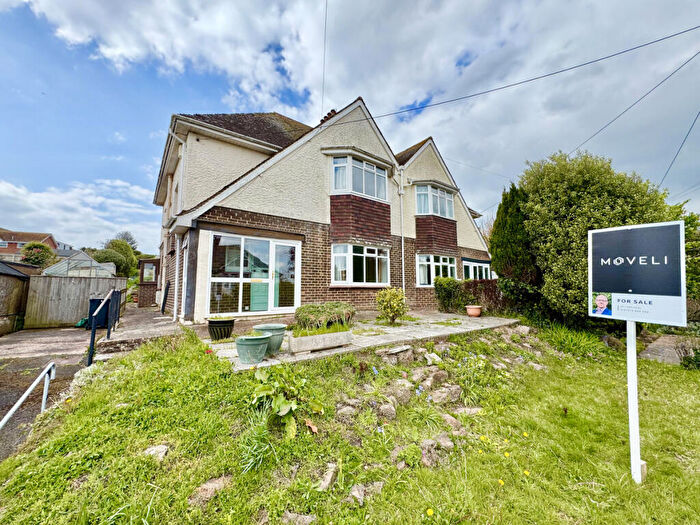
Properties for sale in Budleigh & Raleigh
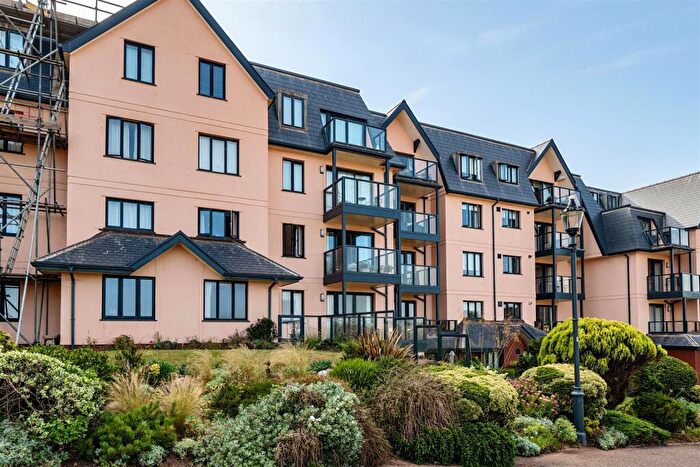
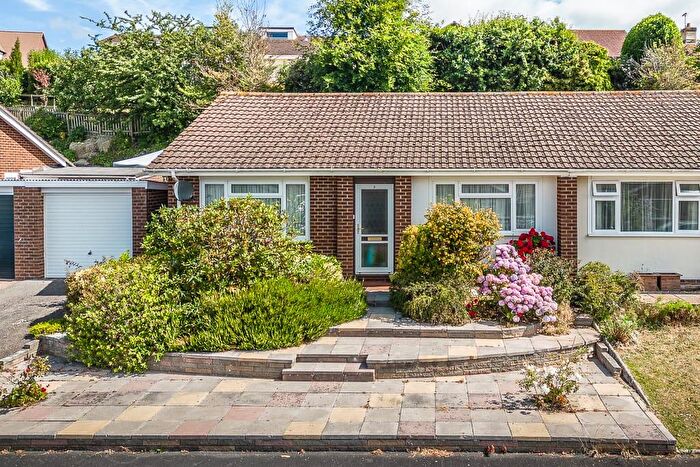
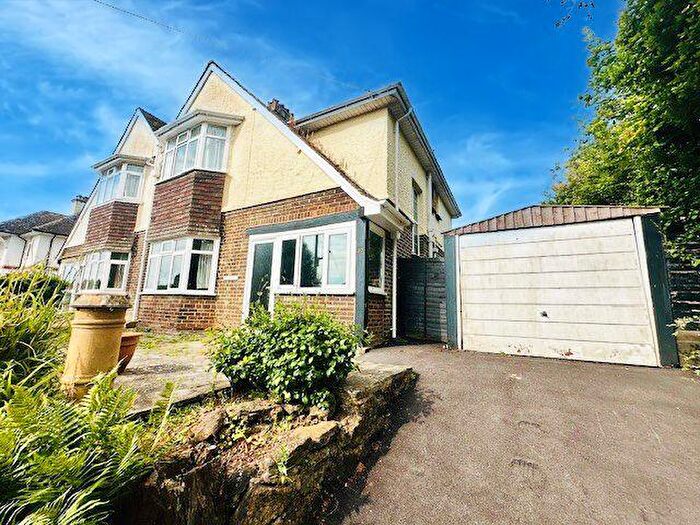
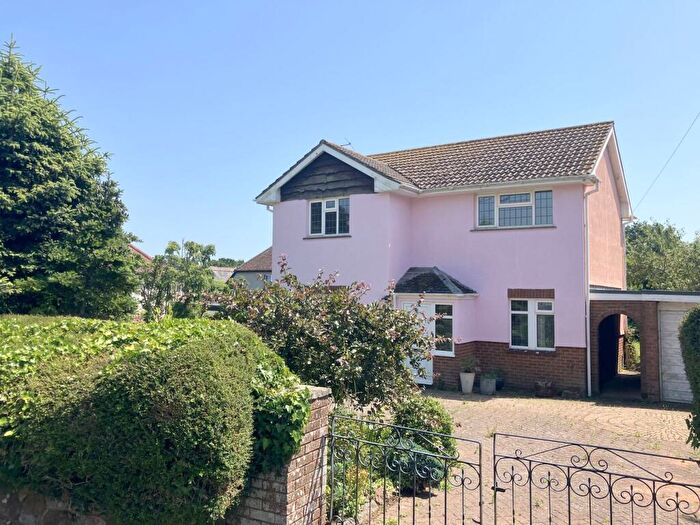
![]()
If you are looking to sell your house, let it out, or receive a property valuation, an expert can help you.
Click the button below to get started.
Roads and Postcodes in Budleigh & Raleigh
Navigate through our locations to find the location of your next house in Budleigh & Raleigh, Budleigh Salterton for sale or to rent.
| Streets | Postcodes |
|---|---|
| Bicton | EX9 7BG |
| Bicton Gardens | EX9 7BQ |
| Bicton Park | EX9 7BJ |
| Brook Road | EX9 6AY EX9 6BB |
| Coastguard Road | EX9 6NT |
| East Budleigh Road | EX9 7BA |
| Evans Field | EX9 7AU |
| Fore Street | EX9 6NQ EX9 6NJ |
| Fore Street Hill | EX9 6BD |
| Green Close | EX9 7HX |
| Hayes Lane | EX9 7BS |
| High Street | EX9 6LF EX9 6LG EX9 6LJ |
| Higher Maunders Hill | EX9 7HZ |
| Ladram Bay | EX9 7BX |
| Lea Lane | EX9 7LA |
| Maunders Hill | EX9 7JR |
| Maunders Place | EX9 7JE |
| Middle Street | EX9 7DH |
| Moor Lane | EX9 6QE EX9 6QF |
| Moormead | EX9 6PS |
| Oak Hill | EX9 7EA |
| Palmer Mews | EX9 6BH |
| Pebble Lane | EX9 6NN |
| Ragg Lane | EX9 6NA |
| Rolle Terrace | EX9 7DS |
| Ropers Court | EX9 7JB |
| Rydon Orchard | EX9 7DD |
| Ryll Lane | EX9 6PF |
| Salting Hill | EX9 6BG |
| South Farm Court | EX9 7AY |
| Station Road | EX9 6RS |
| The Drive | EX9 7BH |
| The Lawn | EX9 6LS EX9 6LR EX9 6LT |
| Vales Road | EX9 6HY |
| West Hill | EX9 6AE |
| EX9 6WN EX9 7BY EX9 7BZ EX9 7HG EX9 9AE EX9 9AF EX9 9AJ EX9 9AL EX9 6QB EX9 6SN EX9 7AE EX9 7AJ EX9 7BE EX9 7BU EX9 7HH |
Property price trends in Budleigh & Raleigh
According to the latest Land Registry data, the average home in Budleigh & Raleigh sold for £431,500 in 2024. That figure comes from 47 sales logged over the past 14 years.
Prices have fallen back over the last three years. Compared with 2021, when the typical sale came in around £620,000, that's a fall of roughly 30.4%.
Looking back five years, average prices are up about 29.3% since 2019, a gain of around £97,750 in cash terms.
Zoom out to the past decade for the fuller picture. Back in 2015, homes here averaged £215,000, so the typical sold price has climbed about 100.7% since then, roughly 8% a year. Stretch the view to fifteen years and that annual pace eases back to about 6.5%.
Frequently asked questions about Budleigh & Raleigh
What is the average price for a property for sale in Budleigh & Raleigh?
The average price for a property for sale in Budleigh & Raleigh is £423,200. This amount is 14% lower than the average price in Budleigh Salterton. There are 578 property listings for sale in Budleigh & Raleigh.
What streets have the most expensive properties for sale in Budleigh & Raleigh?
The streets with the most expensive properties for sale in Budleigh & Raleigh are Fore Street at an average of £790,000 and The Drive at an average of £313,000.
What streets have the most affordable properties for sale in Budleigh & Raleigh?
The street with the most affordable properties for sale in Budleigh & Raleigh is The Lawn at an average of £310,000.
Which train stations are available in or near Budleigh & Raleigh?
Some of the train stations available in or near Budleigh & Raleigh are Exmouth, Lympstone Village and Lympstone Commando.
Property Price Paid in Budleigh & Raleigh by Year
The average sold property price by year was:
| Year | Average Sold Price | Price Change |
Sold Properties
|
|---|---|---|---|
| 2024 | £431,500 | 10% |
4 Properties |
| 2023 | £390,000 | 57% |
1 Property |
| 2022 | £167,000 | -271% |
4 Properties |
| 2021 | £620,000 | 55% |
6 Properties |
| 2020 | £281,444 | -19% |
9 Properties |
| 2019 | £333,750 | 6% |
11 Properties |
| 2018 | £312,916 | -8% |
6 Properties |
| 2017 | £338,750 | 49% |
2 Properties |
| 2016 | £171,500 | -25% |
1 Property |
| 2015 | £215,000 | -100% |
1 Property |
Property Price per Property Type in Budleigh & Raleigh
Here you can find historic sold price data in order to help with your property search.
The average Property Paid Price for specific property types in the last three years are:
| Property Type | Average Sold Price | Sold Properties |
|---|---|---|
| Terraced House | £590,000.00 | 2 Terraced Houses |
| Semi Detached House | £313,000.00 | 2 Semi Detached Houses |
| Flat | £310,000.00 | 1 Flat |
