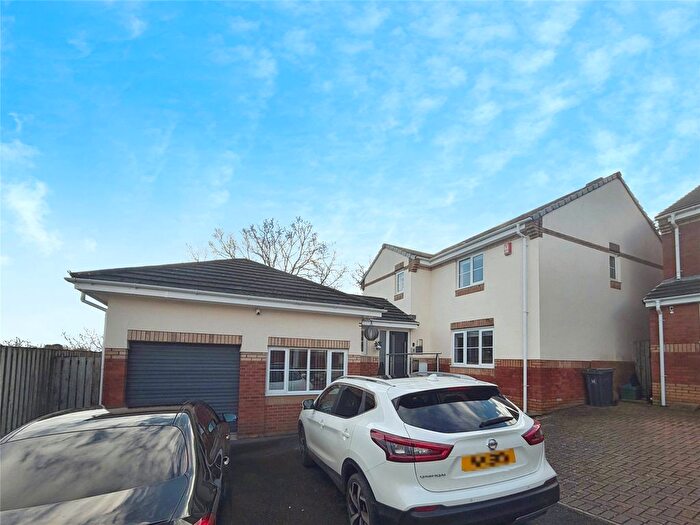
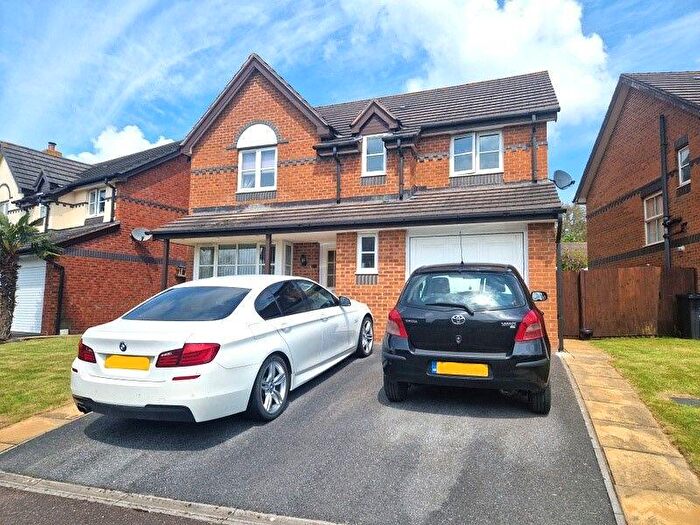
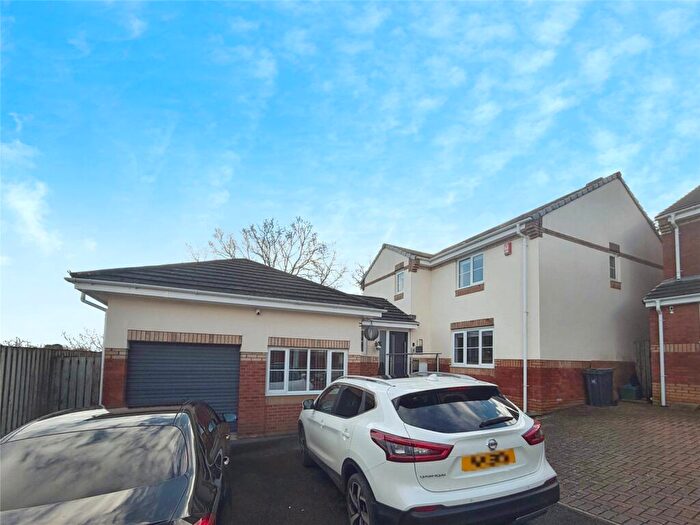
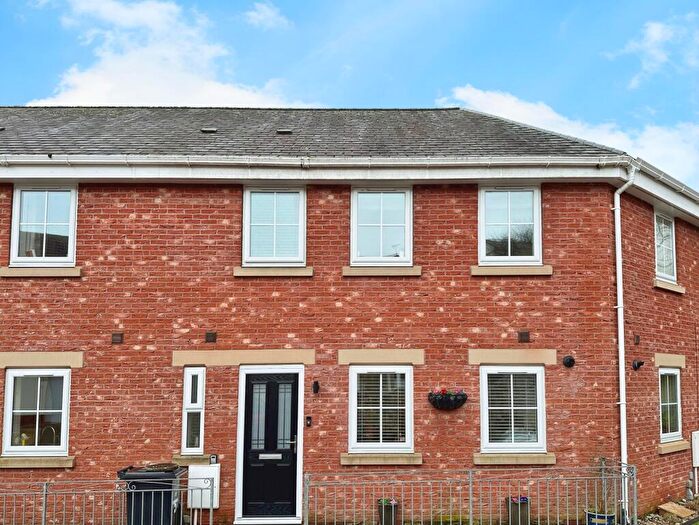
Houses for sale & to rent in Exmouth Brixington, Exmouth
House Prices in Exmouth Brixington
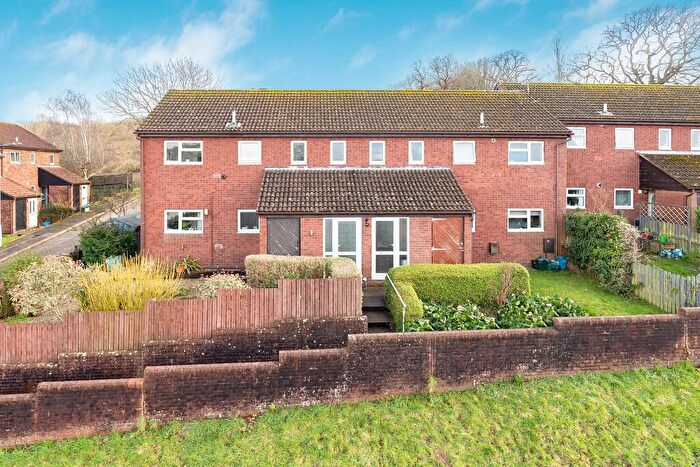
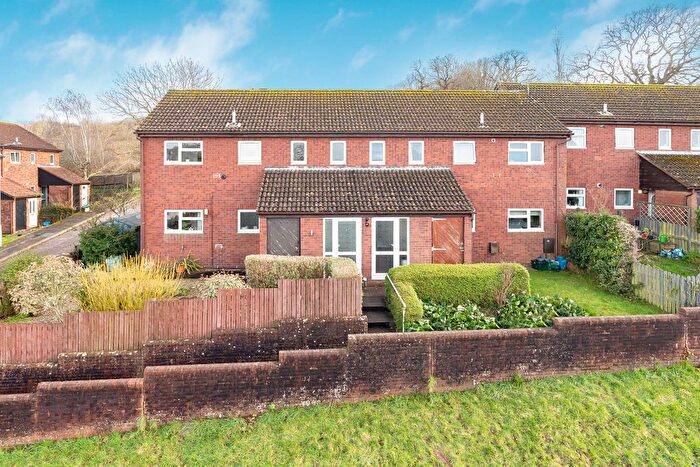
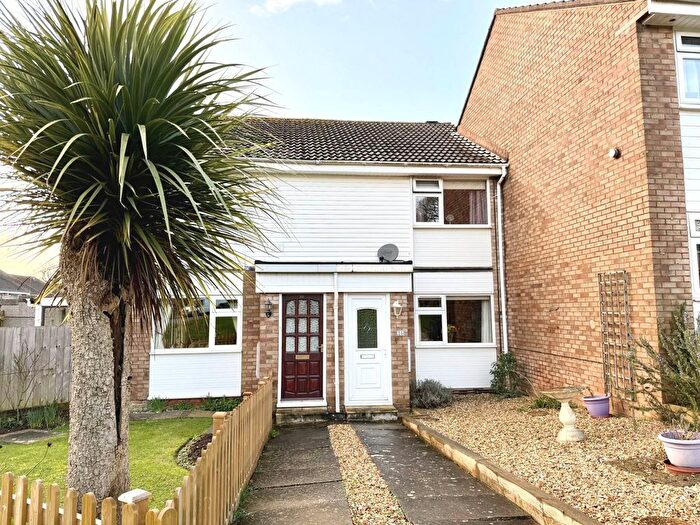
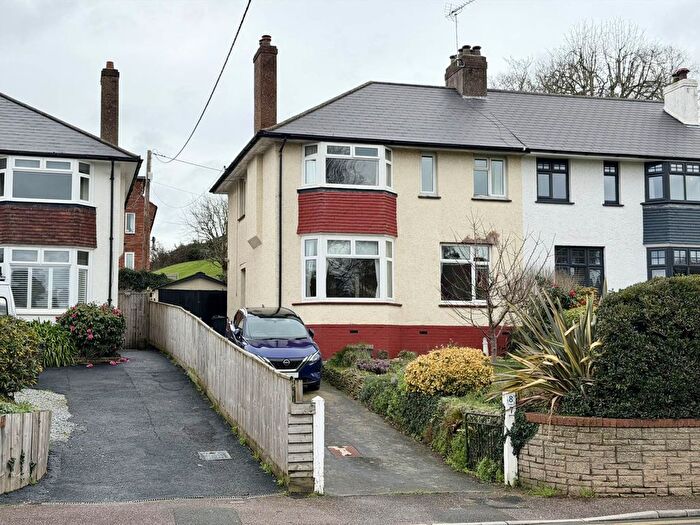
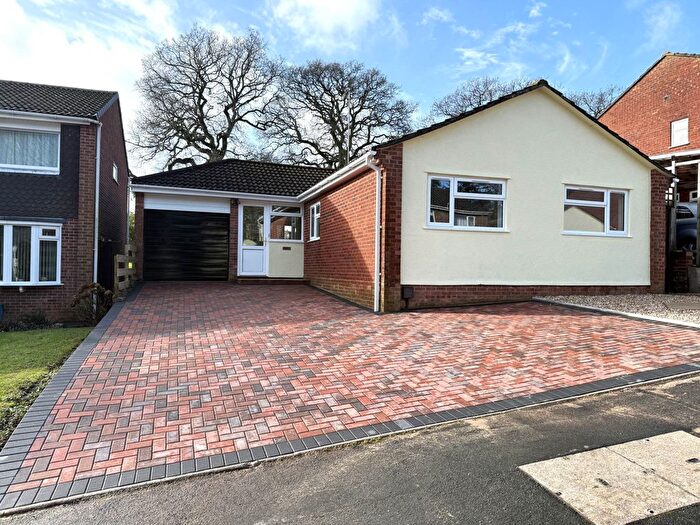
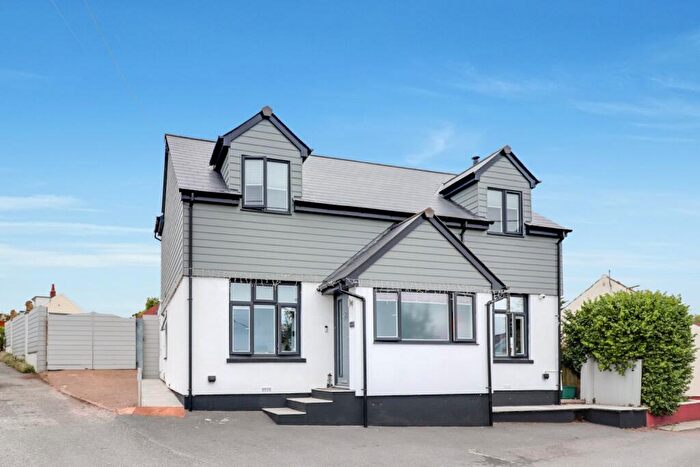
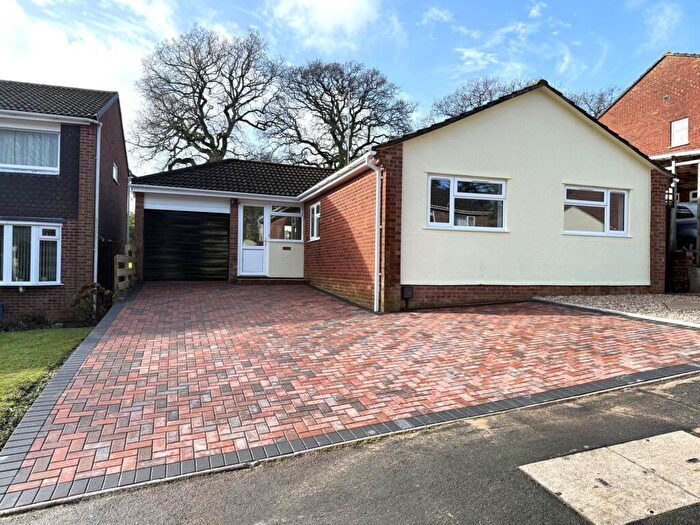
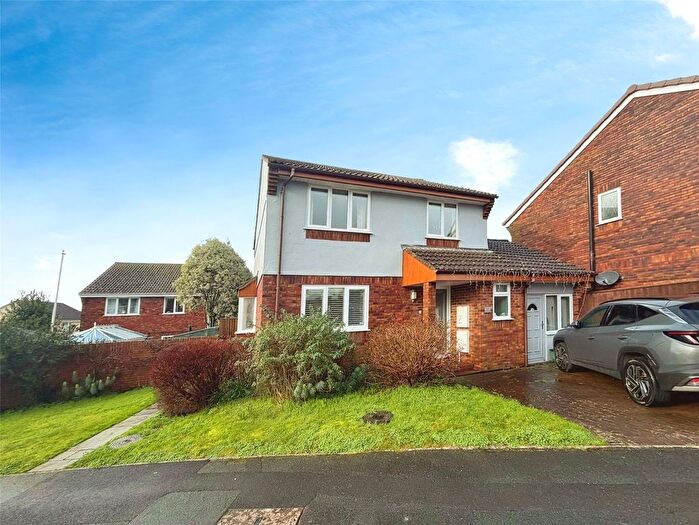
Properties in Exmouth Brixington have an average house price of £382,100.00 and had 249 Property Transactions within the last 3 years¹.
Exmouth Brixington is an area in Exmouth, Devon with 2,718 households², where the most expensive property was sold for £1,350,000.00.
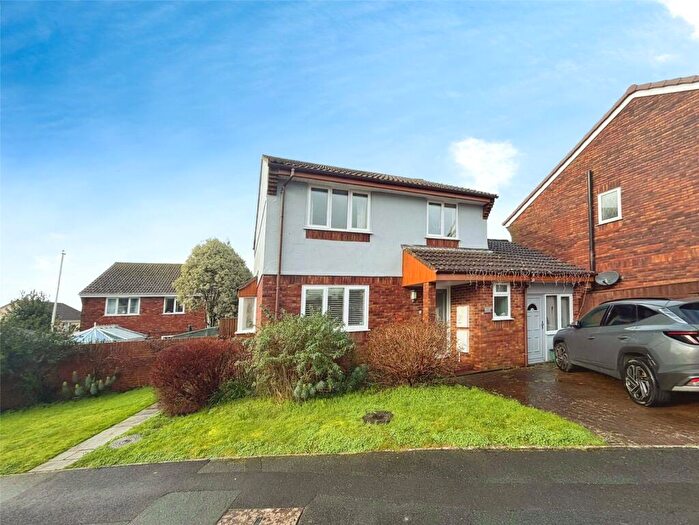
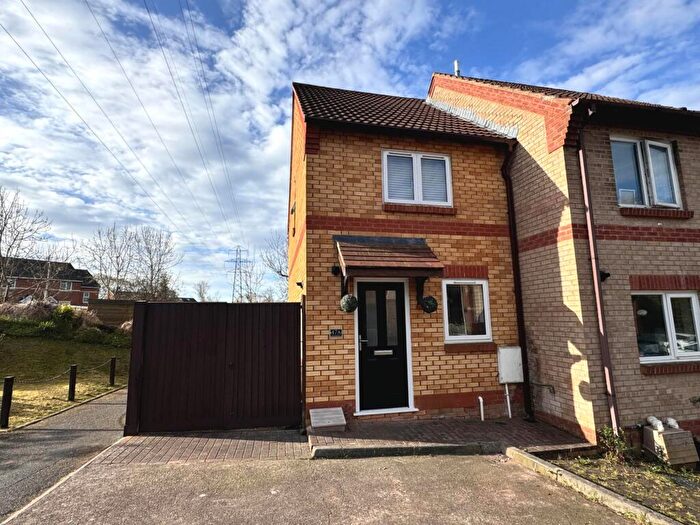
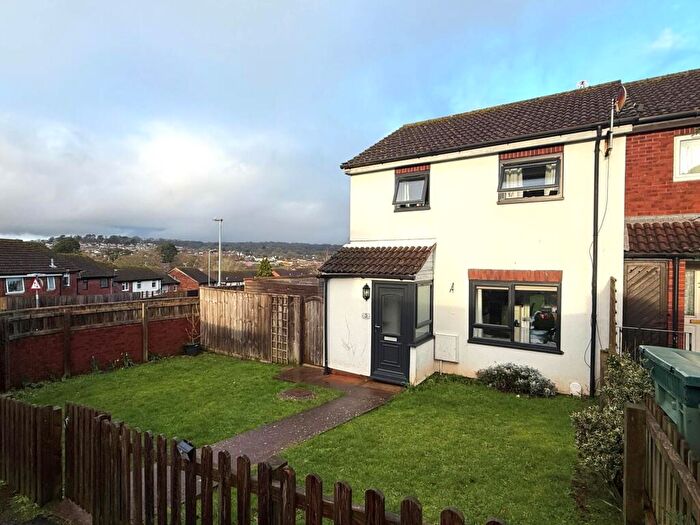
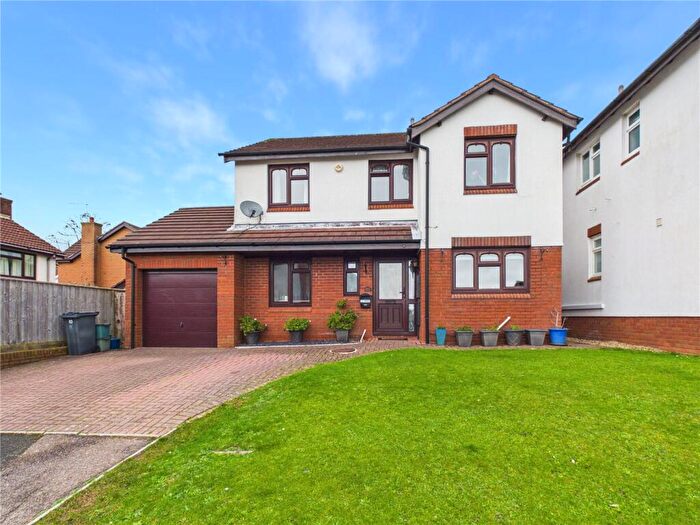
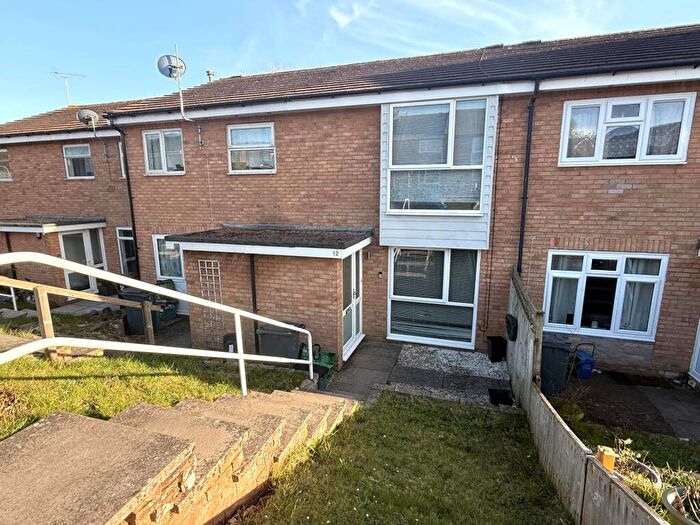
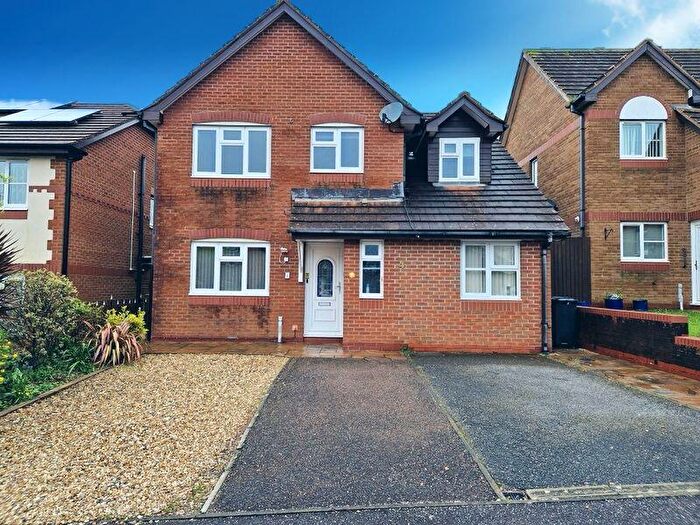
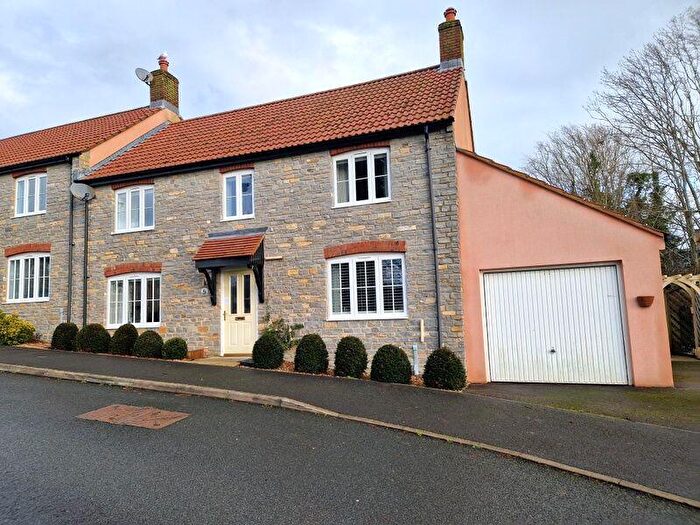
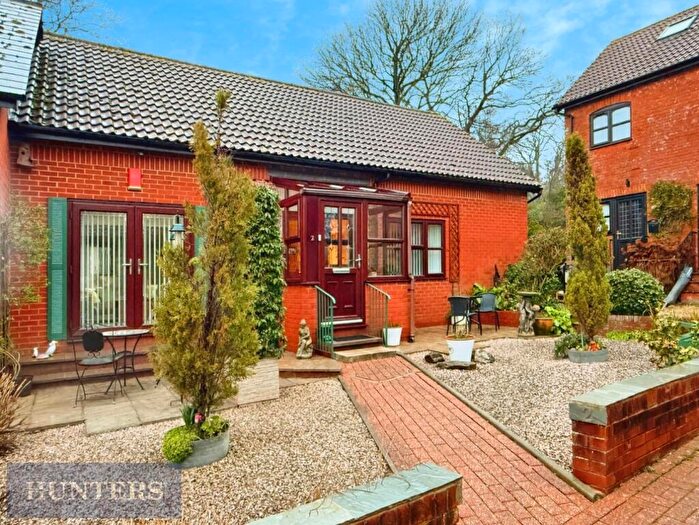
Properties for sale in Exmouth Brixington
Roads and Postcodes in Exmouth Brixington
Navigate through our locations to find the location of your next house in Exmouth Brixington, Exmouth for sale or to rent.
| Streets | Postcodes |
|---|---|
| Admirals Walk | EX8 4DP |
| Albany Close | EX8 4EG |
| Anson Road | EX8 4NY |
| Arthurs Close | EX8 4JZ |
| Bassetts Gardens | EX8 4EE |
| Birchwood Road | EX8 4LG EX8 4LH EX8 4LL EX8 4LS EX8 4LW |
| Bradford Close | EX8 5PF |
| Brixington Drive | EX8 4HJ EX8 4HL |
| Brixington Lane | EX8 4HN EX8 4JF EX8 4JG EX8 4JQ EX8 5DL |
| Brixington Parade | EX8 4JS |
| Broadmead | EX8 4JR EX8 4JU |
| Bunn Road | EX8 5PP |
| Bystock Mews | EX8 5EP |
| Canterbury Way | EX8 5QH EX8 5QJ EX8 5QQ |
| Cedar Close | EX8 5NT |
| Cheriswood Avenue | EX8 4HG |
| Cheriswood Close | EX8 4DZ |
| Cherry Close | EX8 5PR |
| Cheshire Road | EX8 4BN |
| Chestnut Close | EX8 5NG |
| Churchill Road | EX8 4DN EX8 4DR EX8 4DT EX8 4DU EX8 4JJ EX8 4DL EX8 4JH |
| Cliston Avenue | EX8 4LJ |
| Combourg Close | EX8 5RG |
| Cunningham Road | EX8 4DS |
| Diane Close | EX8 5QG |
| Dorchester Way | EX8 5QE |
| Durham Close | EX8 5QU |
| Ellwood Road | EX8 4LE |
| Evergreen Close | EX8 4RR |
| Evran Drive | EX8 5RQ |
| Flora Close | EX8 4FA |
| Fraser Road | EX8 4DH |
| Frobisher Road | EX8 4NZ |
| Gibson Close | EX8 4BT |
| Gloucester Road | EX8 5QR |
| Goldcrest Road | EX8 5FP |
| Gorse Lane | EX8 5PS |
| Greenpark Road | EX8 4JL EX8 4JN EX8 4JT |
| Haley Close | EX8 4PJ |
| Harwood Close | EX8 4DG |
| Hereford Close | EX8 5QT |
| Higher Marley Road | EX8 5DT |
| Hillcrest Gardens | EX8 4FF |
| Holly Walk | EX8 5PU |
| Ivydale | EX8 4JX EX8 4TA |
| Jubilee Drive | EX8 5PA |
| Laburnum Close | EX8 5PT |
| Larch Close | EX8 5NQ |
| Lime Grove | EX8 5NN EX8 5NP EX8 5NW |
| Lincoln Close | EX8 5QN |
| Linden Close | EX8 4JW |
| Little Meadow | EX8 4LU |
| Lovell Close | EX8 4PW |
| Maple Drive | EX8 5NR |
| Marcus Road | EX8 4DB |
| Marions Way | EX8 4LF |
| Marlborough Close | EX8 4NA |
| Marley Road | EX8 5DW |
| Martins Road | EX8 4LN |
| Mountbatten Close | EX8 4DJ |
| Nasmith Close | EX8 4DQ |
| Norman Close | EX8 4JY |
| Norwich Close | EX8 5QW |
| Oakwood Rise | EX8 4PU |
| Old Bystock Drive | EX8 5EQ EX8 5RB |
| Oxford Close | EX8 5QP |
| Palm Close | EX8 5NZ |
| Parkside Drive | EX8 4LA EX8 4LB EX8 4LD EX8 4LT EX8 4LX EX8 4LZ |
| Partridge Road | EX8 4PH |
| Pines Road | EX8 5NH EX8 5NJ EX8 5NL EX8 5NU |
| Poplar Close | EX8 5NX |
| Port Mer Close | EX8 5RF |
| Rance Drive | EX8 5RP |
| Read Close | EX8 4PY |
| Redwing Avenue | EX8 5FN |
| Redwood Close | EX8 5NS |
| Richards Close | EX8 4LQ |
| Sherwood Drive | EX8 4PX |
| Shirley Close | EX8 5QB |
| Silverdale | EX8 4NB |
| Somerville Close | EX8 4DW |
| Spencer Close | EX8 4LP |
| Spiders Lane | EX8 4PL EX8 4PN EX8 5NE |
| Spruce Close | EX8 5NY |
| St Briac Way | EX8 5RL EX8 5RN |
| St Johns Road | EX8 4DD EX8 4EB EX8 4EF EX8 4EH EX8 4EW EX8 4GA EX8 4FB |
| St Malo Close | EX8 5RH |
| St Sevan Way | EX8 5RE |
| Stanley Walk | EX8 5QD |
| The Common | EX8 5EA |
| The Common Road | EX8 5ED |
| The Marles | EX8 4NX |
| Trelivan Close | EX8 5RJ |
| Truro Drive | EX8 5QF |
| Valley Way | EX8 4PD EX8 4RL |
| Vansittart Drive | EX8 5PD |
| Vernon Road | EX8 4JP |
| Walls Close | EX8 4LY |
| Warneford Gardens | EX8 4EN |
| Wells Close | EX8 5QL |
| Westminster Close | EX8 5QS |
| Willoughby Close | EX8 5PE |
| Winchester Drive | EX8 5QA |
| Winston Road | EX8 4LR |
| Withycombe Park Drive | EX8 4EJ EX8 4EL EX8 4EP |
| Wrights Lane | EX8 5EB |
| Yew Tree Close | EX8 5NF |
| York Close | EX8 4EQ |
Transport near Exmouth Brixington
- FAQ
- Price Paid By Year
- Property Type Price
Frequently asked questions about Exmouth Brixington
What is the average price for a property for sale in Exmouth Brixington?
The average price for a property for sale in Exmouth Brixington is £382,100. This amount is 6% higher than the average price in Exmouth. There are 1,438 property listings for sale in Exmouth Brixington.
What streets have the most expensive properties for sale in Exmouth Brixington?
The streets with the most expensive properties for sale in Exmouth Brixington are Higher Marley Road at an average of £986,250, Marley Road at an average of £809,166 and Old Bystock Drive at an average of £726,000.
What streets have the most affordable properties for sale in Exmouth Brixington?
The streets with the most affordable properties for sale in Exmouth Brixington are Willoughby Close at an average of £215,333, Broadmead at an average of £239,400 and Chestnut Close at an average of £240,000.
Which train stations are available in or near Exmouth Brixington?
Some of the train stations available in or near Exmouth Brixington are Exmouth, Lympstone Village and Starcross.
Property Price Paid in Exmouth Brixington by Year
The average sold property price by year was:
| Year | Average Sold Price | Price Change |
Sold Properties
|
|---|---|---|---|
| 2025 | £366,225 | -5% |
91 Properties |
| 2024 | £383,915 | -4% |
82 Properties |
| 2023 | £399,150 | 1% |
76 Properties |
| 2022 | £393,659 | 16% |
115 Properties |
| 2021 | £329,887 | 12% |
135 Properties |
| 2020 | £290,153 | 4% |
115 Properties |
| 2019 | £278,463 | -6% |
129 Properties |
| 2018 | £294,294 | 5% |
117 Properties |
| 2017 | £280,004 | 6% |
102 Properties |
| 2016 | £263,980 | 6% |
135 Properties |
| 2015 | £247,113 | 3% |
93 Properties |
| 2014 | £239,044 | 5% |
134 Properties |
| 2013 | £227,186 | -3% |
123 Properties |
| 2012 | £234,687 | 7% |
102 Properties |
| 2011 | £218,941 | 0,2% |
108 Properties |
| 2010 | £218,518 | 7% |
113 Properties |
| 2009 | £204,232 | -3% |
112 Properties |
| 2008 | £209,866 | -10% |
81 Properties |
| 2007 | £229,855 | 11% |
193 Properties |
| 2006 | £204,413 | 0,4% |
183 Properties |
| 2005 | £203,533 | 1% |
103 Properties |
| 2004 | £202,471 | 10% |
176 Properties |
| 2003 | £181,888 | 21% |
177 Properties |
| 2002 | £143,799 | 16% |
201 Properties |
| 2001 | £121,443 | 14% |
206 Properties |
| 2000 | £104,005 | 23% |
138 Properties |
| 1999 | £80,114 | 1% |
185 Properties |
| 1998 | £79,050 | 5% |
153 Properties |
| 1997 | £75,346 | 9% |
207 Properties |
| 1996 | £68,378 | 3% |
183 Properties |
| 1995 | £66,033 | - |
124 Properties |
Property Price per Property Type in Exmouth Brixington
Here you can find historic sold price data in order to help with your property search.
The average Property Paid Price for specific property types in the last three years are:
| Property Type | Average Sold Price | Sold Properties |
|---|---|---|
| Semi Detached House | £307,589.00 | 82 Semi Detached Houses |
| Detached House | £462,880.00 | 128 Detached Houses |
| Terraced House | £274,851.00 | 37 Terraced Houses |
| Flat | £251,250.00 | 2 Flats |

