Houses for sale & to rent in Cullompton South, Cullompton
House Prices in Cullompton South
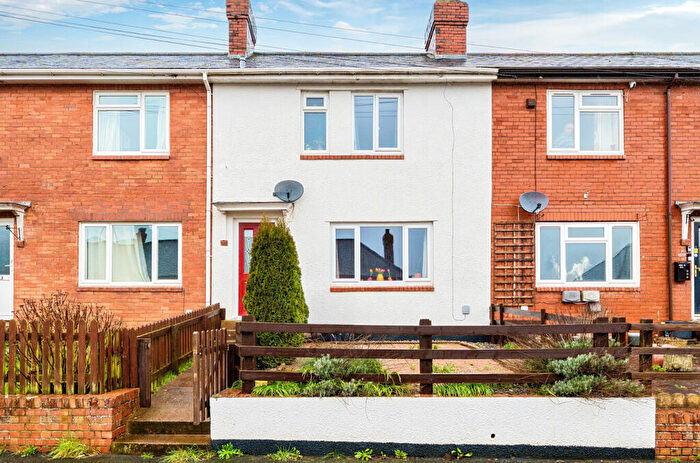
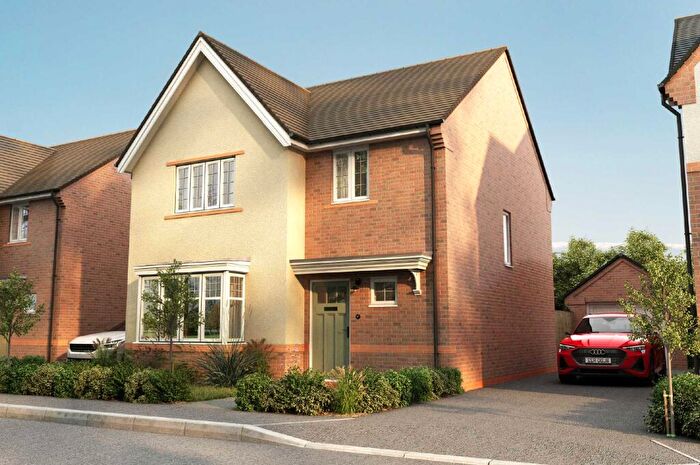
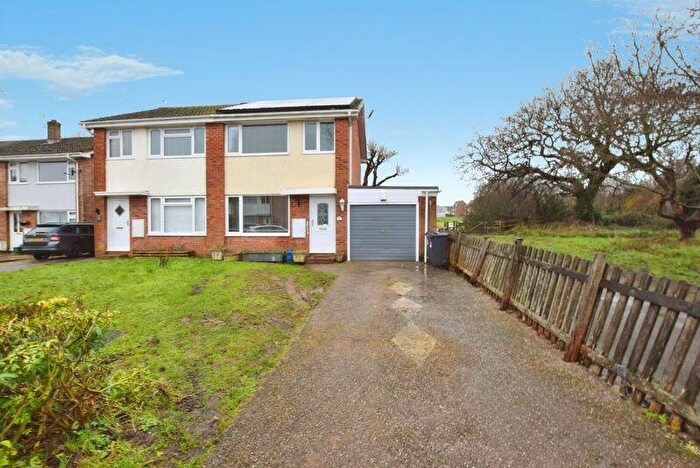
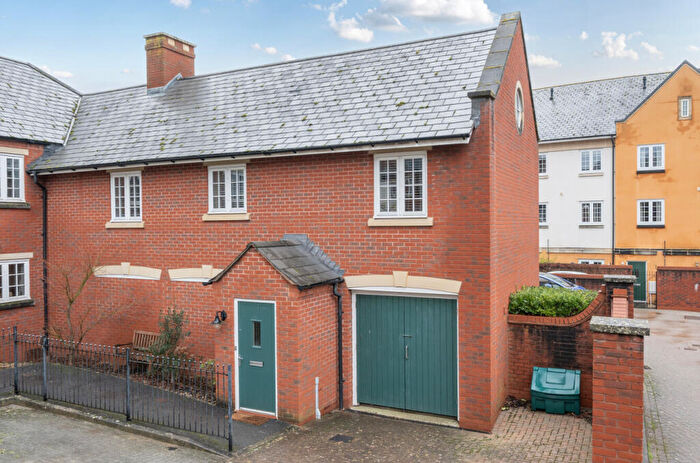
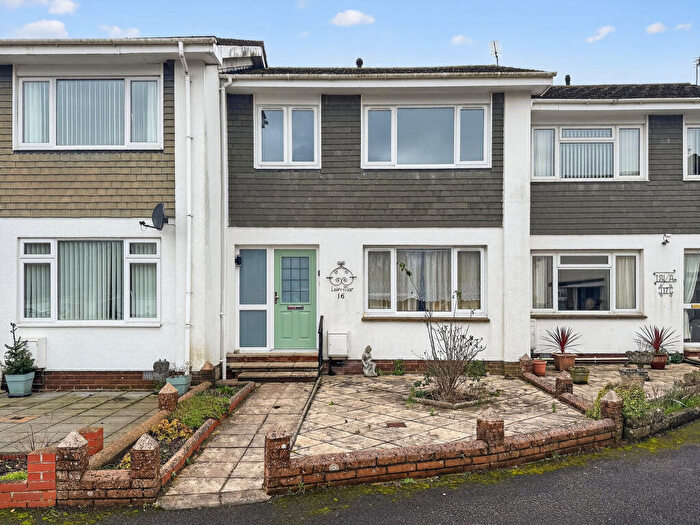
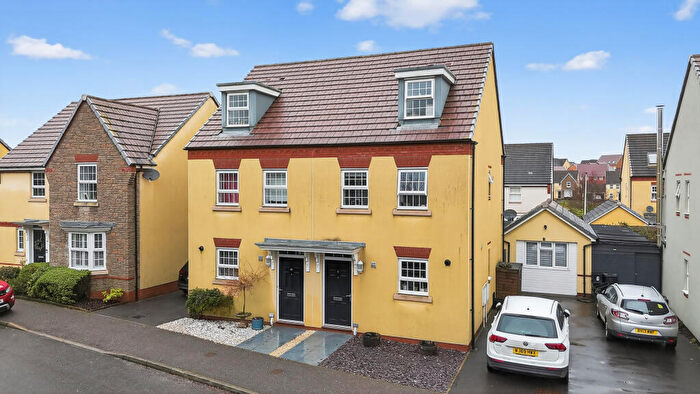
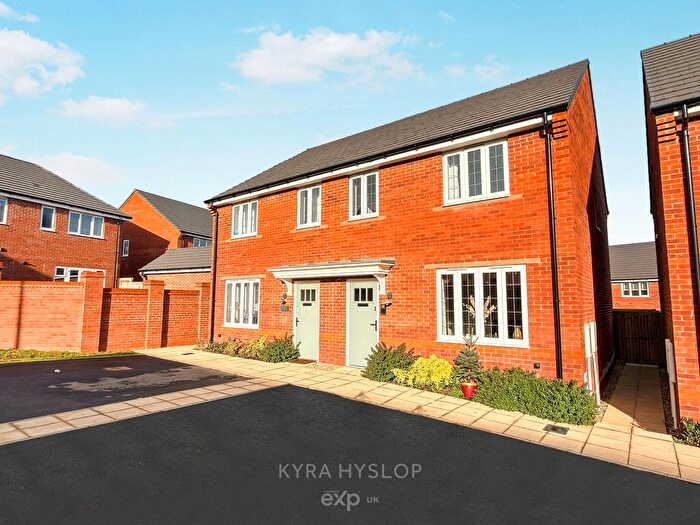
Properties in Cullompton South have an average house price of £259,583.00 and had 195 Property Transactions within the last 3 years¹.
Cullompton South is an area in Cullompton, Devon with 1,602 households², where the most expensive property was sold for £745,000.00.
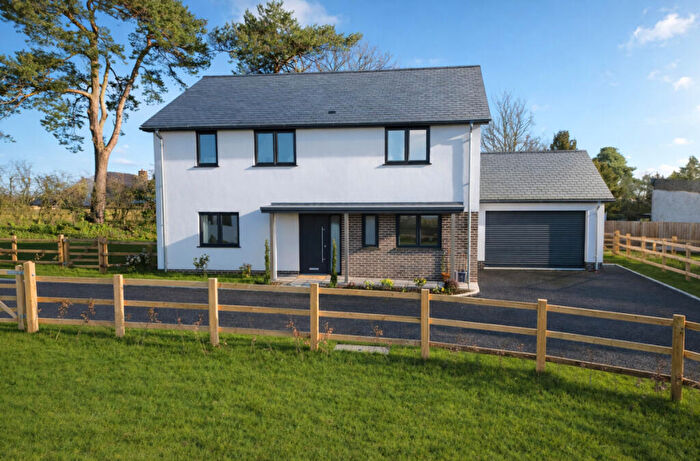
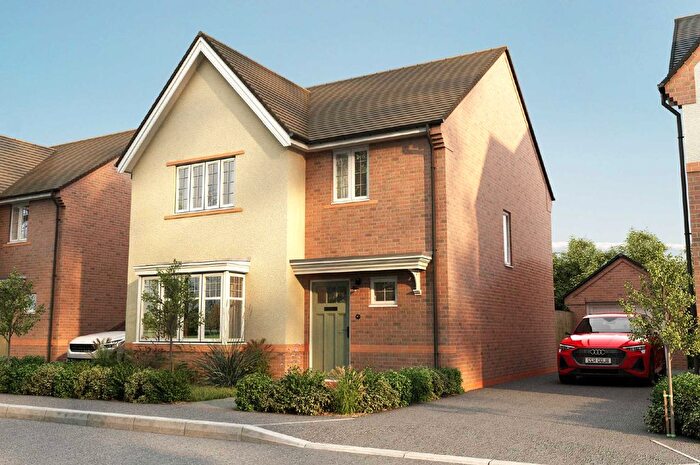
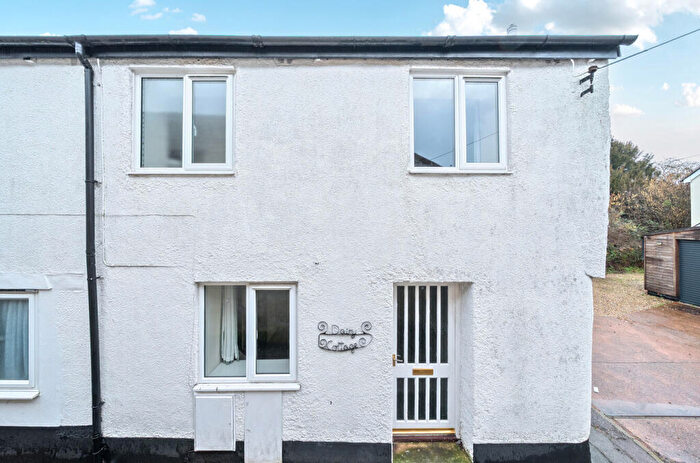
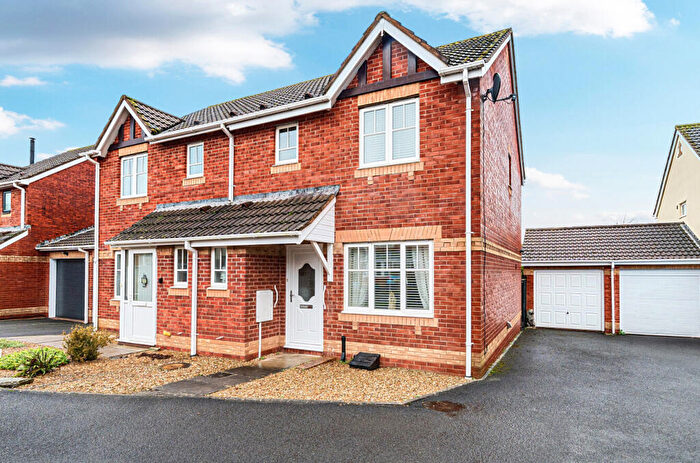
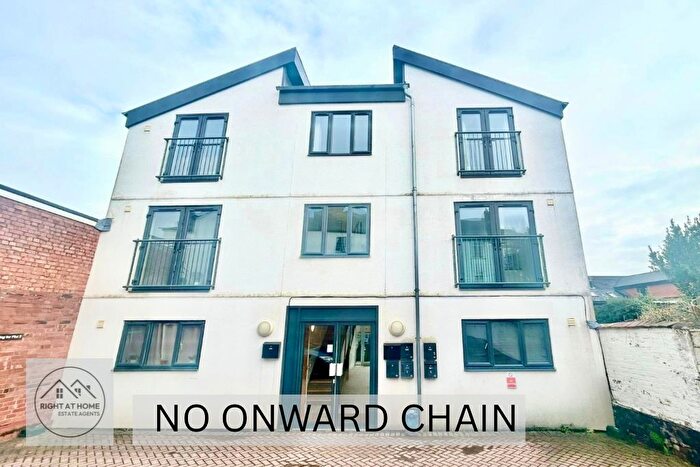
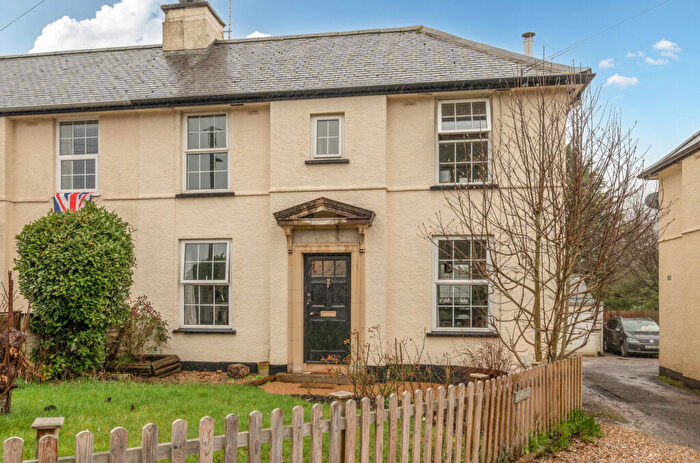
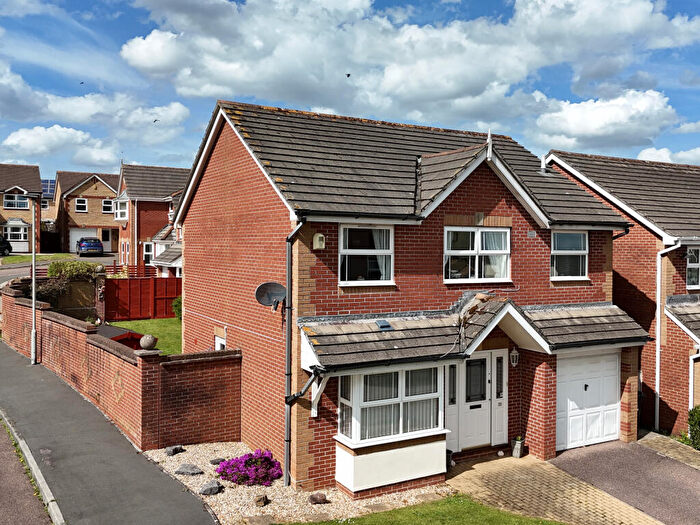
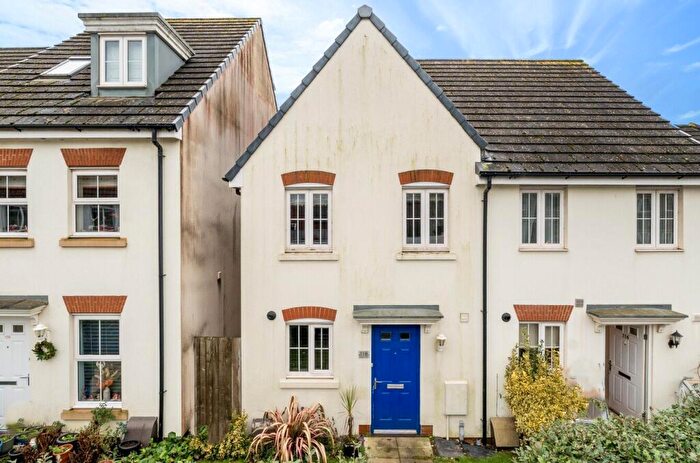
Properties for sale in Cullompton South
Roads and Postcodes in Cullompton South
Navigate through our locations to find the location of your next house in Cullompton South, Cullompton for sale or to rent.
| Streets | Postcodes |
|---|---|
| Appledore Close | EX15 1ER |
| Archers Close | EX15 1FA |
| Bakers Mews | EX15 1TL |
| Barley Close | EX15 1RS |
| Bilbie Close | EX15 1LG |
| Bockland Close | EX15 1JQ |
| Bowling Green View | EX15 1UQ |
| Cambridge Way | EX15 1GQ |
| Chaffinch Drive | EX15 1UJ |
| Clampitts | EX15 1EE |
| Clover Drive | EX15 1SH EX15 1SJ EX15 1SN EX15 1SR |
| Colebrooke Lane | EX15 1EB EX15 1PB |
| Cross Parks | EX15 1UR |
| Crow Bridge | EX15 1EL EX15 1EN EX15 1QZ |
| Crow Green | EX15 1EW |
| Crowbridge Park | EX15 1BU |
| Dove Close | EX15 1UL |
| Exeter Road | EX15 1DT EX15 1DZ EX15 1ED EX15 1EF |
| Forcefield Road | EX15 1QB |
| Fore Street | EX15 1JL EX15 1LB EX15 1LF EX15 1BP EX15 1GS EX15 1JH EX15 1LD |
| Fulford Drive | EX15 1RP |
| Gatehouse Close | EX15 1JJ |
| Goldfinch Grove | EX15 1UG |
| Hammett Road | EX15 1HP EX15 1HR |
| Hawthorn Close | EX15 1SL |
| Haymans Close | EX15 1EH |
| Haymans Green | EX15 1XZ |
| Heron Way | EX15 1TD |
| Heyridge Meadow | EX15 1FD |
| Kingfisher Gardens | EX15 1UA |
| Knowle Close | EX15 1TF |
| Langlands Road | EX15 1JB EX15 1JD EX15 1JE EX15 1JF |
| Lapwing Close | EX15 1UX |
| Leatway Gardens | EX15 1LJ |
| Linnet Dene | EX15 1UF |
| Manitoba Gardens | EX15 1EZ |
| Manning Avenue | EX15 1QE |
| Martin Way | EX15 1GU |
| Mead Close | EX15 1RT |
| New Cut | EX15 1HF |
| New Inn Court | EX15 1LE |
| New Street | EX15 1HA EX15 1HD |
| Nightingale Lawns | EX15 1UB |
| Orchard Way | EX15 1EJ |
| Padbrook Mews | EX15 1TN |
| Parlour Mead | EX15 1GP |
| Ploudal Road | EX15 1TB |
| Redland Way | EX15 1GJ |
| Reeds Place | EX15 1LA |
| Roberts Close | EX15 1QA |
| Robin Close | EX15 1UN |
| Salway Close | EX15 1LQ |
| Shortlands Lane | EX15 1HE EX15 1HG |
| Shortlands Road | EX15 1HJ EX15 1HL EX15 1HN EX15 1HQ EX15 1HW |
| Siskin Chase | EX15 1UD |
| Spicer Close | EX15 1QD |
| Spindlebury | EX15 1SY |
| Starlings Roost | EX15 1UE |
| Swallow Way | EX15 1GE EX15 1GH |
| Tanners Close | EX15 1SW |
| The Green | EX15 1FX EX15 1GD |
| The New Cut | EX15 1GA |
| Tiverton Road | EX15 1JG EX15 1LW EX15 1HS |
| Trott Close | EX15 1GX |
| Vickery Close | EX15 1HB |
| Weavers Walk | EX15 1SS |
| Wheatfield Close | EX15 1RR |
| Woolcott Way | EX15 1SP |
| EX15 1HH EX15 1RU EX15 1WZ EX15 2YH EX15 9AT EX15 9AU EX15 9AX EX15 9AZ EX15 9BD EX15 9BF EX15 9BG |
Transport near Cullompton South
-
Tiverton Parkway Station
-
Whimple Station
-
Feniton Station
-
Cranbrook Station
-
Pinhoe Station
-
Polsloe Bridge Station
-
Newton St.Cyres Station
- FAQ
- Price Paid By Year
- Property Type Price
Frequently asked questions about Cullompton South
What is the average price for a property for sale in Cullompton South?
The average price for a property for sale in Cullompton South is £259,583. This amount is 22% lower than the average price in Cullompton. There are 1,285 property listings for sale in Cullompton South.
What streets have the most expensive properties for sale in Cullompton South?
The streets with the most expensive properties for sale in Cullompton South are Trott Close at an average of £475,000, Linnet Dene at an average of £407,750 and Spindlebury at an average of £387,500.
What streets have the most affordable properties for sale in Cullompton South?
The streets with the most affordable properties for sale in Cullompton South are Fore Street at an average of £82,000, Appledore Close at an average of £90,000 and Bowling Green View at an average of £118,750.
Which train stations are available in or near Cullompton South?
Some of the train stations available in or near Cullompton South are Tiverton Parkway, Whimple and Feniton.
Property Price Paid in Cullompton South by Year
The average sold property price by year was:
| Year | Average Sold Price | Price Change |
Sold Properties
|
|---|---|---|---|
| 2025 | £276,755 | 11% |
57 Properties |
| 2024 | £247,162 | -5% |
79 Properties |
| 2023 | £259,624 | -6% |
59 Properties |
| 2022 | £274,648 | 13% |
66 Properties |
| 2021 | £238,573 | -5% |
100 Properties |
| 2020 | £250,947 | 17% |
69 Properties |
| 2019 | £207,766 | 1% |
67 Properties |
| 2018 | £205,521 | -2% |
92 Properties |
| 2017 | £209,599 | 1% |
123 Properties |
| 2016 | £208,307 | 11% |
111 Properties |
| 2015 | £186,087 | -3% |
96 Properties |
| 2014 | £192,436 | -1% |
119 Properties |
| 2013 | £194,709 | 12% |
112 Properties |
| 2012 | £171,898 | 1% |
116 Properties |
| 2011 | £169,767 | -1% |
48 Properties |
| 2010 | £170,748 | 10% |
54 Properties |
| 2009 | £153,145 | -13% |
61 Properties |
| 2008 | £172,542 | 0,2% |
38 Properties |
| 2007 | £172,253 | 6% |
102 Properties |
| 2006 | £161,963 | 6% |
123 Properties |
| 2005 | £151,482 | -4% |
95 Properties |
| 2004 | £157,742 | 20% |
98 Properties |
| 2003 | £126,325 | 11% |
130 Properties |
| 2002 | £112,196 | 22% |
101 Properties |
| 2001 | £87,885 | 10% |
110 Properties |
| 2000 | £79,115 | 14% |
149 Properties |
| 1999 | £68,102 | -2% |
129 Properties |
| 1998 | £69,185 | 7% |
167 Properties |
| 1997 | £64,616 | 6% |
162 Properties |
| 1996 | £60,836 | 4% |
125 Properties |
| 1995 | £58,516 | - |
97 Properties |
Property Price per Property Type in Cullompton South
Here you can find historic sold price data in order to help with your property search.
The average Property Paid Price for specific property types in the last three years are:
| Property Type | Average Sold Price | Sold Properties |
|---|---|---|
| Semi Detached House | £254,458.00 | 50 Semi Detached Houses |
| Detached House | £382,742.00 | 50 Detached Houses |
| Terraced House | £209,629.00 | 80 Terraced Houses |
| Flat | £132,558.00 | 15 Flats |

