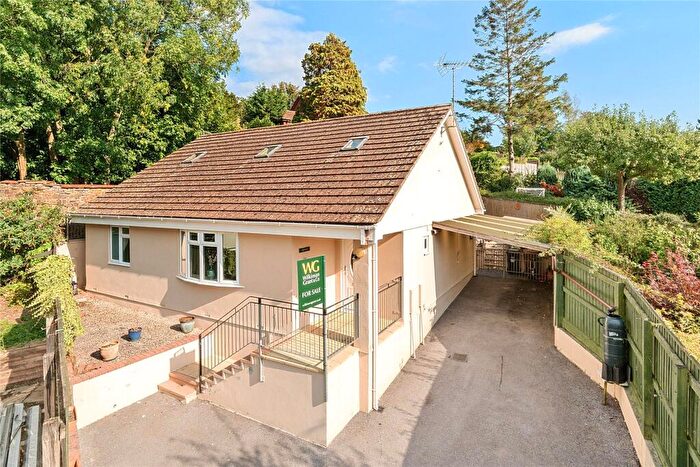
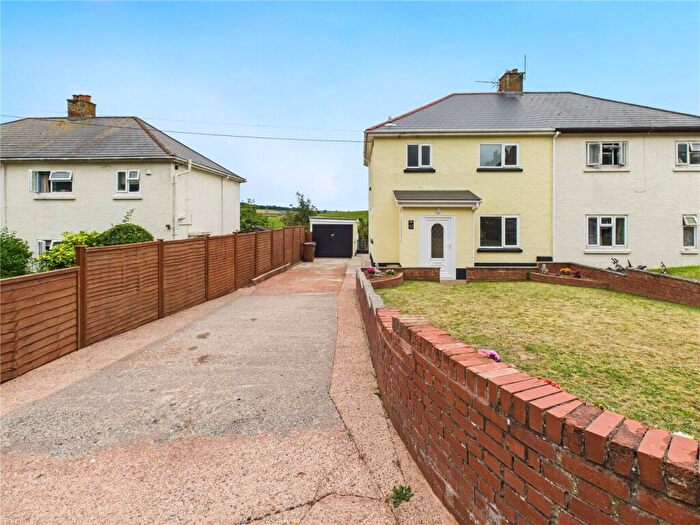
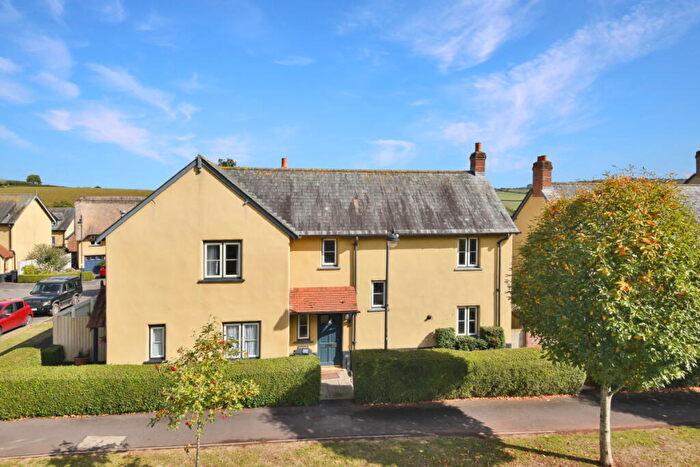
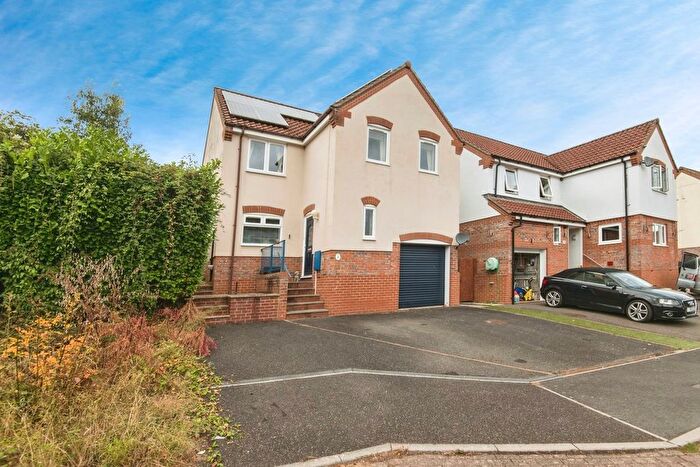
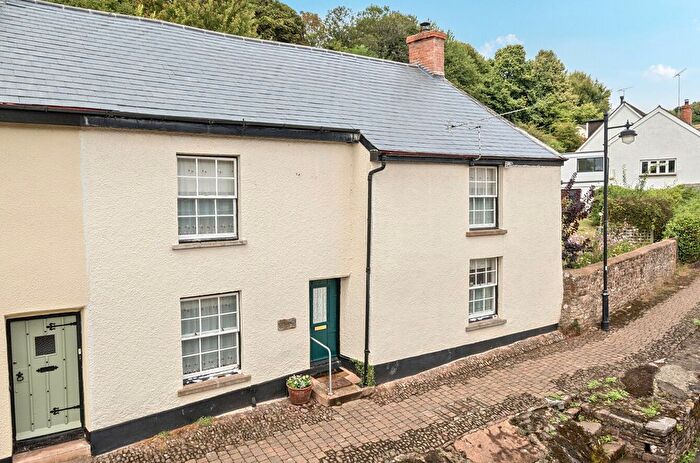
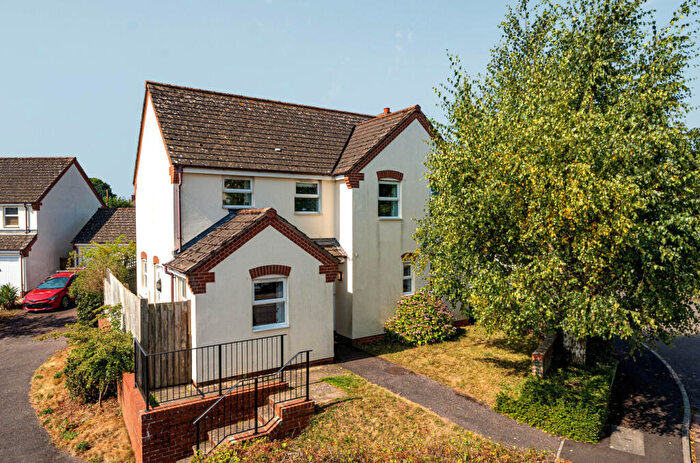
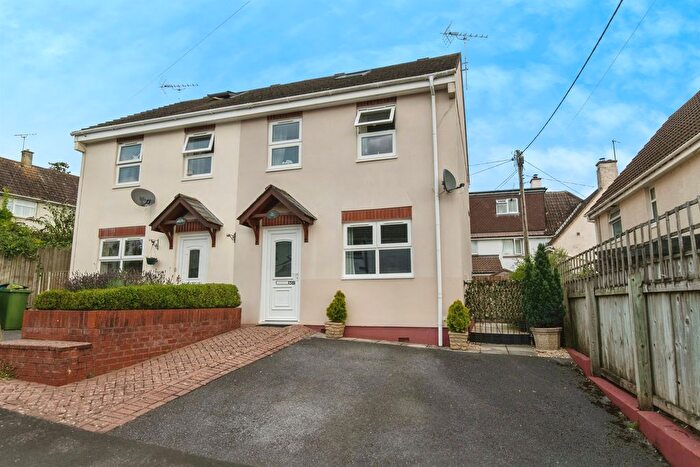
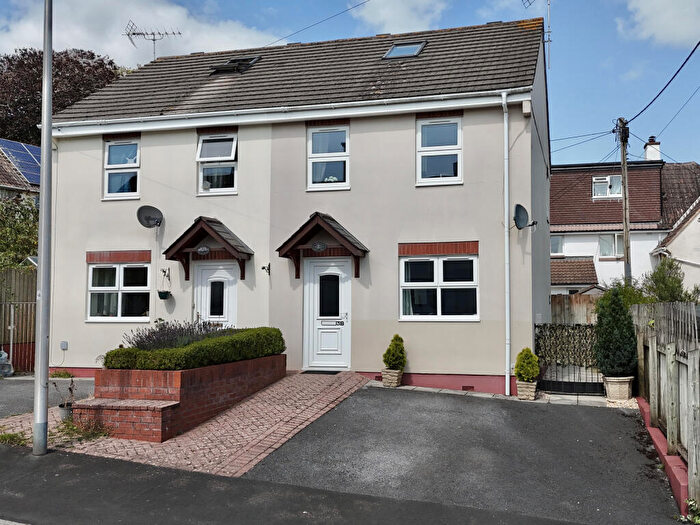
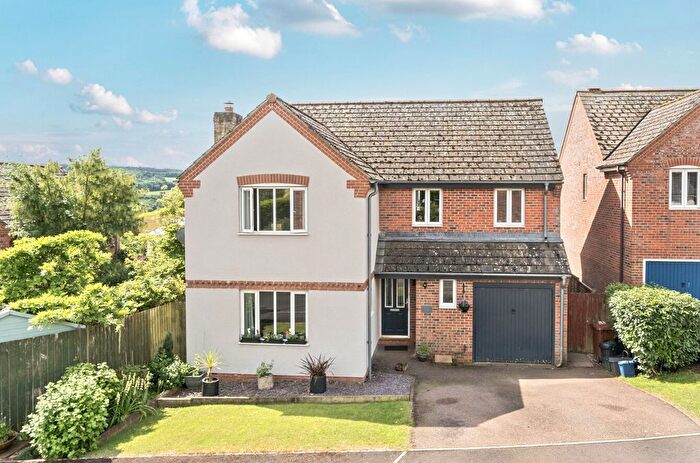
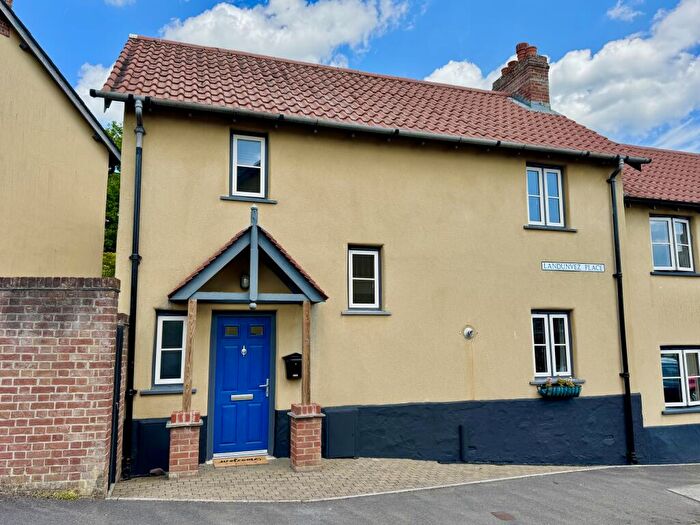
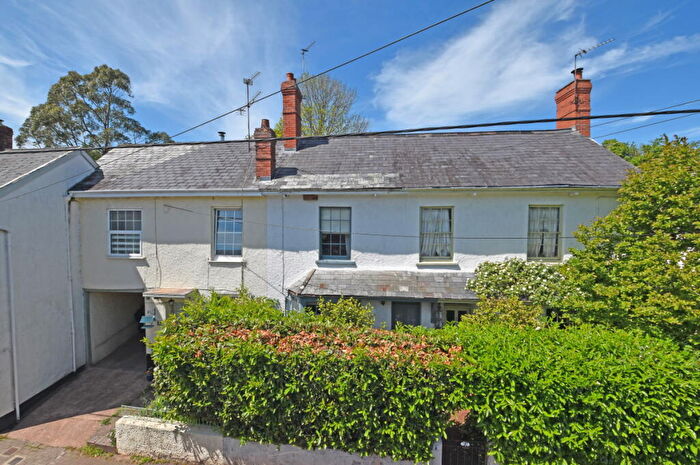
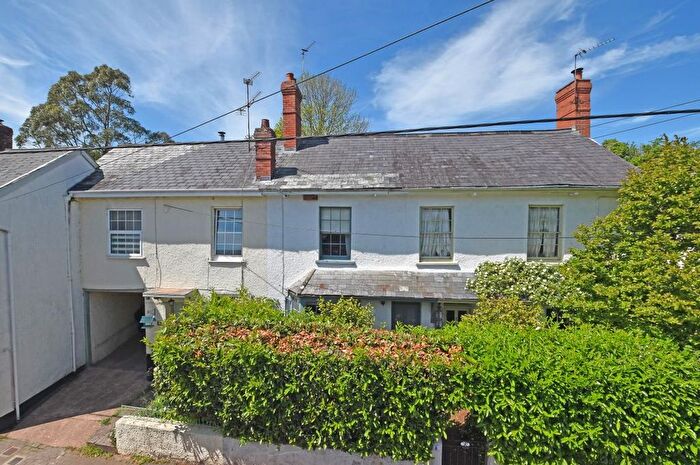
Houses for sale & to rent in Bradninch, Exeter
House Prices in Bradninch
Properties in Bradninch have an average house price of £328,327.00 and had 74 Property Transactions within the last 3 years¹.
Bradninch is an area in Exeter, Devon with 831 households², where the most expensive property was sold for £967,000.00.
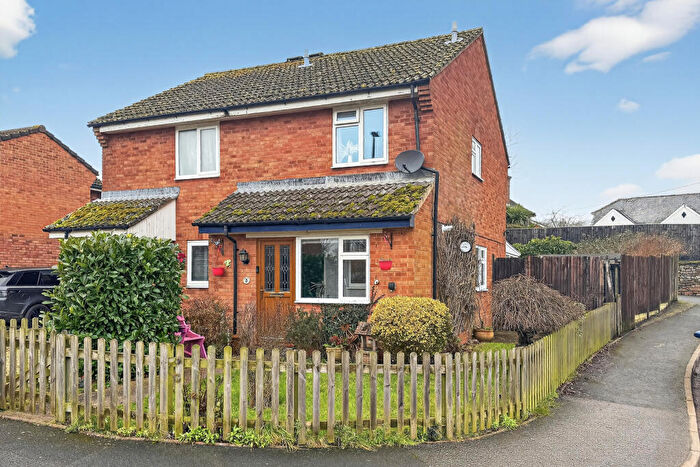
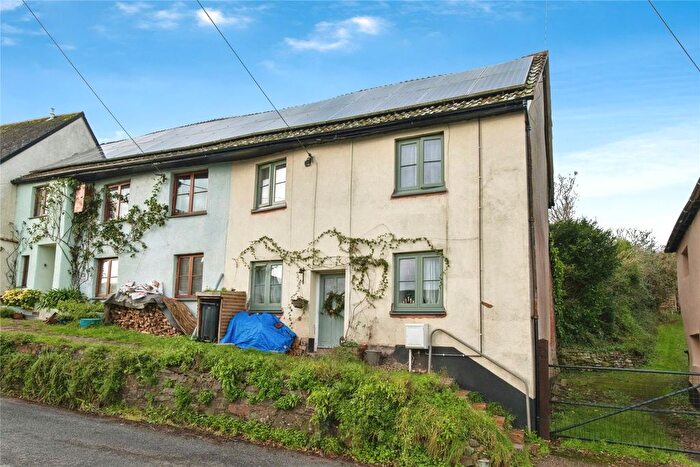
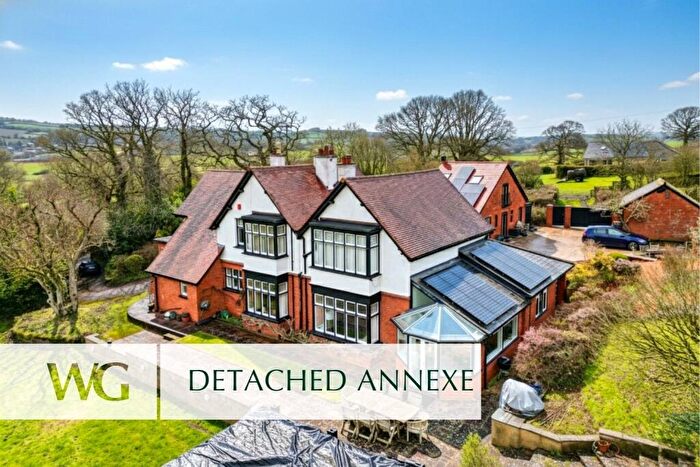
Properties for sale in Bradninch
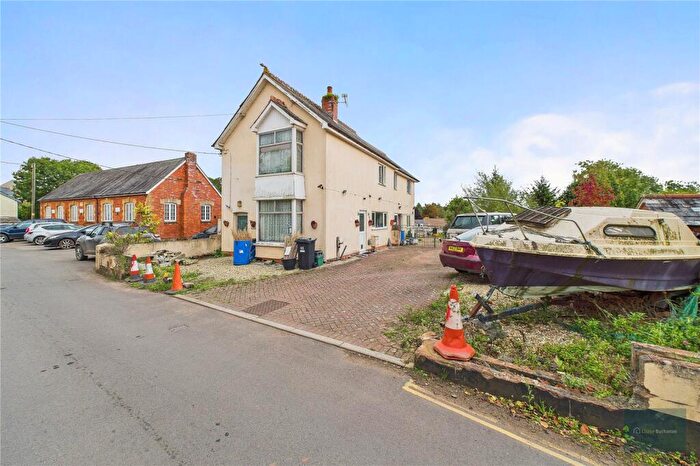
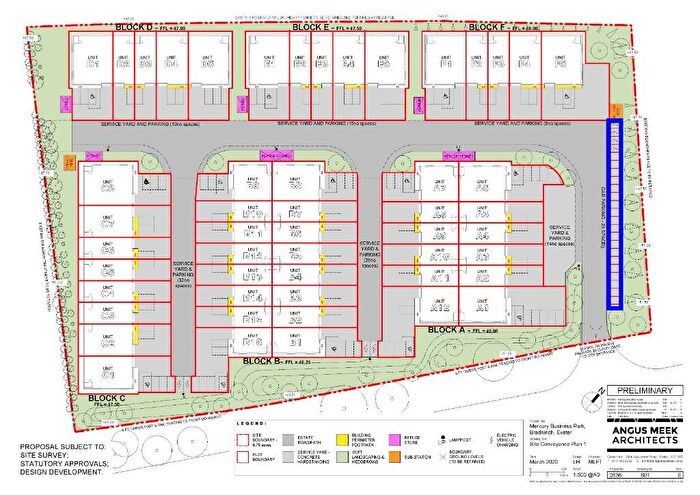
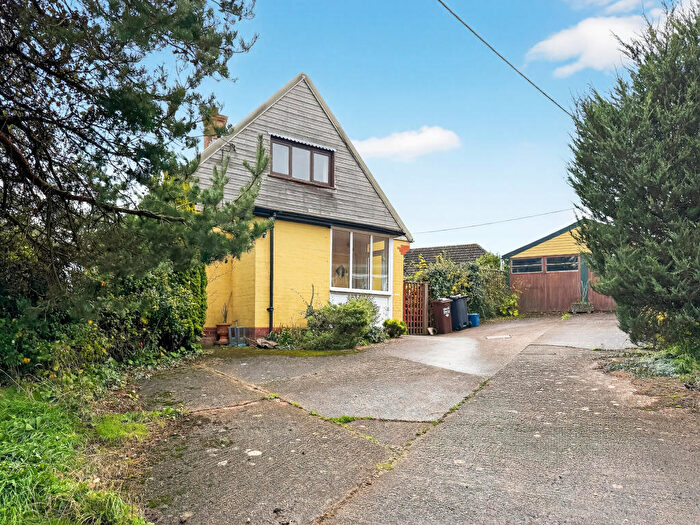
Previously listed properties in Bradninch
Roads and Postcodes in Bradninch
Navigate through our locations to find the location of your next house in Bradninch, Exeter for sale or to rent.
| Streets | Postcodes |
|---|---|
| Ash Cross | EX5 4PA |
| Backstreet | EX5 4NE |
| Barns Close | EX5 4QJ |
| Beacon Hill | EX5 4LP EX5 4LR |
| Beacon Road | EX5 4NT |
| Bowhill Cottages | EX5 4LH |
| Bowley Meadows | EX5 4RF |
| Charwell Meadow | EX5 4QH EX5 4QQ |
| Church Street | EX5 4NS |
| Copydown Lane | EX5 4LZ |
| Cross Cottages | EX5 4NB |
| Cullompton Hill | EX5 4NP |
| Culver Close | EX5 4NY |
| Dukes Orchard | EX5 4RA |
| Fore Street | EX5 4NN |
| Heggadon Close | EX5 4NQ |
| Hele Road | EX5 4PE EX5 4QN EX5 4QX EX5 4QZ |
| Hele Square | EX5 4PN |
| Hen Street | EX5 4NR |
| High Street | EX5 4NJ EX5 4QL |
| Hornbeam Gardens | EX5 4NZ |
| Jubilee Road | EX5 4PF |
| Kensham Close | EX5 4ND |
| Landunvez Place | EX5 4PB |
| Millway | EX5 4NL EX5 4RB |
| Millway Gardens | EX5 4RE |
| Newhaven | EX5 4NU |
| Parsonage Street | EX5 4NW EX5 4BQ |
| Passmore Road | EX5 4QT |
| Peter Street | EX5 4NX |
| Stony Lane | EX5 4LW |
| Strathculm Road | EX5 4PR |
| Townlands | EX5 4QR EX5 4QY |
| West End Road | EX5 4QP EX5 4QS EX5 4QW |
| Westfield | EX5 4QU |
| EX5 4DF EX5 4PQ EX5 4RD EX5 4PH EX5 4BN |
Transport near Bradninch
-
Whimple Station
-
Cranbrook Station
-
Pinhoe Station
-
Feniton Station
-
Tiverton Parkway Station
-
Polsloe Bridge Station
-
St.James' Park Station
-
Newton St.Cyres Station
-
Digby and Sowton Station
-
Exeter Central Station
- FAQ
- Price Paid By Year
- Property Type Price
Frequently asked questions about Bradninch
What is the average price for a property for sale in Bradninch?
The average price for a property for sale in Bradninch is £328,327. This amount is 7% lower than the average price in Exeter. There are 199 property listings for sale in Bradninch.
What streets have the most expensive properties for sale in Bradninch?
The streets with the most expensive properties for sale in Bradninch are West End Road at an average of £505,875, Hen Street at an average of £425,000 and Cross Cottages at an average of £405,000.
What streets have the most affordable properties for sale in Bradninch?
The streets with the most affordable properties for sale in Bradninch are Peter Street at an average of £177,500, Cullompton Hill at an average of £177,500 and Church Street at an average of £185,000.
Which train stations are available in or near Bradninch?
Some of the train stations available in or near Bradninch are Whimple, Cranbrook and Pinhoe.
Property Price Paid in Bradninch by Year
The average sold property price by year was:
| Year | Average Sold Price | Price Change |
Sold Properties
|
|---|---|---|---|
| 2025 | £323,863 | 5% |
22 Properties |
| 2024 | £306,986 | -12% |
18 Properties |
| 2023 | £342,514 | -2% |
34 Properties |
| 2022 | £350,185 | 8% |
35 Properties |
| 2021 | £321,878 | 12% |
30 Properties |
| 2020 | £282,972 | 4% |
18 Properties |
| 2019 | £271,522 | 3% |
22 Properties |
| 2018 | £264,290 | 3% |
35 Properties |
| 2017 | £256,498 | 6% |
27 Properties |
| 2016 | £241,312 | 9% |
35 Properties |
| 2015 | £219,423 | -10% |
34 Properties |
| 2014 | £242,183 | -23% |
31 Properties |
| 2013 | £297,115 | 27% |
32 Properties |
| 2012 | £217,653 | -22% |
14 Properties |
| 2011 | £266,579 | 25% |
27 Properties |
| 2010 | £200,172 | -3% |
34 Properties |
| 2009 | £205,515 | -5% |
30 Properties |
| 2008 | £215,351 | -5% |
25 Properties |
| 2007 | £226,110 | -16% |
37 Properties |
| 2006 | £263,280 | 28% |
33 Properties |
| 2005 | £188,871 | -0,2% |
39 Properties |
| 2004 | £189,198 | 10% |
40 Properties |
| 2003 | £170,850 | 18% |
78 Properties |
| 2002 | £139,889 | 37% |
57 Properties |
| 2001 | £87,745 | -25% |
37 Properties |
| 2000 | £109,655 | 22% |
53 Properties |
| 1999 | £85,177 | 26% |
54 Properties |
| 1998 | £63,211 | -9% |
30 Properties |
| 1997 | £68,812 | -2% |
31 Properties |
| 1996 | £70,236 | 12% |
36 Properties |
| 1995 | £61,989 | - |
28 Properties |
Property Price per Property Type in Bradninch
Here you can find historic sold price data in order to help with your property search.
The average Property Paid Price for specific property types in the last three years are:
| Property Type | Average Sold Price | Sold Properties |
|---|---|---|
| Semi Detached House | £300,022.00 | 22 Semi Detached Houses |
| Detached House | £491,000.00 | 20 Detached Houses |
| Terraced House | £246,117.00 | 32 Terraced Houses |

