
Houses for sale in Halberton, Cullompton
House Prices in Halberton
Properties in Halberton have an average house price of £448k and had 41 Property Transactions within the last 3 years¹.
Halberton is an area in Cullompton, Devon with 203 households², where the most expensive property was sold for £765k.
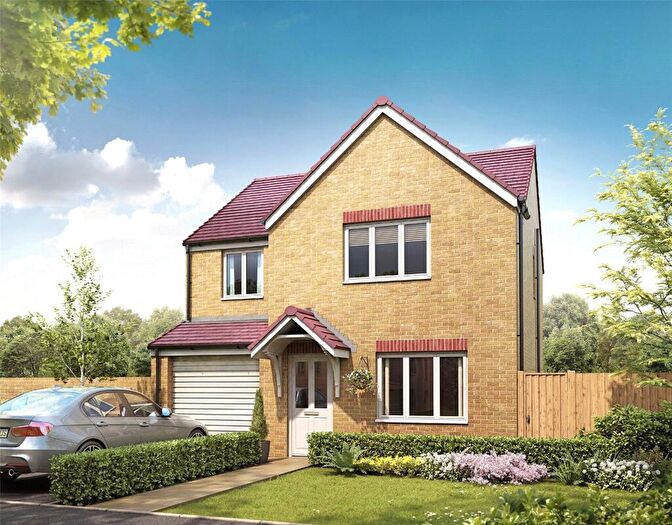
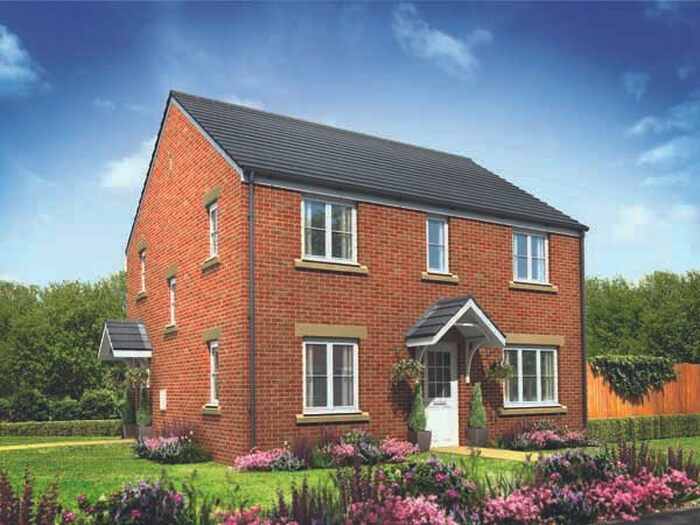
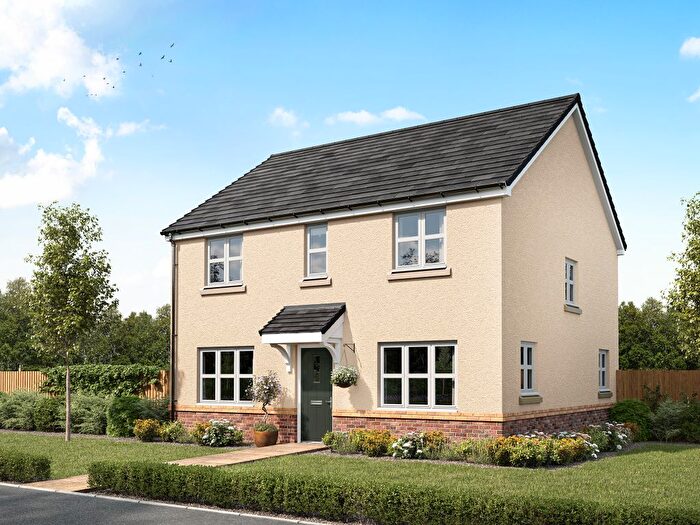
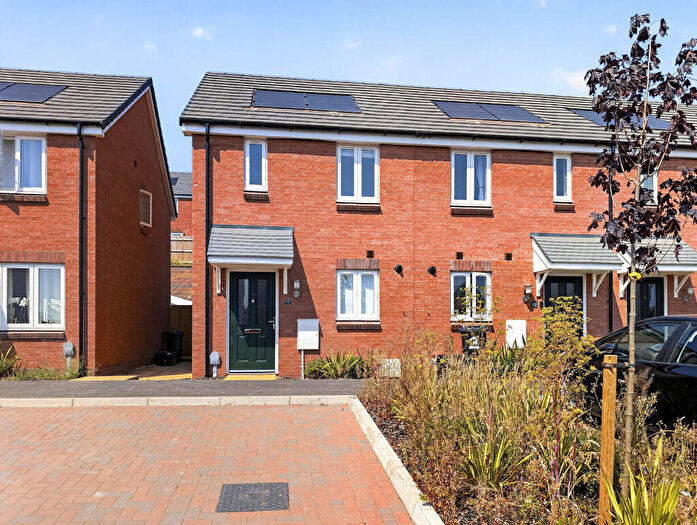
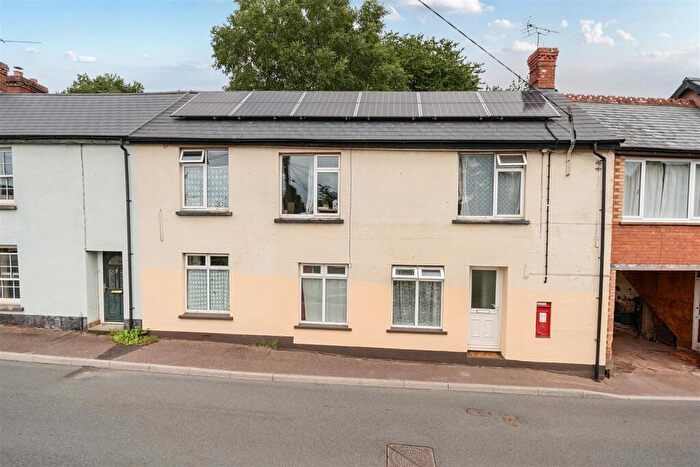
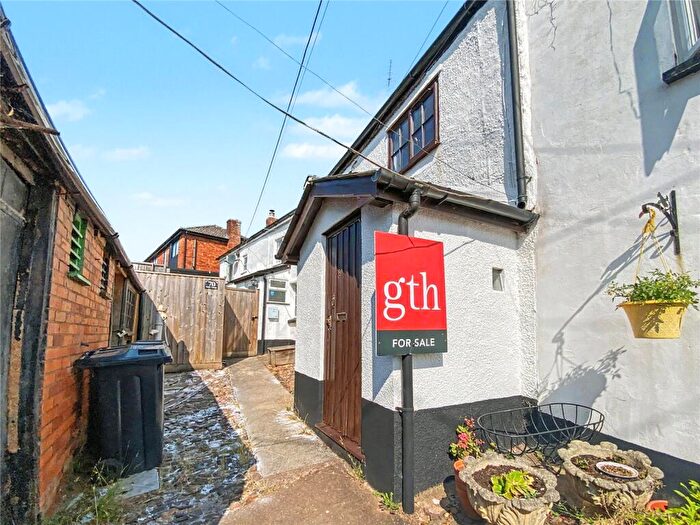
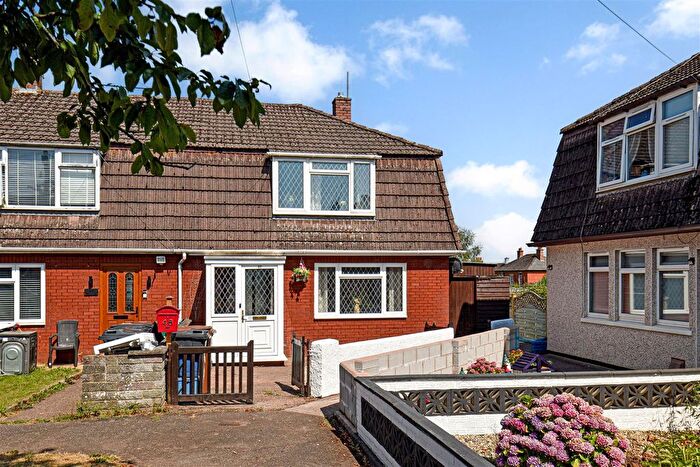
Properties for sale in Halberton
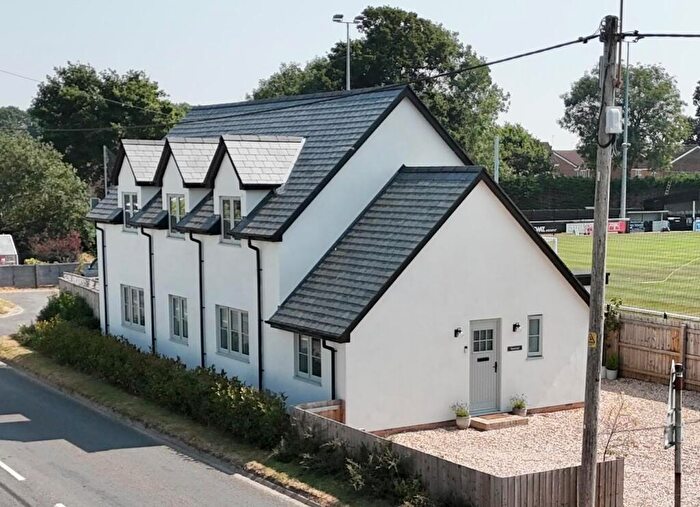
![]()
If you are looking to sell your house, let it out, or receive a property valuation, an expert can help you.
Click the button below to get started.


Roads and Postcodes in Halberton
Navigate through our locations to find the location of your next house in Halberton, Cullompton for sale or to rent.
| Streets | Postcodes |
|---|---|
| Bridwell Crescent | EX15 3FU |
| Brithem Bottom | EX15 1NB EX15 1ND |
| Carlu Close | EX15 3FG |
| Chave Lane | EX15 1NE |
| Culm Meadow Walk | EX15 3FS |
| Forge Road | EX15 3FN |
| Four Cross Avenue | EX15 2EZ EX15 2FB |
| Halberton Road | EX15 2QF EX15 2QQ |
| Hawthorn Place | EX15 3FQ |
| King Place | EX15 3FH |
| Lucas Way | EX15 3FA |
| Muxbeare Lane | EX15 2JH EX15 3BY |
| Willand | EX15 2QG |
| Willow Drive | EX15 3FR |
| EX15 1LX EX15 1LY EX15 1LZ EX15 1NA EX15 1NF EX15 1QP EX15 1QR EX15 1QY EX15 3BU EX15 3BX EX15 3BZ EX15 3DA EX15 3FT |
Property price trends in Halberton
According to the latest Land Registry data, the average home in Halberton sold for £495,000 in 2026. That figure comes from 204 sales logged over the past 31 years.
Prices have continued to climb over the last three years. Compared with 2023, when the typical sale came in around £427,327, that's a rise of roughly 15.8%.
Looking back five years, average prices are up about 12.1% since 2021, a gain of around £53,438 in cash terms.
Zoom out to the past decade for the fuller picture. Back in 2016, homes here averaged £301,361, so the typical sold price has climbed about 64.3% since then, roughly 5.1% a year. Stretch the view to fifteen years and that annual pace edges up closer to 5.7%.
Frequently asked questions about Halberton
What is the average price for a property for sale in Halberton?
The average price for a property for sale in Halberton is £448,203. This amount is 36% higher than the average price in Cullompton. There are 2,458 property listings for sale in Halberton.
What streets have the most expensive properties for sale in Halberton?
The streets with the most expensive properties for sale in Halberton are Halberton Road at an average of £582,500, Brithem Bottom at an average of £577,500 and Muxbeare Lane at an average of £550,000.
What streets have the most affordable properties for sale in Halberton?
The streets with the most affordable properties for sale in Halberton are Hawthorn Place at an average of £336,666, Willow Drive at an average of £416,814 and Bridwell Crescent at an average of £461,071.
Which train stations are available in or near Halberton?
Some of the train stations available in or near Halberton are Tiverton Parkway, Feniton and Whimple.
Property Price Paid in Halberton by Year
The average sold property price by year was:
| Year | Average Sold Price | Price Change |
Sold Properties
|
|---|---|---|---|
| 2026 | £495,000 | 8% |
1 Property |
| 2025 | £454,100 | -7% |
5 Properties |
| 2024 | £486,818 | 12% |
11 Properties |
| 2023 | £427,327 | -11% |
24 Properties |
| 2022 | £476,076 | 7% |
13 Properties |
| 2021 | £441,562 | 12% |
16 Properties |
| 2020 | £387,613 | 27% |
26 Properties |
| 2019 | £282,411 | -5% |
9 Properties |
| 2018 | £295,750 | -33% |
4 Properties |
| 2017 | £393,333 | 23% |
3 Properties |
Property Price per Property Type in Halberton
Here you can find historic sold price data in order to help with your property search.
The average Property Paid Price for specific property types in the last three years are:
| Property Type | Average Sold Price | Sold Properties |
|---|---|---|
| Semi Detached House | £338,285.00 | 7 Semi Detached Houses |
| Terraced House | £316,750.00 | 5 Terraced Houses |
| Detached House | £497,400.00 | 29 Detached Houses |
