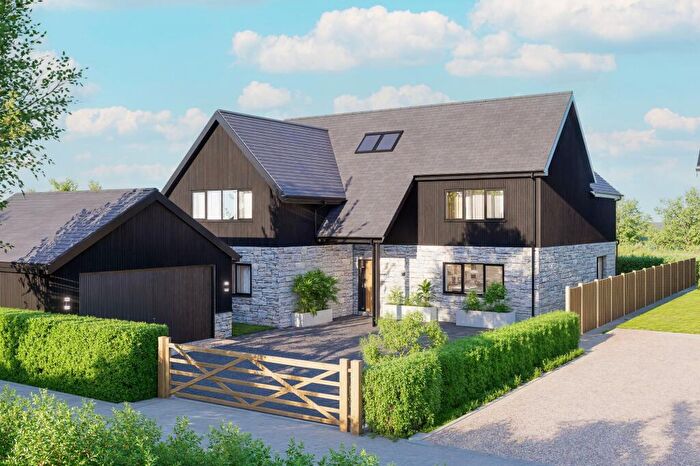
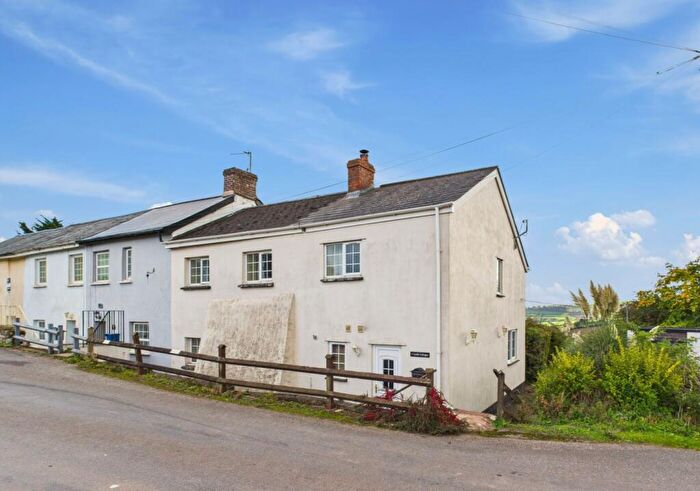
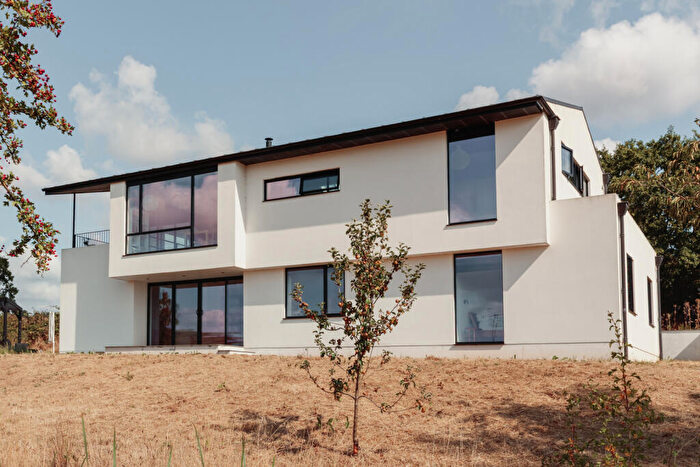
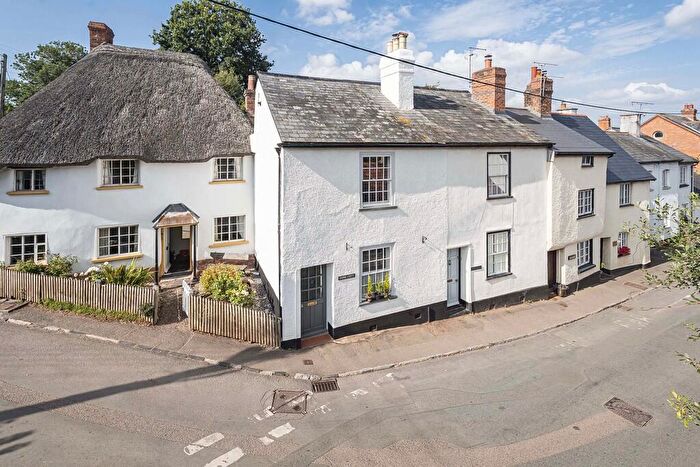
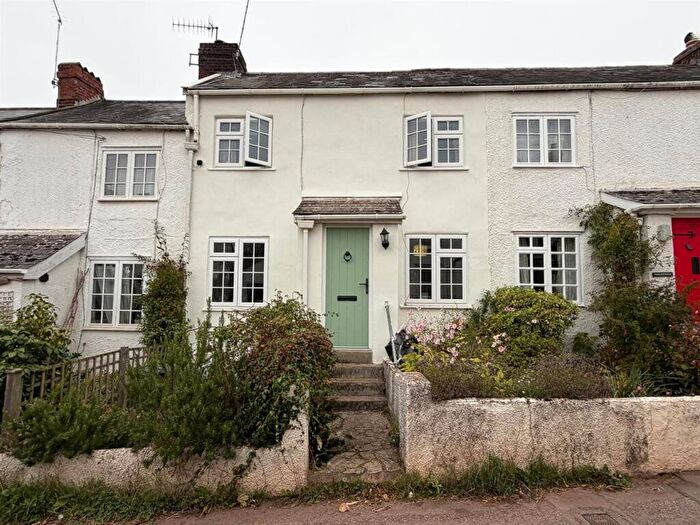
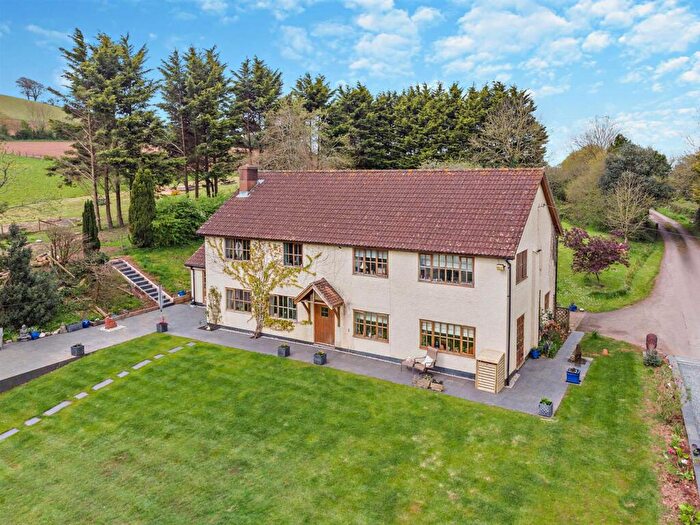
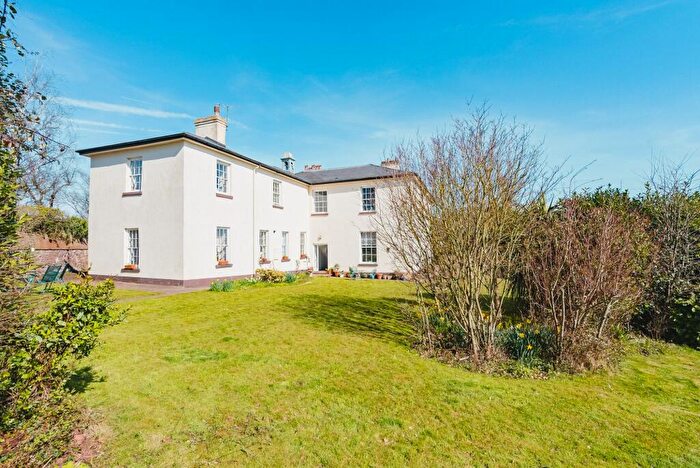
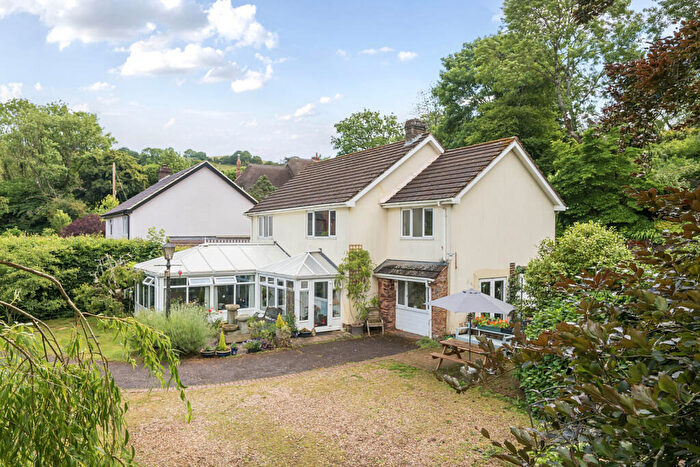
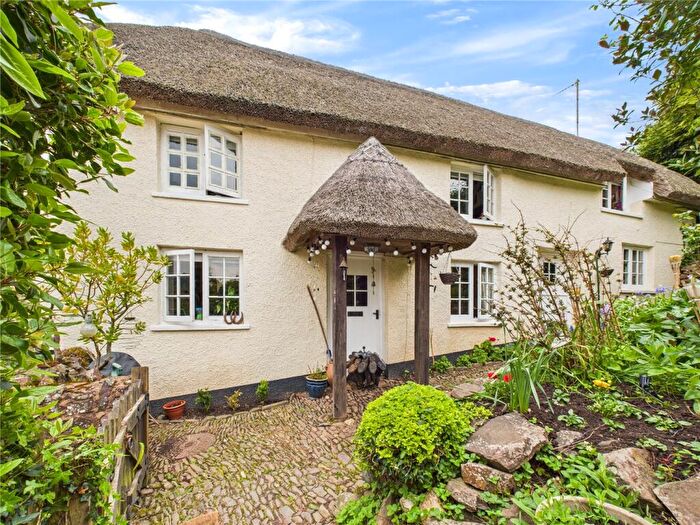
Houses for sale & to rent in Cadbury, Exeter
House Prices in Cadbury
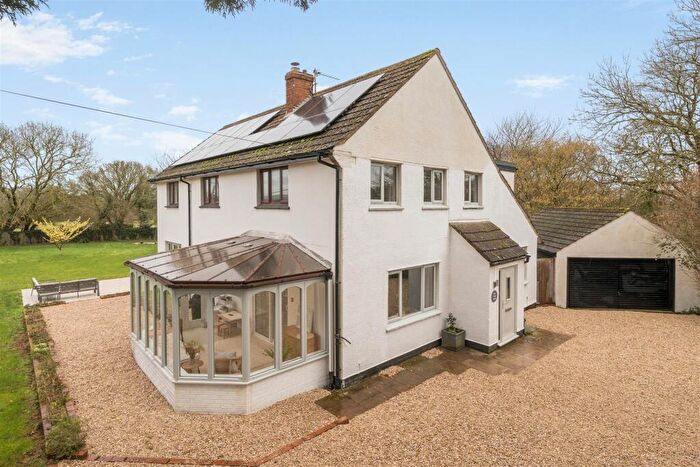
Properties in Cadbury have an average house price of £409,264.00 and had 34 Property Transactions within the last 3 years¹.
Cadbury is an area in Exeter, Devon with 500 households², where the most expensive property was sold for £950,000.00.
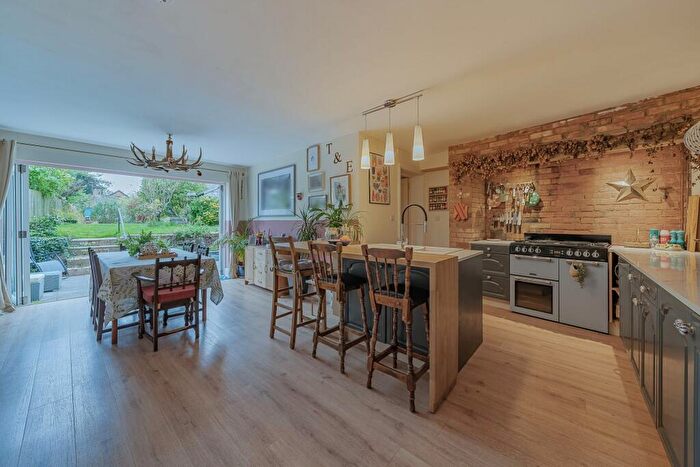
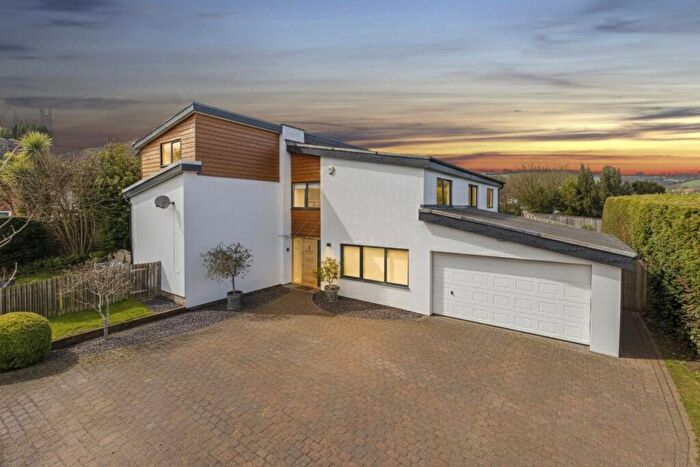
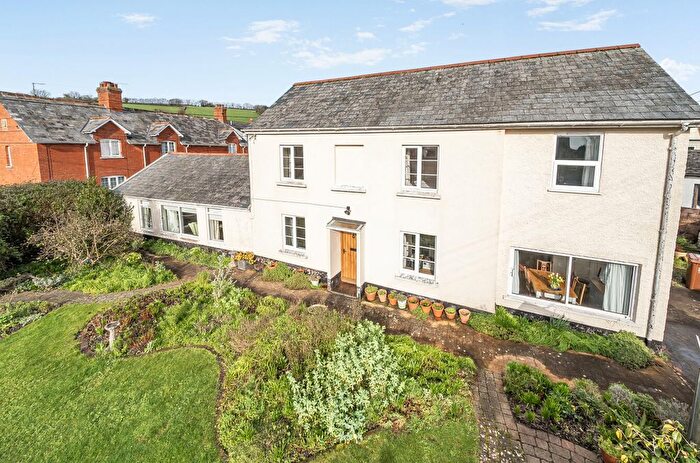
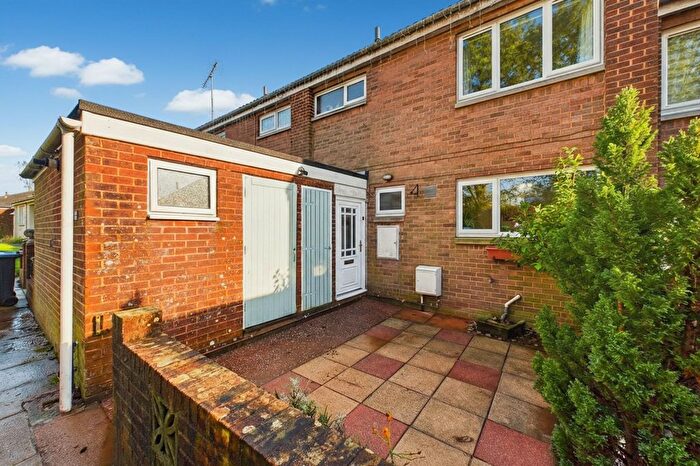
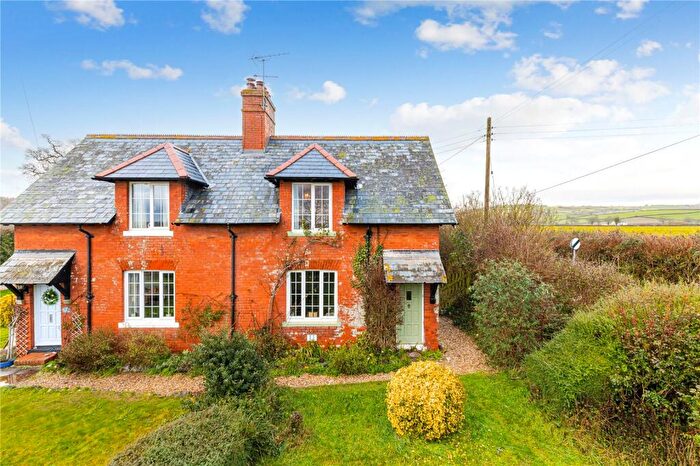
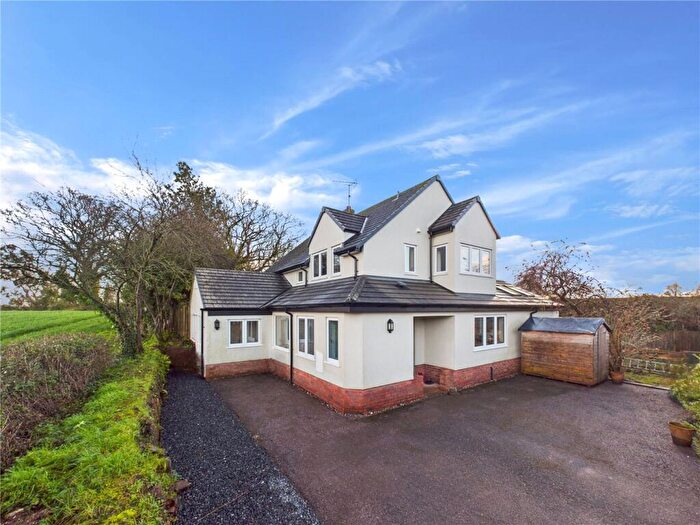
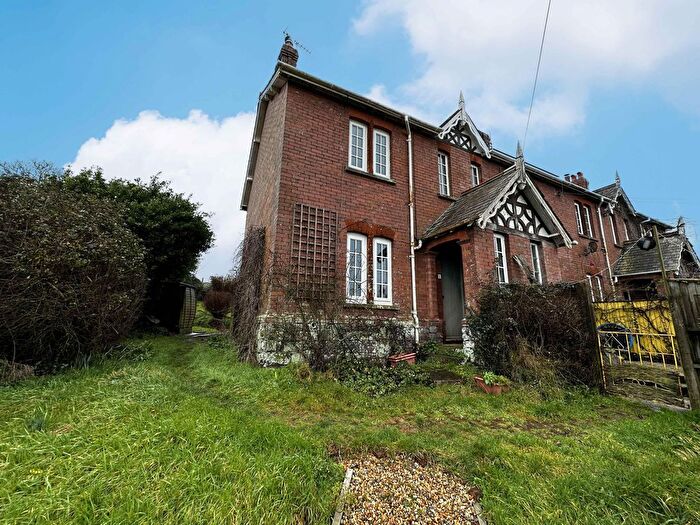
Properties for sale in Cadbury
Roads and Postcodes in Cadbury
Navigate through our locations to find the location of your next house in Cadbury, Exeter for sale or to rent.
| Streets | Postcodes |
|---|---|
| Bidwell Lane | EX5 5LH EX5 5LJ |
| Broadlands | EX5 5PT |
| Bullen Close | EX5 5NW |
| Bullen Street | EX5 5NG |
| Cadbury Cross Cottages | EX5 5QA |
| Castle Cottages | EX5 5PZ |
| Chitterley Business Centre | EX5 4DB |
| Cleaves Close | EX5 5NN |
| Courbet Court | EX5 5NJ |
| Court Barton Close | EX5 5BQ |
| Dark Lane | EX5 5NQ |
| Dinneford Street | EX5 5NU |
| Jericho Street | EX5 5PA EX5 5PB |
| Lawn Cottages | EX5 5NZ |
| Leonard Square | EX5 5DQ |
| Lynch Close | EX5 5NP |
| Milford Lane | EX5 5NX |
| Northdown Road | EX5 5LQ |
| Pitt Lane | EX5 5QE |
| School Lane | EX5 5NR |
| Silver Street | EX5 5LT |
| Thatchers Hill | EX5 5LD |
| The Bury | EX5 5NT |
| The Glebe | EX5 5LS |
| EX5 4BP EX5 4BT EX5 4BU EX5 4BX EX5 4BY EX5 4BZ EX5 4DA EX5 5JL EX5 5JP EX5 5JR EX5 5JZ EX5 5LA EX5 5LL EX5 5LN EX5 5LP EX5 5LX EX5 5NL EX5 5NY EX5 5PJ EX5 5PL EX5 5PN EX5 5PP EX5 5PR EX5 5PX EX5 5QH EX5 4BR EX5 4BS EX5 4HF EX5 4LY EX5 5DN EX5 5JS EX5 5JT EX5 5JU EX5 5JY EX5 5LB EX5 5LW EX5 5NH EX5 5NS EX5 5PS EX5 5PY EX5 5QB EX5 5QD EX5 5QF EX5 5QP |
Transport near Cadbury
-
Newton St.Cyres Station
-
Crediton Station
-
St.James' Park Station
-
Pinhoe Station
-
Polsloe Bridge Station
-
Exeter St. David's Station
-
Exeter Central Station
-
Cranbrook Station
-
Exeter St. Thomas Station
-
Digby and Sowton Station
- FAQ
- Price Paid By Year
- Property Type Price
Frequently asked questions about Cadbury
What is the average price for a property for sale in Cadbury?
The average price for a property for sale in Cadbury is £409,264. This amount is 16% higher than the average price in Exeter. There are 421 property listings for sale in Cadbury.
What streets have the most expensive properties for sale in Cadbury?
The streets with the most expensive properties for sale in Cadbury are The Bury at an average of £526,750, Silver Street at an average of £493,333 and Court Barton Close at an average of £432,125.
What streets have the most affordable properties for sale in Cadbury?
The streets with the most affordable properties for sale in Cadbury are Jericho Street at an average of £248,125, Broadlands at an average of £279,166 and Bullen Street at an average of £282,600.
Which train stations are available in or near Cadbury?
Some of the train stations available in or near Cadbury are Newton St.Cyres, Crediton and St.James' Park.
Property Price Paid in Cadbury by Year
The average sold property price by year was:
| Year | Average Sold Price | Price Change |
Sold Properties
|
|---|---|---|---|
| 2025 | £387,911 | -10% |
17 Properties |
| 2024 | £427,500 | -2% |
10 Properties |
| 2023 | £435,071 | -35% |
7 Properties |
| 2022 | £586,145 | 36% |
12 Properties |
| 2021 | £376,280 | 8% |
22 Properties |
| 2020 | £346,533 | 9% |
15 Properties |
| 2019 | £314,183 | -17% |
15 Properties |
| 2018 | £367,452 | -12% |
21 Properties |
| 2017 | £412,870 | 30% |
28 Properties |
| 2016 | £290,227 | -17% |
22 Properties |
| 2015 | £339,915 | 26% |
13 Properties |
| 2014 | £251,528 | -53% |
16 Properties |
| 2013 | £385,250 | 46% |
14 Properties |
| 2012 | £207,250 | -85% |
11 Properties |
| 2011 | £383,062 | -8% |
8 Properties |
| 2010 | £413,900 | 39% |
5 Properties |
| 2009 | £252,269 | -37% |
13 Properties |
| 2008 | £346,250 | 3% |
4 Properties |
| 2007 | £334,596 | 32% |
15 Properties |
| 2006 | £227,391 | -2% |
17 Properties |
| 2005 | £232,200 | -21% |
12 Properties |
| 2004 | £282,055 | 11% |
9 Properties |
| 2003 | £250,501 | 20% |
19 Properties |
| 2002 | £200,440 | 27% |
15 Properties |
| 2001 | £145,371 | 10% |
16 Properties |
| 2000 | £130,192 | -56% |
13 Properties |
| 1999 | £203,530 | 52% |
11 Properties |
| 1998 | £97,812 | -10% |
16 Properties |
| 1997 | £107,815 | 20% |
19 Properties |
| 1996 | £85,912 | -20% |
20 Properties |
| 1995 | £102,944 | - |
15 Properties |
Property Price per Property Type in Cadbury
Here you can find historic sold price data in order to help with your property search.
The average Property Paid Price for specific property types in the last three years are:
| Property Type | Average Sold Price | Sold Properties |
|---|---|---|
| Semi Detached House | £311,000.00 | 6 Semi Detached Houses |
| Detached House | £595,357.00 | 14 Detached Houses |
| Terraced House | £267,230.00 | 13 Terraced Houses |
| Flat | £240,000.00 | 1 Flat |

