
Houses for sale & to rent in Exeter, Devon
House Prices in Exeter
Properties in Exeter have an average house price of £354k and had 6,676 Property Transactions within the last 3 years.¹
Exeter is an area in Devon with 64,702 households², where the most expensive property was sold for £4M.
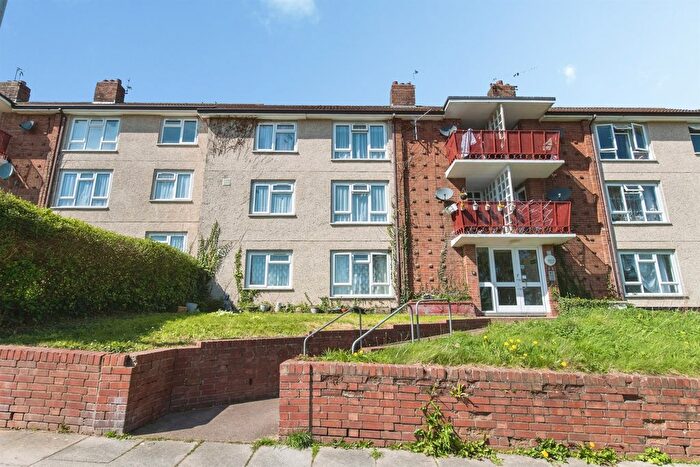
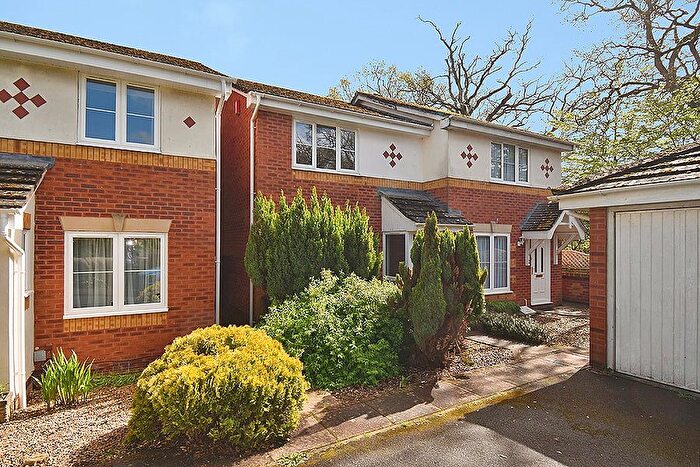
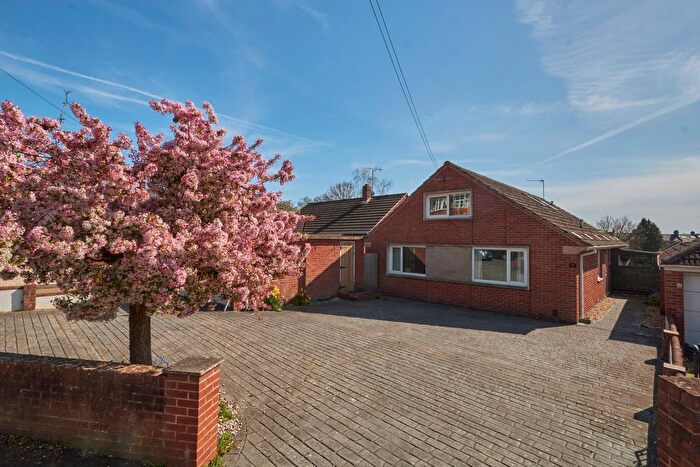
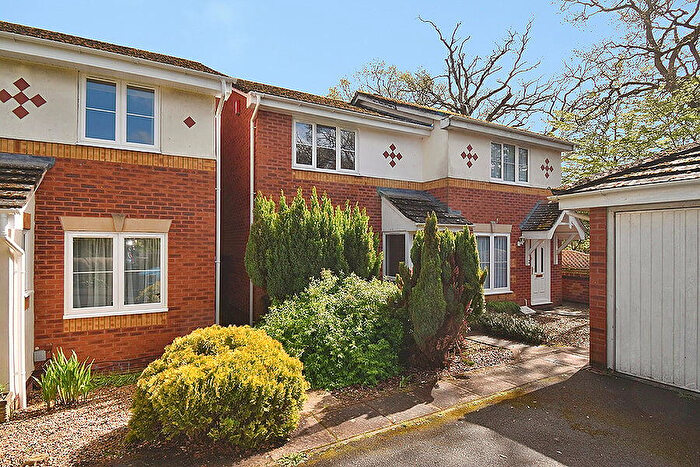
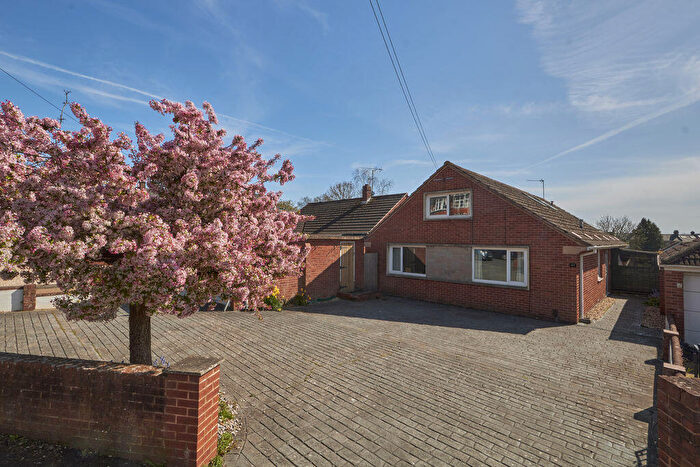
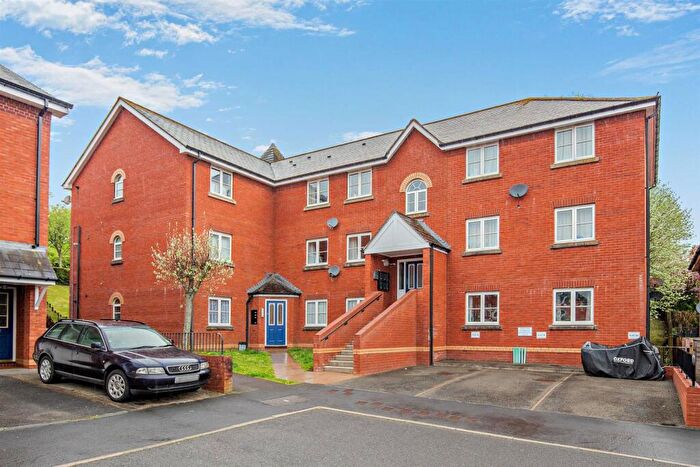
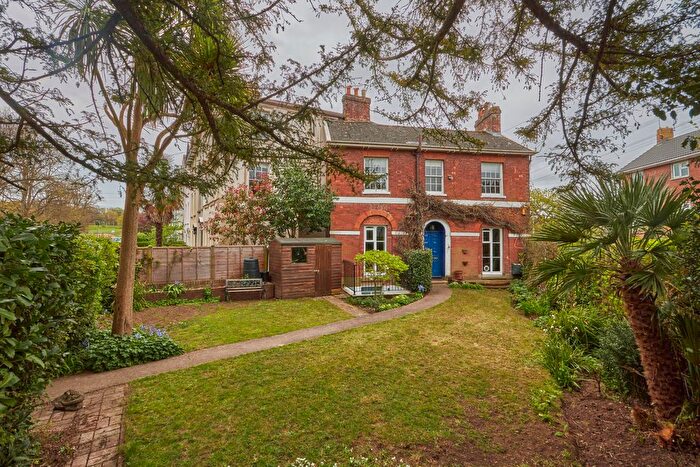
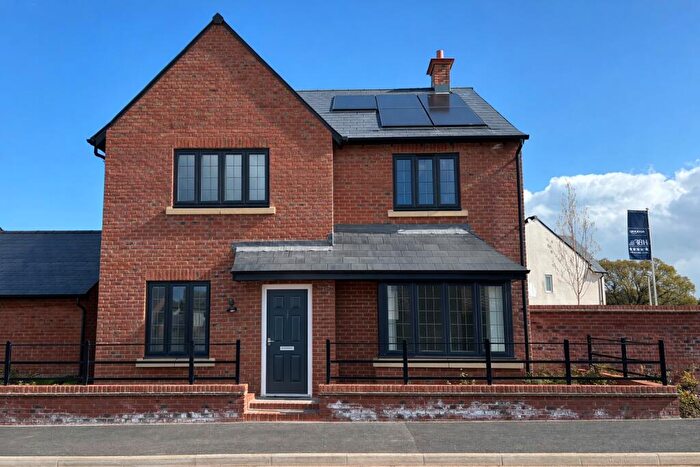
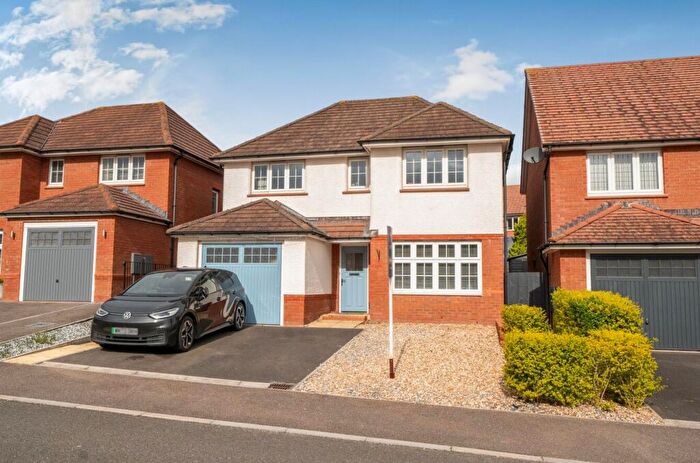
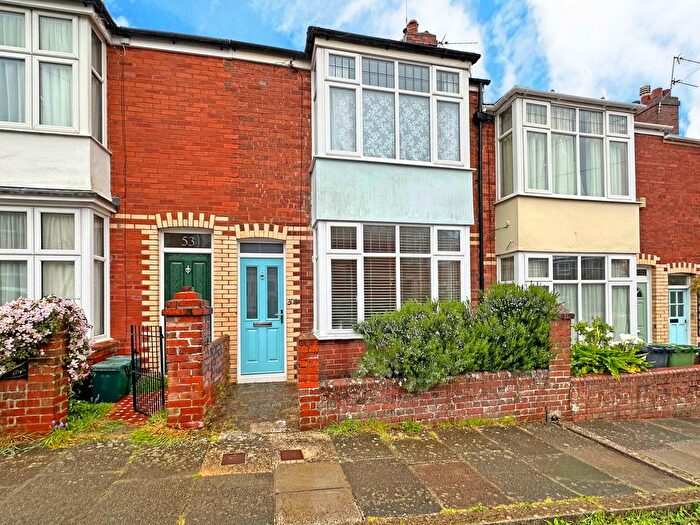
Properties for sale in Exeter


![]()
If you are looking to sell your house, let it out, or receive a property valuation, an expert can help you.
Click the button below to get started.


Neighbourhoods in Exeter
Navigate through our locations to find the location of your next house in Exeter, Devon for sale or to rent.
- Alphington
- Bradninch
- Broadclyst
- Cadbury
- Chudleigh
- Clyst Valley
- Cowick
- Cullompton Outer
- Dawlish Central And North East
- Drewsteignton
- Duryard
- Exe Valley
- Exwick
- Heavitree
- Kenn Valley
- Kenton With Starcross
- Mincinglake
- Moorland
- Newbrooke
- Newtown
- Ottery St Mary Rural
- Pennsylvania
- Pinhoe
- Polsloe
- Priory
- Raleigh
- Silverton
- St Davids
- St James
- St Leonards
- St Loyes
- St Thomas
- Teign Valley
- Teignbridge North
- Topsham
- Upper Yeo
- Whimple
- Whipton And Barton
- Woodbury And Lympstone
- Yeo
- Newtown and St Leonard's
- Mincinglake and Whipton
- Woodbury & Lympstone
- Duryard and St James
- Budleigh & Raleigh
- West Hill & Aylesbeare
- Whimple & Rockbeare
- Feniton
- Kenton & Starcross
- Dawlish North East
- Cranbrook
- Cullompton Vale
Transport in Exeter
Please see below transportation links in this area:
-
 Polsloe Bridge Station
 -
St.James' Park Station
-
Exeter Central Station
-
Exeter St. Thomas Station
-
Exeter St. David's Station
-
Digby and Sowton Station
-
Newcourt Station
-
Pinhoe Station
- FAQ
- Price Paid By Year
- Property Type Price
Frequently asked questions about Exeter
What is the average price for a property for sale in Exeter?
The average price for a property for sale in Exeter is £353,732. This amount is 2% lower than the average price in Devon. There are more than 10,000 property listings for sale in Exeter.
What locations have the most expensive properties for sale in Exeter?
The locations with the most expensive properties for sale in Exeter are Newtown and St Leonard's at an average of £1,118,400, Duryard and St James at an average of £688,125 and Budleigh & Raleigh at an average of £686,000.
What locations have the most affordable properties for sale in Exeter?
The locations with the most affordable properties for sale in Exeter are St Davids at an average of £230,686, Exwick at an average of £247,545 and St Thomas at an average of £264,281.
Which train stations are available in or near Exeter?
Some of the train stations available in or near Exeter are Polsloe Bridge, St.James' Park and Exeter Central.
Property Price Paid in Exeter by Year
The average sold property price by year was:
| Year | Average Sold Price | Price Change |
Sold Properties
|
|---|---|---|---|
| 2026 | £319,367 | -10% |
53 Properties |
| 2025 | £350,971 | 1% |
2,062 Properties |
| 2024 | £348,303 | -4% |
2,300 Properties |
| 2023 | £362,579 | 1% |
2,261 Properties |
| 2022 | £359,543 | 9% |
2,683 Properties |
| 2021 | £327,082 | 5% |
3,571 Properties |
| 2020 | £311,507 | 6% |
2,449 Properties |
| 2019 | £293,192 | -1% |
3,083 Properties |
| 2018 | £295,921 | 3% |
3,238 Properties |
| 2017 | £287,135 | 5% |
3,207 Properties |
| 2016 | £274,122 | 6% |
3,471 Properties |
| 2015 | £258,332 | 6% |
3,504 Properties |
| 2014 | £243,960 | 5% |
3,161 Properties |
| 2013 | £232,112 | -0,4% |
2,851 Properties |
| 2012 | £233,125 | 2% |
2,257 Properties |
| 2011 | £228,611 | 2% |
2,211 Properties |
| 2010 | £223,065 | 5% |
2,197 Properties |
| 2009 | £211,073 | -8% |
2,106 Properties |
| 2008 | £227,003 | 3% |
1,723 Properties |
| 2007 | £221,022 | 4% |
3,357 Properties |
| 2006 | £211,568 | 8% |
3,846 Properties |
| 2005 | £194,004 | 0,3% |
2,870 Properties |
| 2004 | £193,356 | 13% |
3,244 Properties |
| 2003 | £167,771 | 17% |
3,468 Properties |
| 2002 | £138,629 | 22% |
3,845 Properties |
| 2001 | £108,597 | 12% |
3,758 Properties |
| 2000 | £96,015 | 15% |
3,463 Properties |
| 1999 | £81,597 | 10% |
3,763 Properties |
| 1998 | £73,488 | 4% |
3,269 Properties |
| 1997 | £70,218 | 6% |
3,241 Properties |
| 1996 | £66,084 | 3% |
2,670 Properties |
| 1995 | £64,375 | - |
2,223 Properties |
Property Price per Property Type in Exeter
Here you can find historic sold price data in order to help with your property search.
The average Property Paid Price for specific property types in the last three years are:
| Property Type | Average Sold Price | Sold Properties |
|---|---|---|
| Semi Detached House | £355,700.00 | 1,563 Semi Detached Houses |
| Terraced House | £304,558.00 | 2,628 Terraced Houses |
| Detached House | £549,330.00 | 1,448 Detached Houses |
| Flat | £202,267.00 | 1,037 Flats |