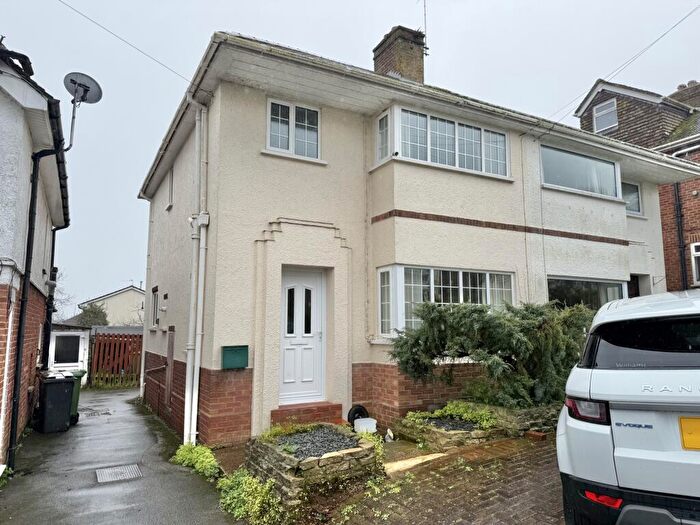
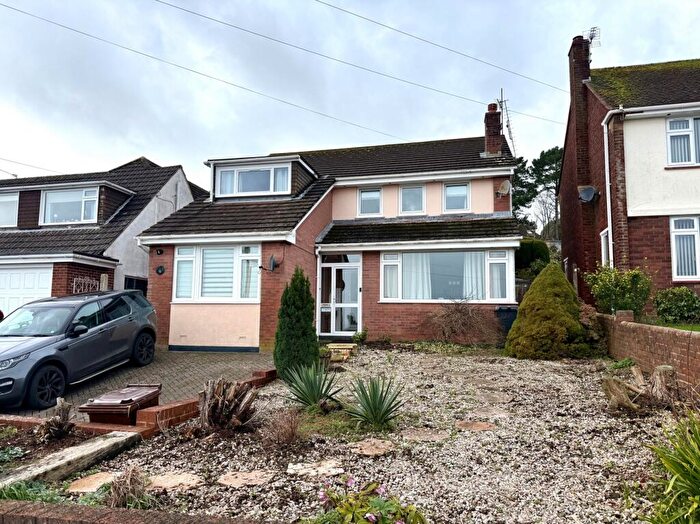
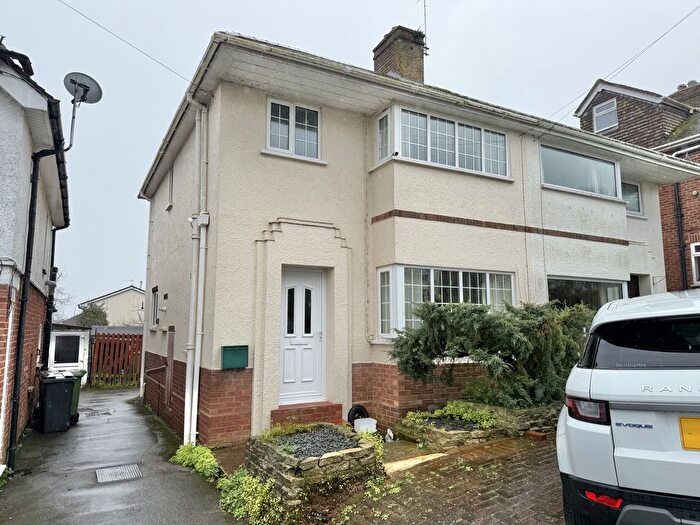
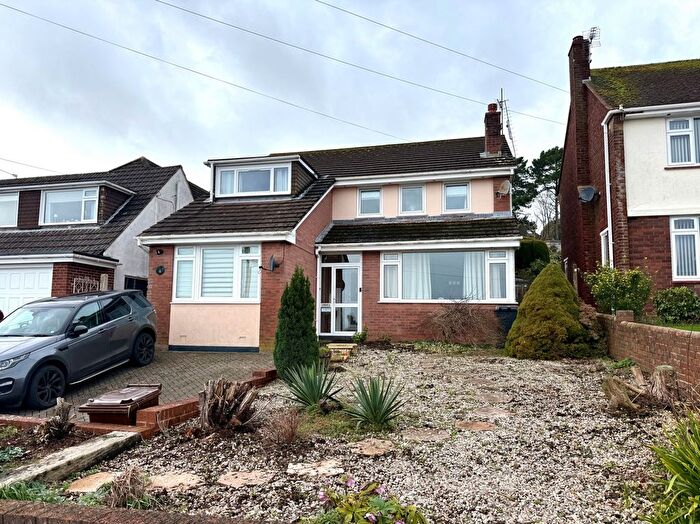
Houses for sale & to rent in Cowick, Exeter
House Prices in Cowick
Properties in Cowick have an average house price of £339,596.00 and had 190 Property Transactions within the last 3 years¹.
Cowick is an area in Exeter, Devon with 2,146 households², where the most expensive property was sold for £1,250,000.00.
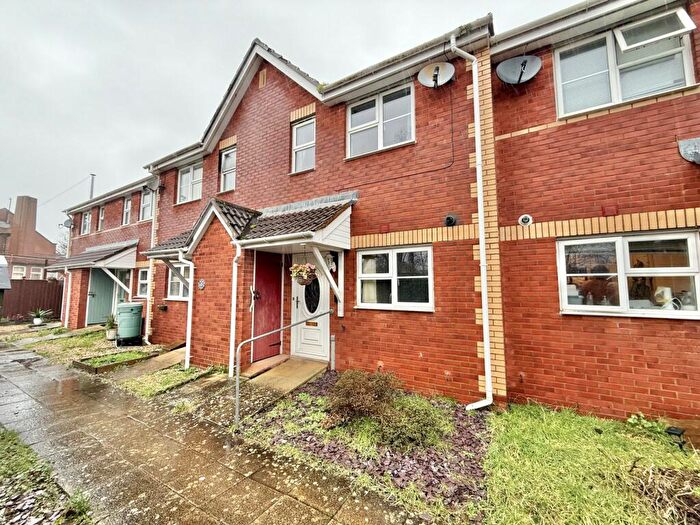
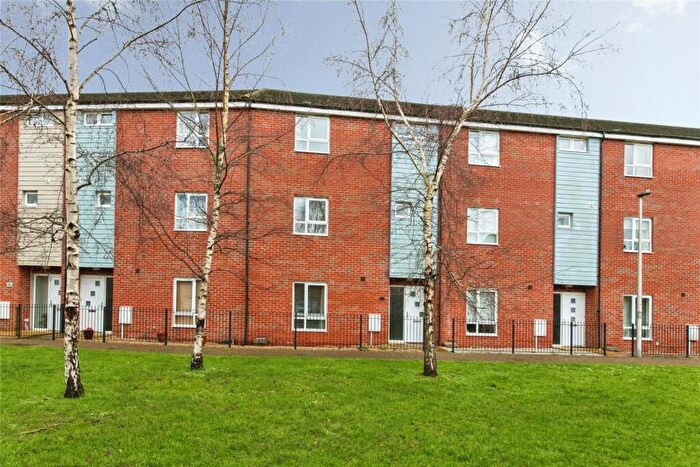
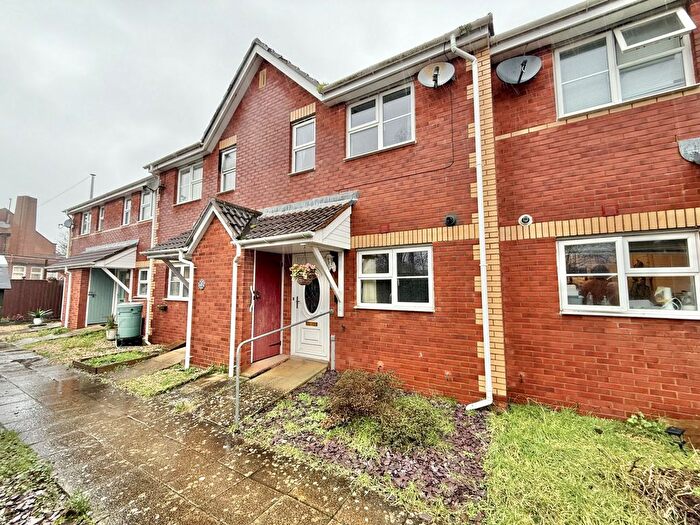
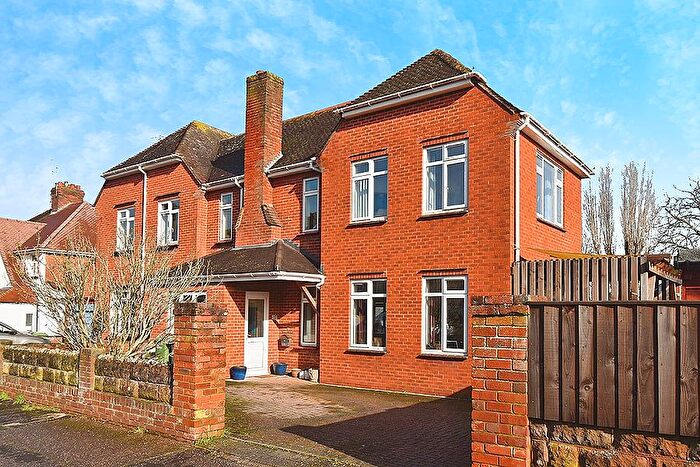
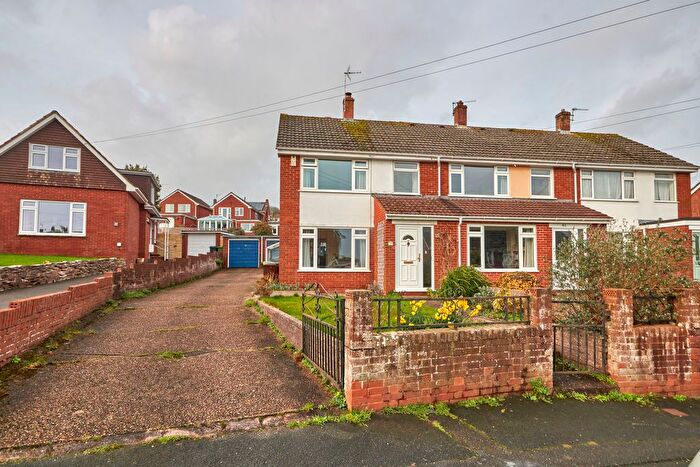
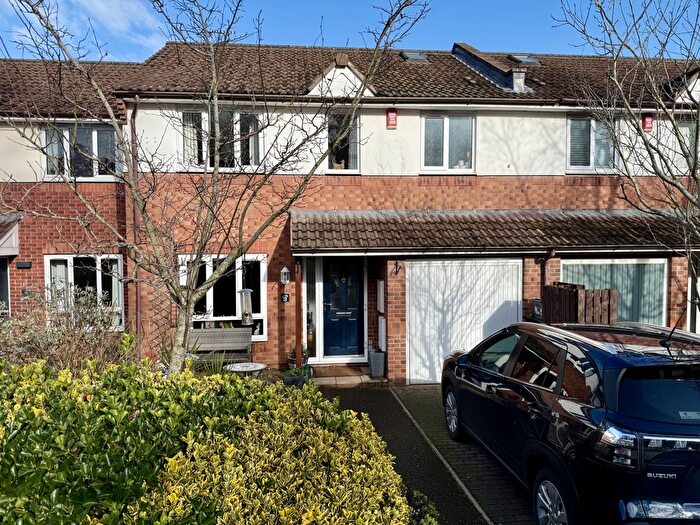
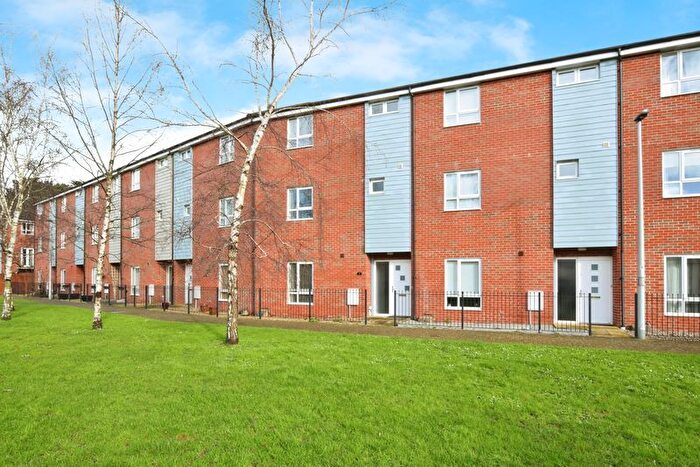
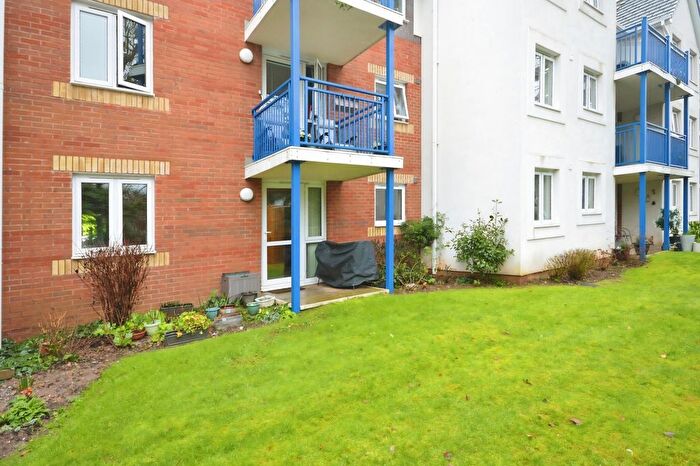
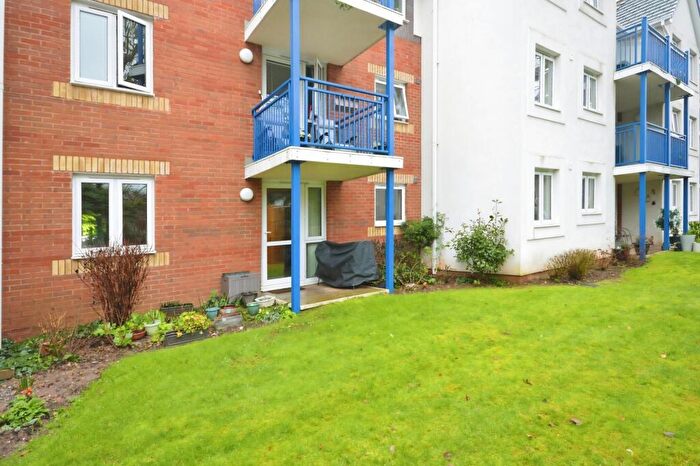
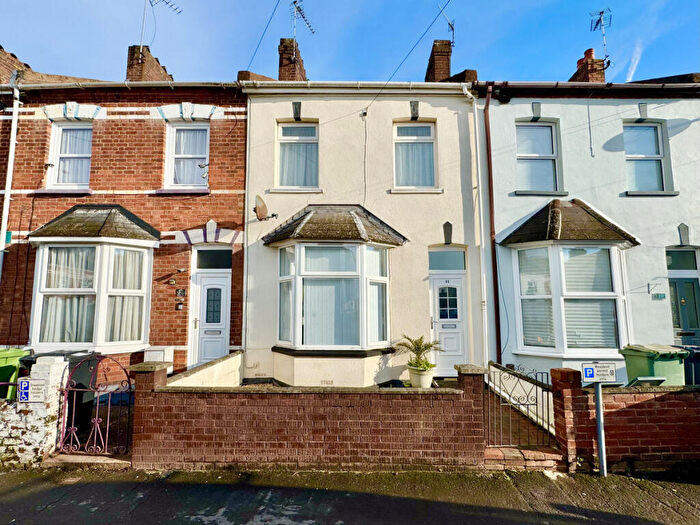
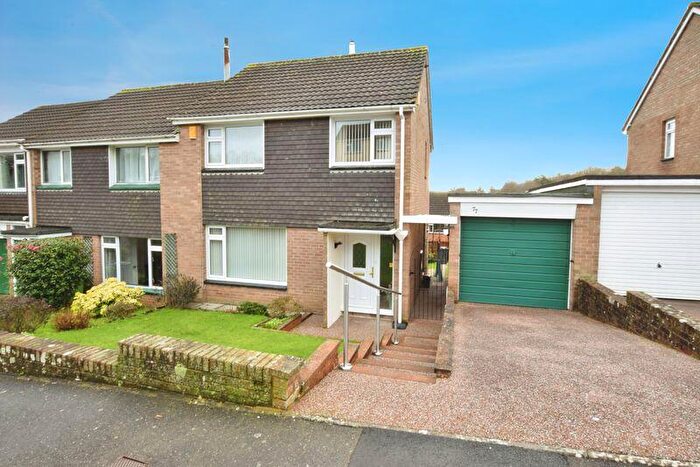
Properties for sale in Cowick
Roads and Postcodes in Cowick
Navigate through our locations to find the location of your next house in Cowick, Exeter for sale or to rent.
| Streets | Postcodes |
|---|---|
| Barley Farm Road | EX4 1NJ EX4 1NN EX4 1NW |
| Barley Lane | EX4 1NP EX4 1TA EX4 1TD EX4 1TE |
| Berkshire Drive | EX4 1NE EX4 1NF EX4 1NG |
| Bowhay Lane | EX4 1NZ EX4 1PA EX4 1PE EX4 1PF EX4 1PG |
| Branscombe Close | EX4 1RN EX4 1RW |
| Broadway | EX2 9LT EX2 9LU EX2 9LY EX2 9LZ EX2 9NA EX2 9NR EX2 9NT EX2 9NU |
| Broadway Hill | EX2 9NL |
| Buddle Lane | EX4 1JB EX4 1JP EX4 1JR EX4 1JS EX4 1JU |
| Charnley Avenue | EX4 1RD EX4 1RE |
| Cowick Hill | EX2 9NG EX2 9NJ EX2 9NN EX2 9NP EX2 9NQ |
| Cowick Lane | EX2 9HB EX2 9HD EX2 9HE |
| Croft Chase | EX4 1TB |
| Crossmead Villas | EX2 9PU |
| Doctors Walk | EX2 9RD |
| Dorset Avenue | EX4 1LY EX4 1LZ EX4 1NB EX4 1ND |
| Dunsford Gardens | EX4 1LL EX4 1LN |
| Dunsford Road | EX2 9PN EX2 9PW EX4 1LF EX4 1LG EX4 1LJ EX4 1LQ EX4 1TW |
| Essex Close | EX4 1LS |
| Eton Walk | EX4 1FD |
| Franklyn Close | EX2 9LX |
| Franklyn Drive | EX2 9HR |
| Furze Court | EX4 1FH EX4 1FJ |
| Green Lane | EX4 1RF |
| Greenway | EX2 9NX EX2 9NY EX2 9PA |
| Hambeer Lane | EX2 9PH |
| Hampshire Close | EX4 1NA |
| High Meadows | EX4 1RJ EX4 1RL |
| Ide Lane | EX2 9SW |
| Imperial Street | EX4 1QZ |
| Isleworth Road | EX4 1RG |
| Kerswill Road | EX4 1NY |
| Little Johns Cross Hill | EX2 9PJ EX2 9PL |
| Littleway | EX2 9PB |
| Locarno Road | EX4 1QD EX4 1QE |
| Merrivale Road | EX4 1PT EX4 1PU EX4 1PW EX4 1PX EX4 1PY |
| Myrtle Road | EX4 1PZ EX4 1QA |
| Nadder Park Road | EX4 1NS EX4 1NU EX4 1NX |
| Newman Court | EX4 1QF |
| Newman Road | EX4 1PH EX4 1PJ EX4 1PL EX4 1PN EX4 1PQ |
| Oak Road | EX4 1QB |
| Orchard Gardens | EX4 1LH |
| Orchard Hill | EX2 9ND EX2 9NH |
| Parkway | EX2 9NB EX2 9NE EX2 9NF |
| Perridge Close | EX2 9PX |
| Pineridge Close | EX4 1NR |
| Pocombe Bridge | EX2 9SX |
| Prescot Road | EX4 1RB |
| Rosemary Street | EX4 1QX |
| Savile Road | EX4 1PR |
| Solar Crescent | EX4 1PD |
| Somerset Avenue | EX4 1LR EX4 1LT EX4 1LW EX4 1LX |
| Southport Avenue | EX4 1RA |
| Surbiton Crescent | EX4 1PB |
| Sussex Close | EX4 1LP |
| Vuefield Hill | EX2 9NW |
| Wellswood Gardens | EX4 1RH |
| Wentworth Gardens | EX4 1NH EX4 1NQ |
| Wheatley Close | EX4 1NT |
| Wiltshire Close | EX4 1LU |
| EX2 9RB |
Transport near Cowick
-
Exeter St. Thomas Station
-
Exeter St. David's Station
-
Exeter Central Station
-
St.James' Park Station
-
Polsloe Bridge Station
- FAQ
- Price Paid By Year
- Property Type Price
Frequently asked questions about Cowick
What is the average price for a property for sale in Cowick?
The average price for a property for sale in Cowick is £339,596. This amount is 4% lower than the average price in Exeter. There are 1,183 property listings for sale in Cowick.
What streets have the most expensive properties for sale in Cowick?
The streets with the most expensive properties for sale in Cowick are Pocombe Bridge at an average of £915,000, Perridge Close at an average of £844,000 and Little Johns Cross Hill at an average of £673,000.
What streets have the most affordable properties for sale in Cowick?
The streets with the most affordable properties for sale in Cowick are Prescot Road at an average of £150,250, Green Lane at an average of £152,500 and Furze Court at an average of £195,166.
Which train stations are available in or near Cowick?
Some of the train stations available in or near Cowick are Exeter St. Thomas, Exeter St. David's and Exeter Central.
Property Price Paid in Cowick by Year
The average sold property price by year was:
| Year | Average Sold Price | Price Change |
Sold Properties
|
|---|---|---|---|
| 2025 | £334,183 | -1% |
56 Properties |
| 2024 | £336,972 | -3% |
73 Properties |
| 2023 | £347,704 | -1% |
61 Properties |
| 2022 | £352,856 | 24% |
88 Properties |
| 2021 | £268,504 | 1% |
96 Properties |
| 2020 | £265,797 | -5% |
67 Properties |
| 2019 | £278,221 | 3% |
69 Properties |
| 2018 | £269,368 | 11% |
79 Properties |
| 2017 | £240,674 | -3% |
69 Properties |
| 2016 | £248,359 | 8% |
94 Properties |
| 2015 | £227,394 | 10% |
88 Properties |
| 2014 | £205,488 | 3% |
80 Properties |
| 2013 | £199,316 | -4% |
87 Properties |
| 2012 | £206,406 | 0,1% |
95 Properties |
| 2011 | £206,223 | 3% |
85 Properties |
| 2010 | £200,570 | 7% |
68 Properties |
| 2009 | £186,289 | -5% |
67 Properties |
| 2008 | £196,402 | -2% |
70 Properties |
| 2007 | £199,747 | 7% |
70 Properties |
| 2006 | £186,140 | 7% |
108 Properties |
| 2005 | £173,208 | 4% |
76 Properties |
| 2004 | £166,543 | 11% |
89 Properties |
| 2003 | £148,600 | 16% |
86 Properties |
| 2002 | £124,513 | 24% |
111 Properties |
| 2001 | £94,890 | 17% |
105 Properties |
| 2000 | £78,736 | 13% |
85 Properties |
| 1999 | £68,108 | 0,4% |
104 Properties |
| 1998 | £67,804 | 15% |
97 Properties |
| 1997 | £57,712 | -3% |
82 Properties |
| 1996 | £59,309 | 4% |
76 Properties |
| 1995 | £56,753 | - |
59 Properties |
Property Price per Property Type in Cowick
Here you can find historic sold price data in order to help with your property search.
The average Property Paid Price for specific property types in the last three years are:
| Property Type | Average Sold Price | Sold Properties |
|---|---|---|
| Semi Detached House | £333,333.00 | 90 Semi Detached Houses |
| Detached House | £440,098.00 | 43 Detached Houses |
| Terraced House | £301,750.00 | 44 Terraced Houses |
| Flat | £178,615.00 | 13 Flats |

