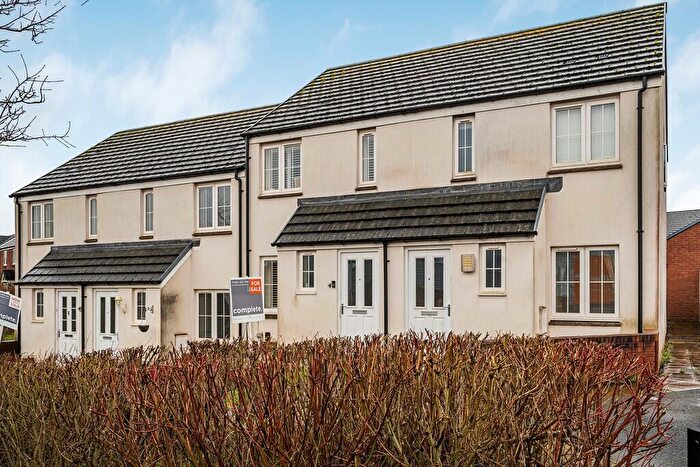
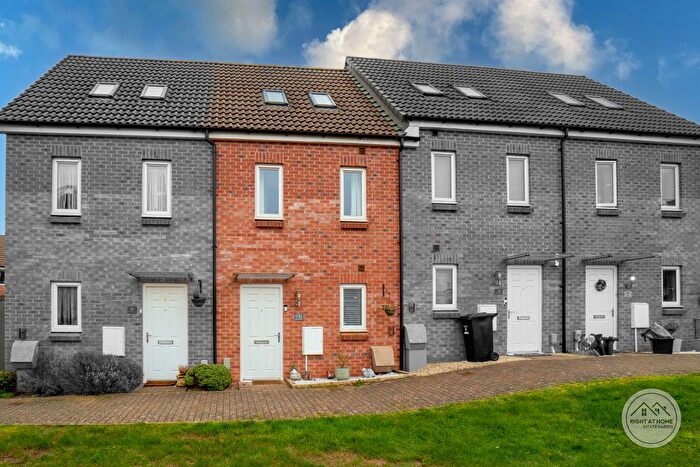
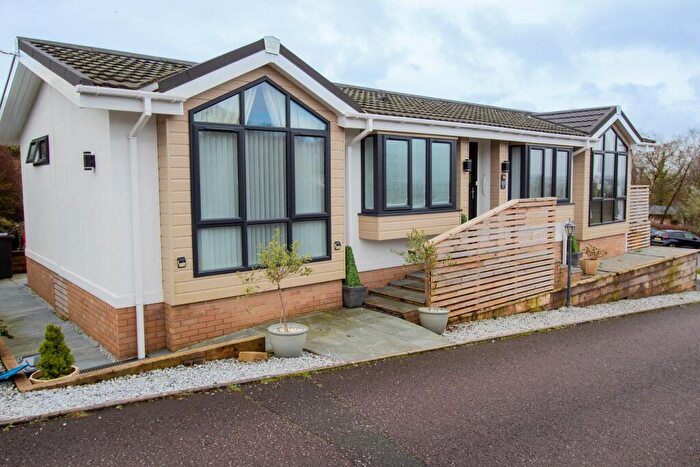
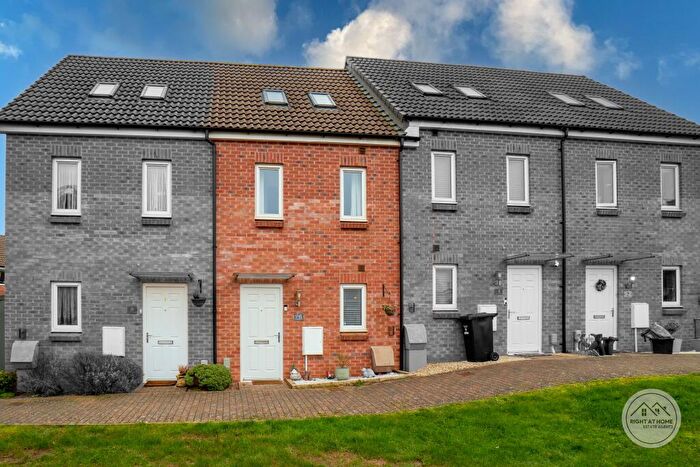
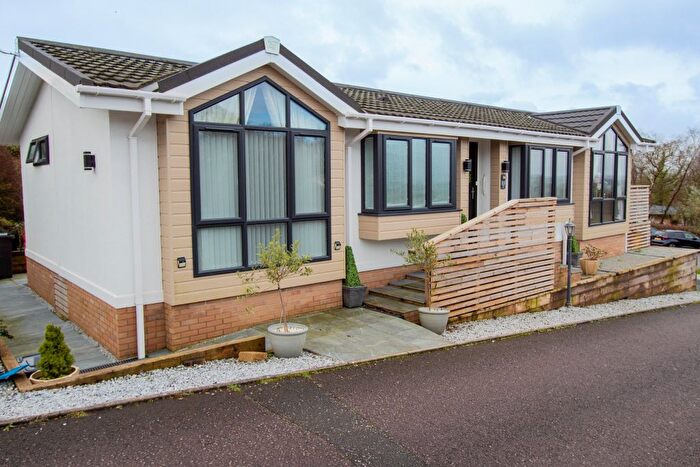
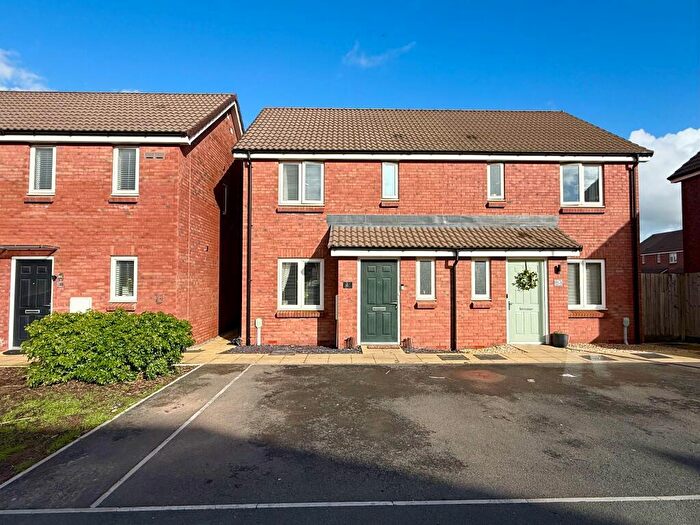
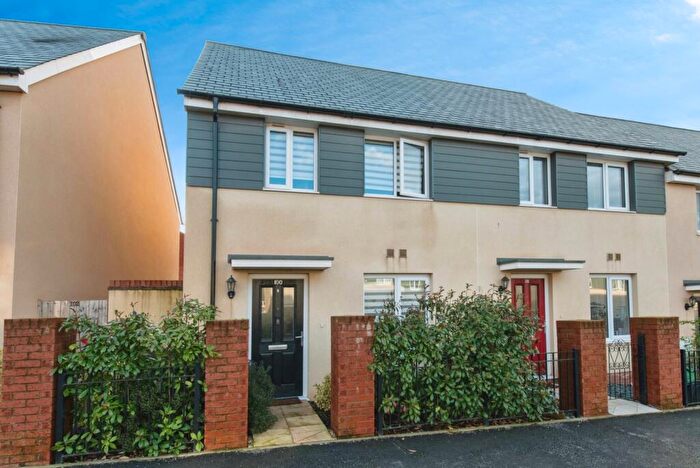
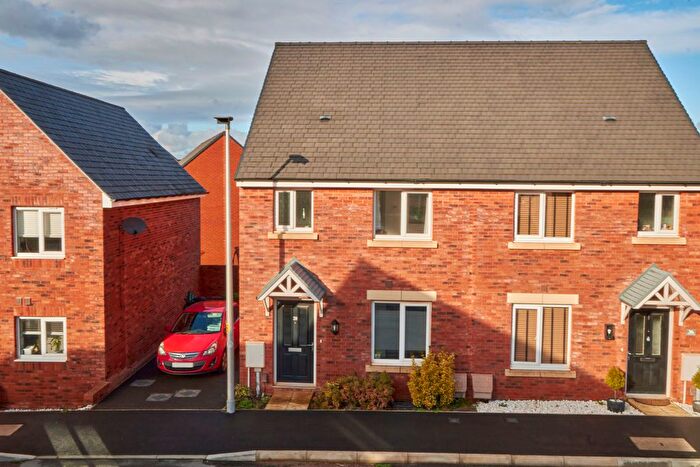
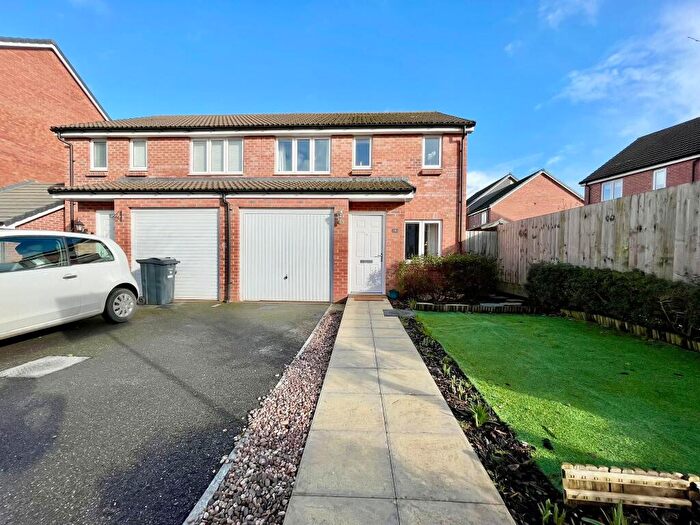
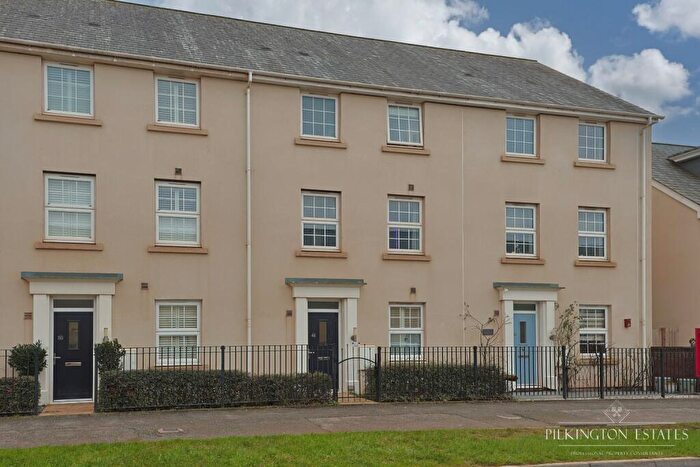
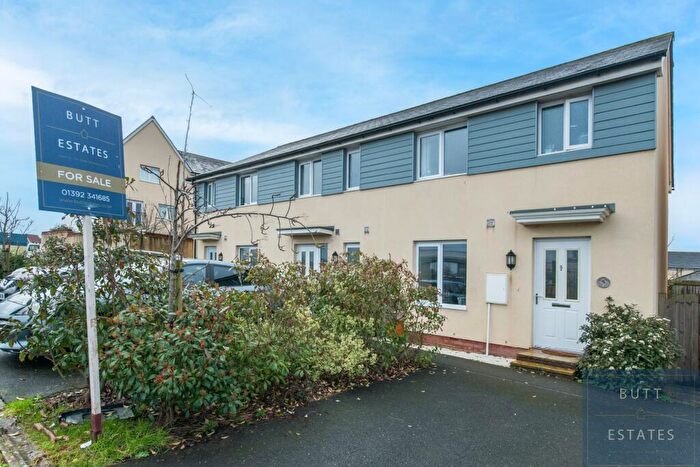
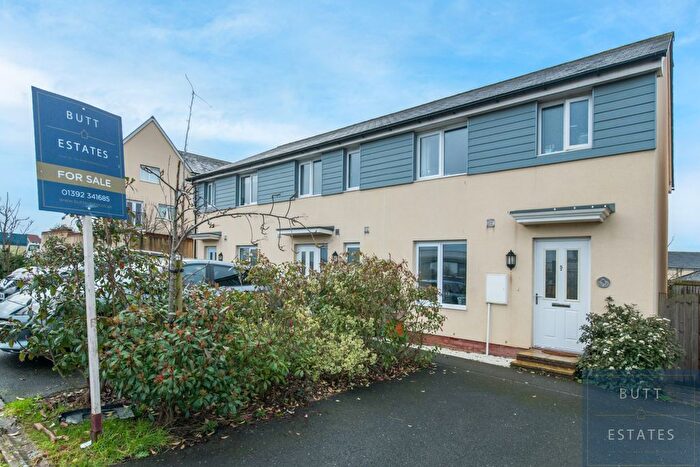
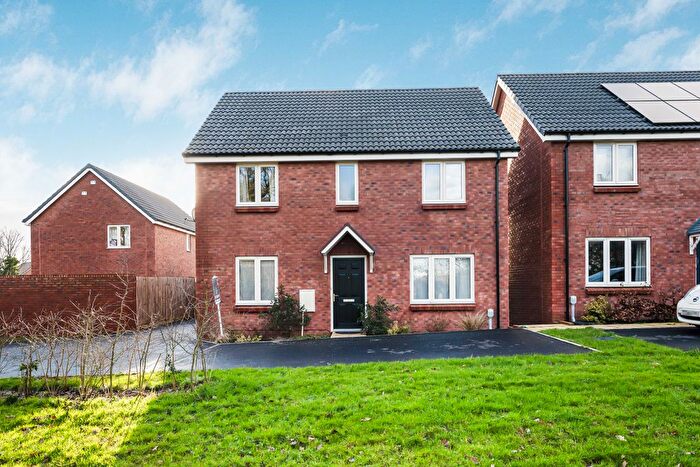
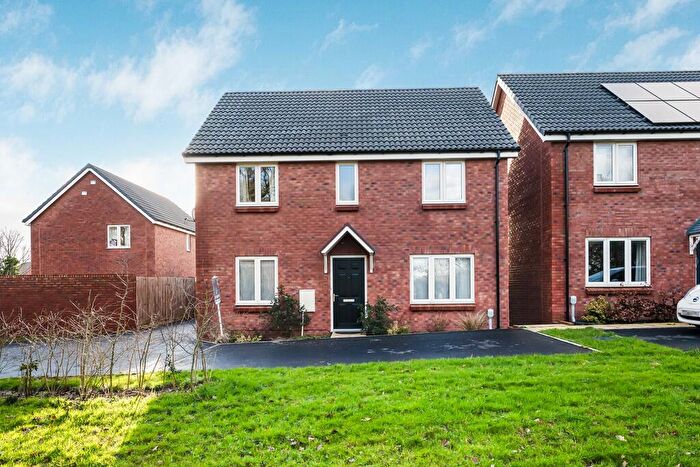
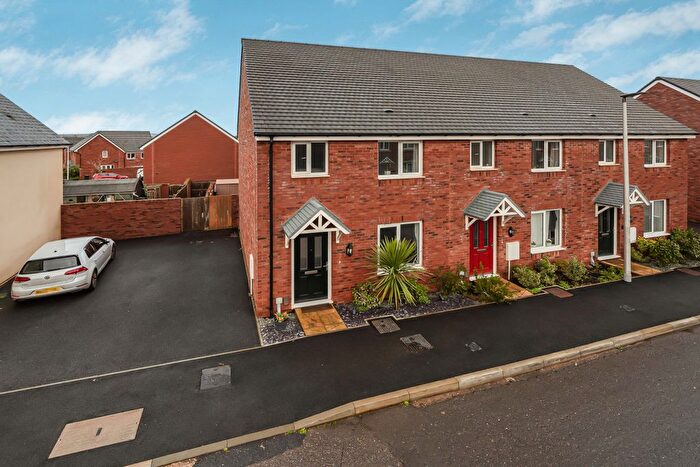
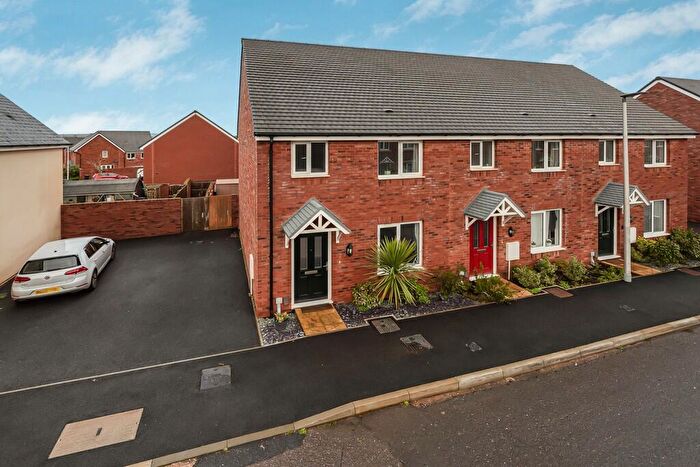
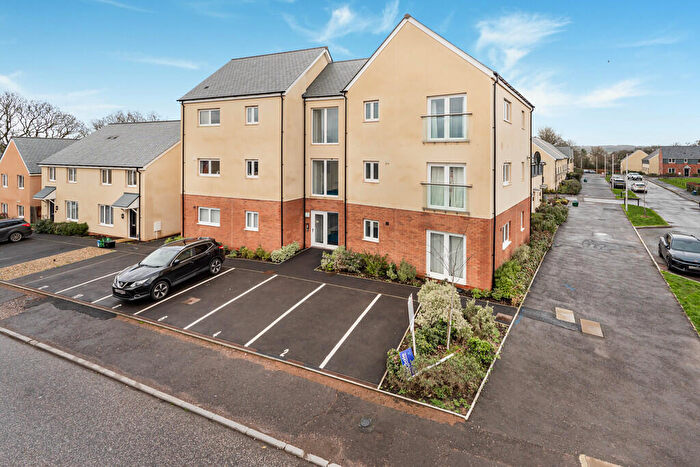
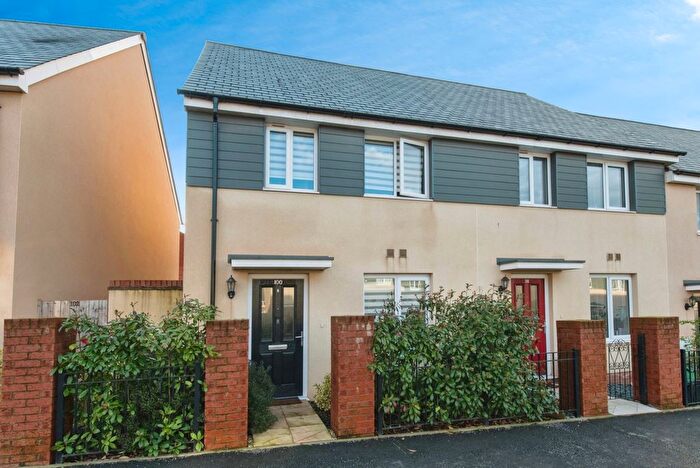
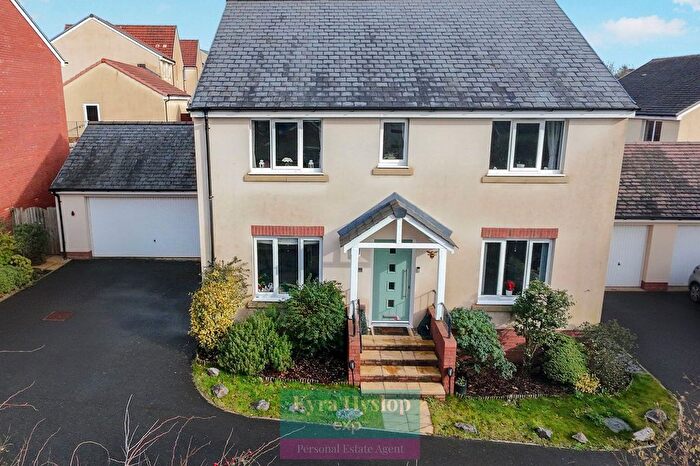
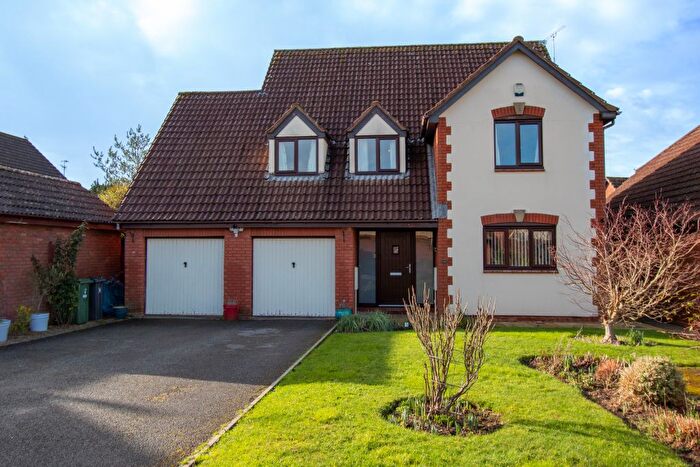
Houses for sale & to rent in Whimple & Rockbeare, Exeter
House Prices in Whimple & Rockbeare
Properties in Whimple & Rockbeare have an average house price of £605,818.00 and had 6 Property Transactions within the last 3 years¹.
Whimple & Rockbeare is an area in Exeter, Devon with 122 households², where the most expensive property was sold for £1,039,212.00.
Properties for sale in Whimple & Rockbeare
Roads and Postcodes in Whimple & Rockbeare
Navigate through our locations to find the location of your next house in Whimple & Rockbeare, Exeter for sale or to rent.
| Streets | Postcodes |
|---|---|
| Broadclyst Road | EX5 2NT |
| Church Road | EX5 2SY |
| Cobden Lane | EX5 2PZ |
| Delia Gardens | EX5 2EH |
| Hand & Pen Lane | EX5 2PW |
| London Road | EX5 2ED EX5 2EN EX5 2FP EX5 2FX EX5 2NL EX5 2PQ EX5 2PY EX5 2QB |
| Marsh Green | EX5 2ET EX5 2EY EX5 2HE |
| Orchard Court | EX5 2UE |
| Rockbeare Hill | EX5 2HA |
| Talaton Road | EX5 2QG EX5 2QN |
| The Square | EX5 2SS |
| EX5 2DW EX5 2EL EX5 2FE EX5 2FY EX5 2HB EX5 2LL EX5 2LN EX5 2LS EX5 2LT EX5 2PR EX5 2QT EX5 2TX EX5 2UD EX5 2WY EX5 2YF |
Transport near Whimple & Rockbeare
- FAQ
- Price Paid By Year
- Property Type Price
Frequently asked questions about Whimple & Rockbeare
What is the average price for a property for sale in Whimple & Rockbeare?
The average price for a property for sale in Whimple & Rockbeare is £605,818. This amount is 71% higher than the average price in Exeter. There are 1,231 property listings for sale in Whimple & Rockbeare.
What streets have the most expensive properties for sale in Whimple & Rockbeare?
The streets with the most expensive properties for sale in Whimple & Rockbeare are London Road at an average of £468,200 and Marsh Green at an average of £423,000.
What streets have the most affordable properties for sale in Whimple & Rockbeare?
The street with the most affordable properties for sale in Whimple & Rockbeare is Broadclyst Road at an average of £325,000.
Which train stations are available in or near Whimple & Rockbeare?
Some of the train stations available in or near Whimple & Rockbeare are Whimple, Cranbrook and Feniton.
Property Price Paid in Whimple & Rockbeare by Year
The average sold property price by year was:
| Year | Average Sold Price | Price Change |
Sold Properties
|
|---|---|---|---|
| 2024 | £519,140 | -100% |
5 Properties |
| 2023 | £1,039,212 | 47% |
1 Property |
| 2022 | £546,366 | 6% |
6 Properties |
| 2021 | £513,750 | -7% |
4 Properties |
| 2020 | £551,250 | 23% |
8 Properties |
| 2019 | £423,750 | -36% |
2 Properties |
| 2018 | £575,580 | -3% |
1 Property |
| 2017 | £595,000 | 44% |
1 Property |
| 2016 | £335,916 | 5% |
6 Properties |
| 2015 | £318,000 | -16% |
1 Property |
| 2014 | £370,000 | 15% |
1 Property |
| 2011 | £315,000 | 44% |
1 Property |
| 2008 | £175,000 | -77% |
1 Property |
| 2005 | £310,000 | 20% |
1 Property |
| 2003 | £248,691 | 39% |
2 Properties |
| 2001 | £152,000 | 67% |
1 Property |
| 1995 | £50,000 | - |
1 Property |
Property Price per Property Type in Whimple & Rockbeare
Here you can find historic sold price data in order to help with your property search.
The average Property Paid Price for specific property types in the last three years are:
| Property Type | Average Sold Price | Sold Properties |
|---|---|---|
| Detached House | £605,818.00 | 6 Detached Houses |

