
Houses for sale in Hartland, Holsworthy
House Prices in Hartland
Properties in Hartland have an average house price of £354k and had 2 Property Transactions within the last 3 years¹.
Hartland is an area in Holsworthy, Devon with 72 households², where the most expensive property was sold for £430k.
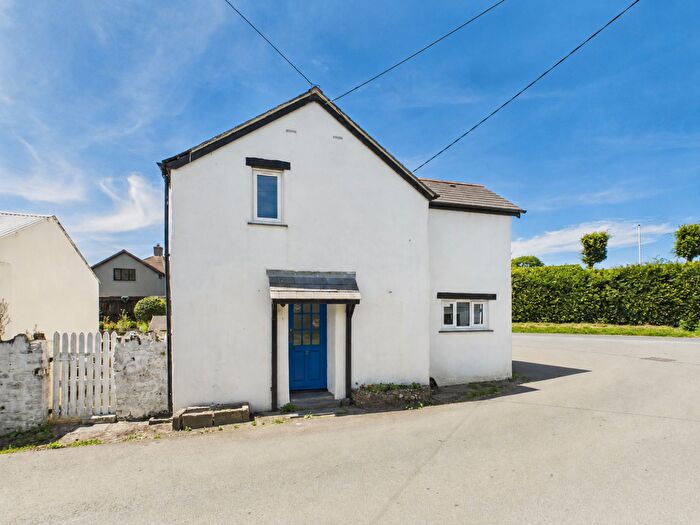
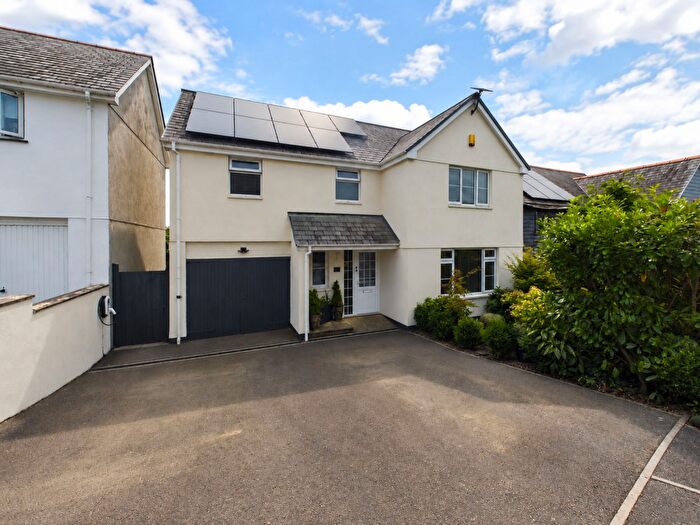
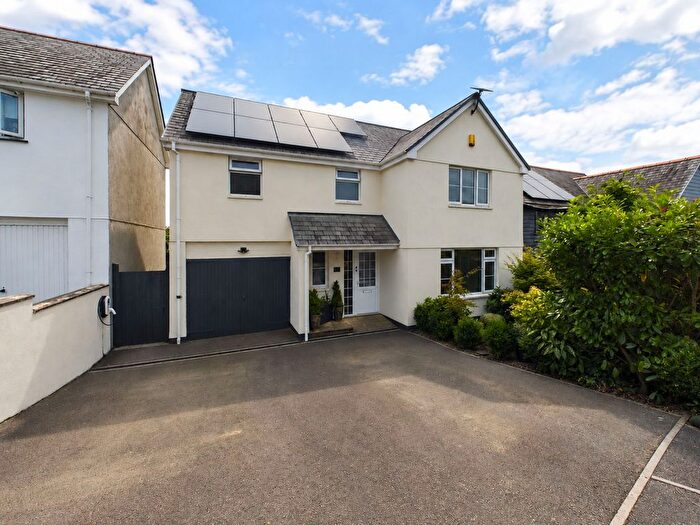
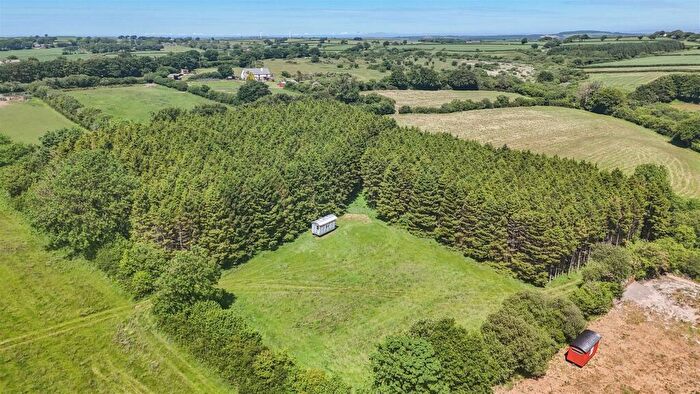
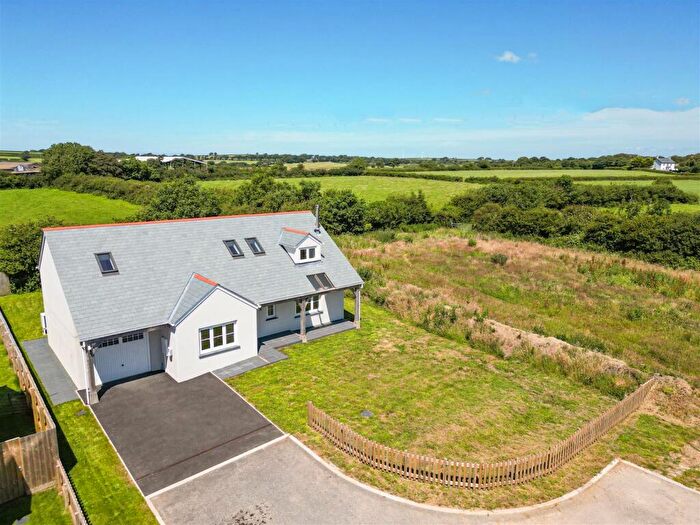
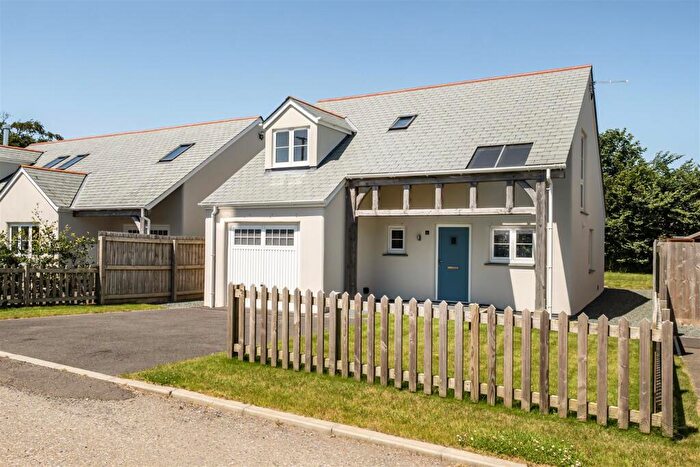
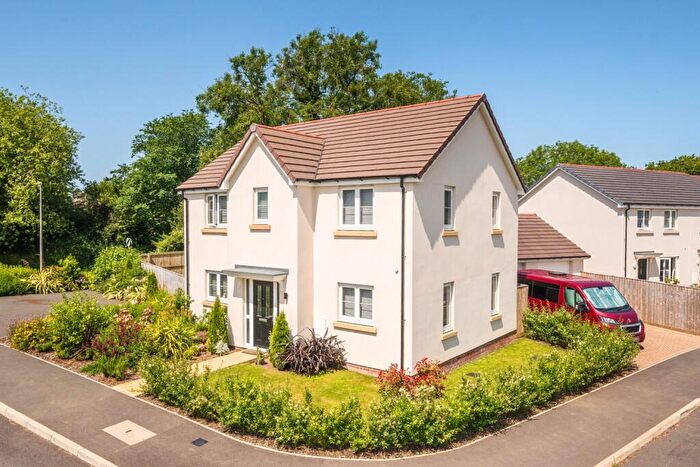
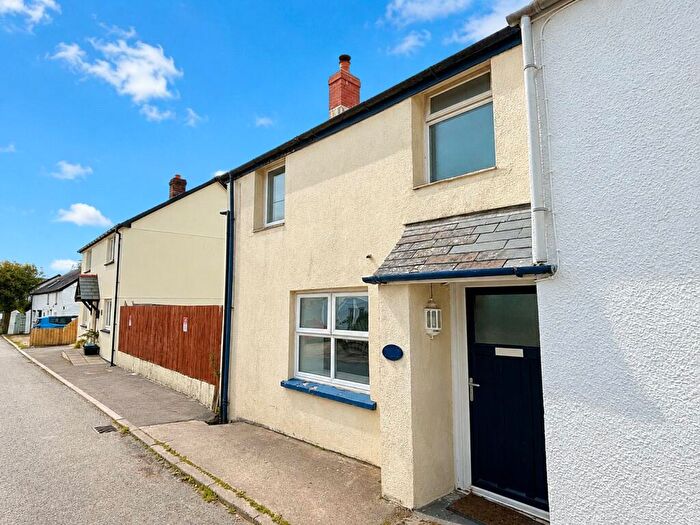
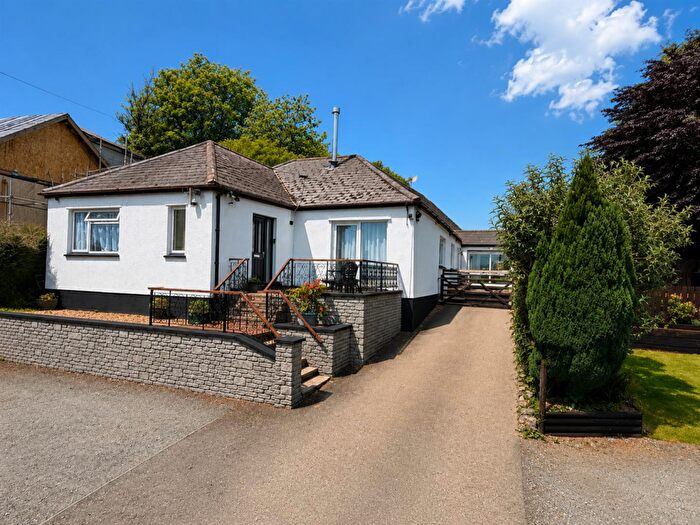
Properties for sale in Hartland
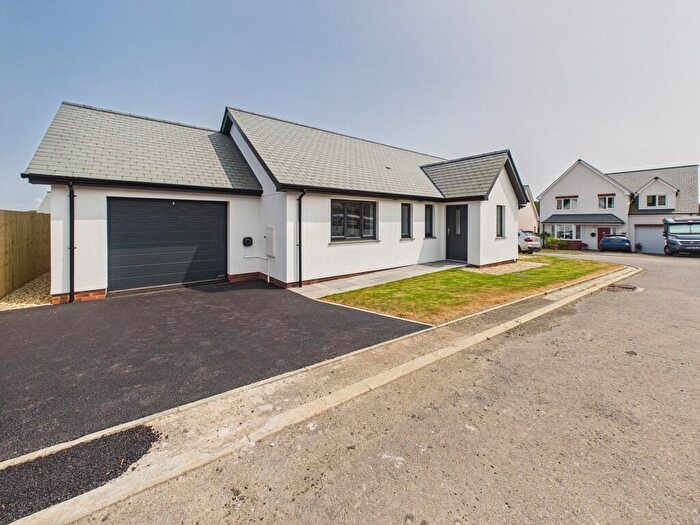

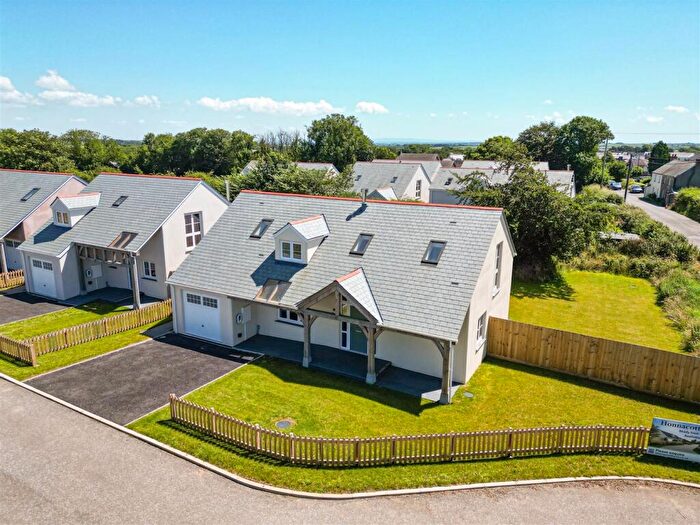
![]()
If you are looking to sell your house, let it out, or receive a property valuation, an expert can help you.
Click the button below to get started.
Roads and Postcodes in Hartland
Navigate through our locations to find the location of your next house in Hartland, Holsworthy for sale or to rent.
| Streets | Postcodes |
|---|---|
| Collacott Close | EX22 7FB |
| Morice Terrace | EX22 7PP |
| North Road | EX22 7SX |
| The Square | EX22 7SY EX22 7TD |
| Witheridge Close | EX22 7FJ |
| EX22 7RX EX22 7SE EX22 7PX EX22 7PZ EX22 7QG EX22 7QN EX22 7QU EX22 7RD EX22 7RF EX22 7RP EX22 7SB EX22 7SD EX22 7SJ EX22 7SL EX22 7TS EX22 7TX EX22 7TZ EX22 7UB |
Property price trends in Hartland
According to the latest Land Registry data, the average home in Hartland sold for £430,000 in 2025. That figure comes from 15 sales logged over the past 18 years.
Prices have continued to climb over the last three years. Compared with 2022, when the typical sale came in around £380,000, that's a rise of roughly 13.2%.
Looking back five years, average prices are down about 32.3% since 2020, a drop of around £205,000 in cash terms.
Zoom out to the past decade for the fuller picture. Back in 2015, homes here averaged £282,000, so the typical sold price has climbed about 52.5% since then, roughly 4.3% a year.
Frequently asked questions about Hartland
What is the average price for a property for sale in Hartland?
The average price for a property for sale in Hartland is £353,750. This amount is 7% higher than the average price in Holsworthy. There are 440 property listings for sale in Hartland.
Which train stations are available in or near Hartland?
Some of the train stations available in or near Hartland are Chapelton, Barnstaple and Umberleigh.
Property Price Paid in Hartland by Year
The average sold property price by year was:
| Year | Average Sold Price | Price Change |
Sold Properties
|
|---|---|---|---|
| 2025 | £430,000 | 35% |
1 Property |
| 2023 | £277,500 | -37% |
1 Property |
| 2022 | £380,000 | -67% |
1 Property |
| 2020 | £635,000 | 58% |
2 Properties |
| 2019 | £267,475 | -51% |
2 Properties |
| 2018 | £405,000 | 49% |
1 Property |
| 2017 | £205,000 | -74% |
1 Property |
| 2016 | £356,500 | 21% |
2 Properties |
| 2015 | £282,000 | -101% |
1 Property |
| 2014 | £566,900 | 44% |
1 Property |
Property Price per Property Type in Hartland
Here you can find historic sold price data in order to help with your property search.
The average Property Paid Price for specific property types in the last three years are:
| Property Type | Average Sold Price | Sold Properties |
|---|---|---|
| Detached House | £353,750.00 | 2 Detached Houses |
