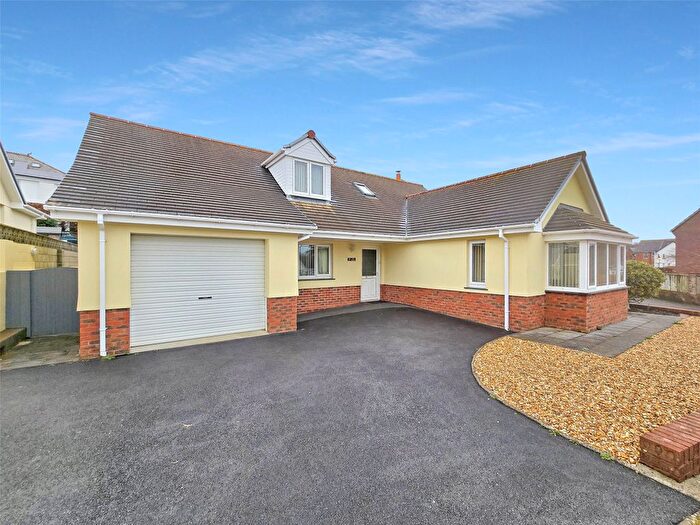
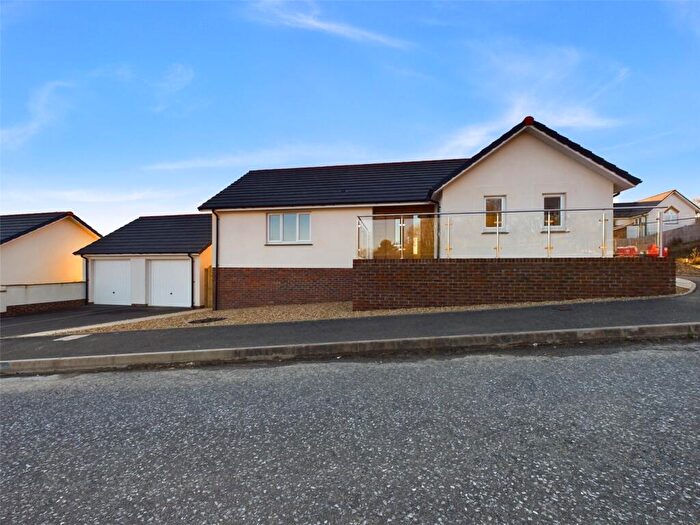
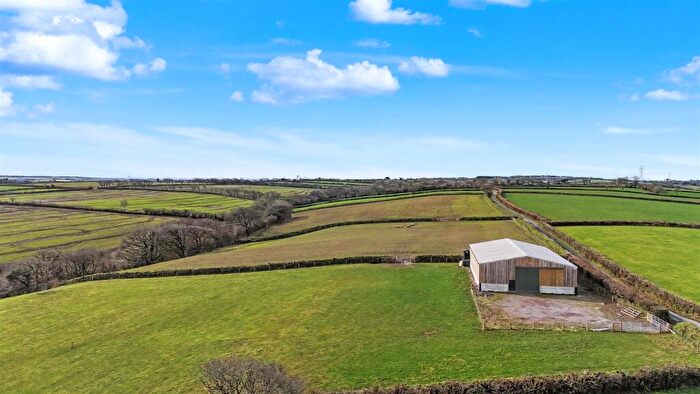
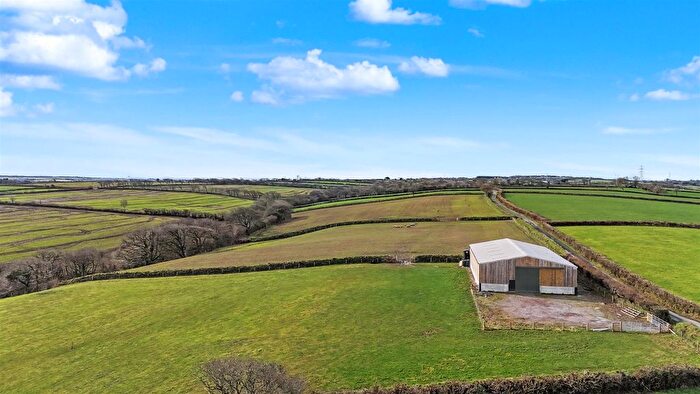
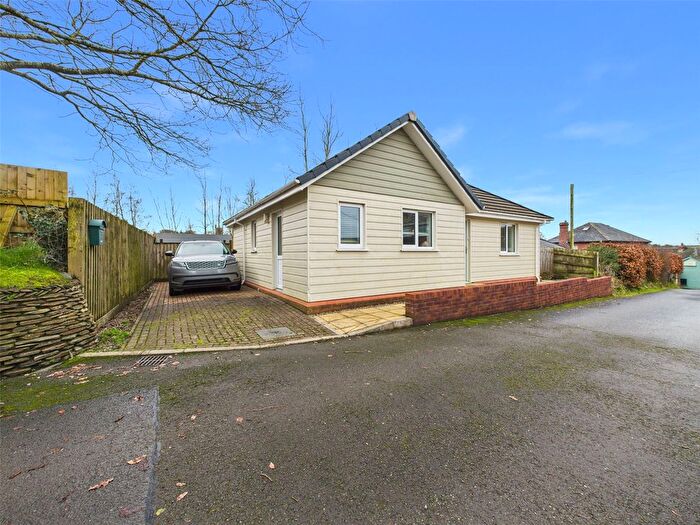
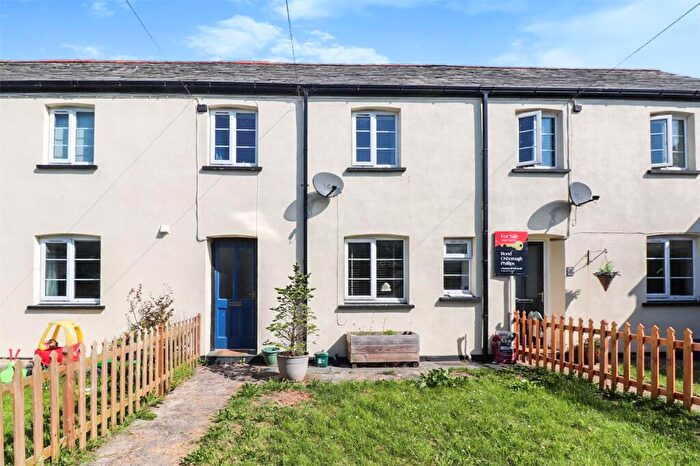
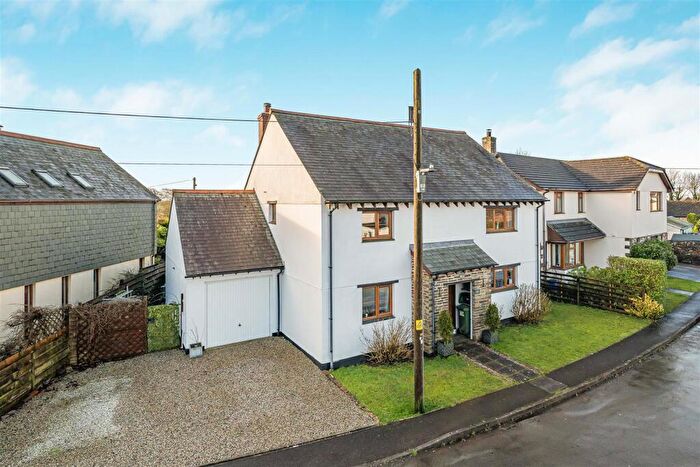
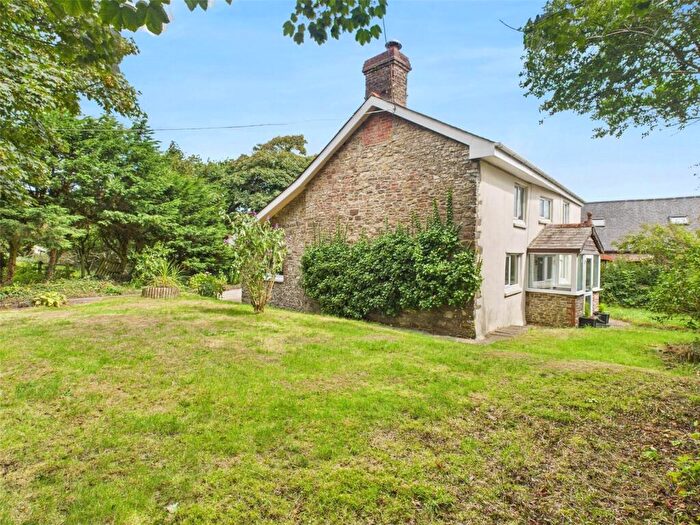
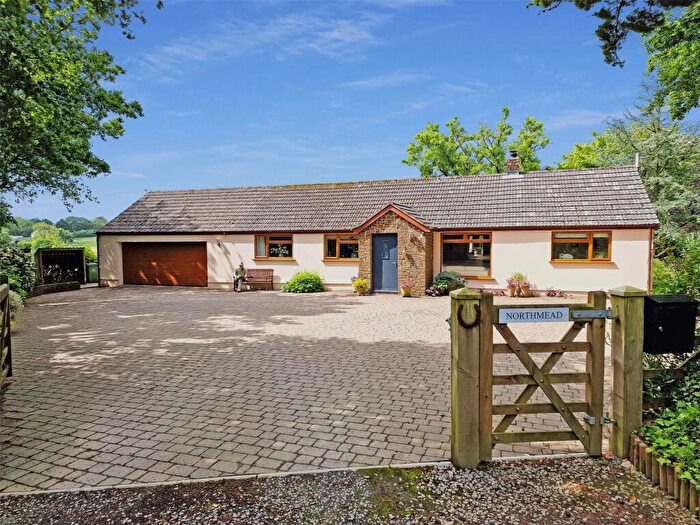
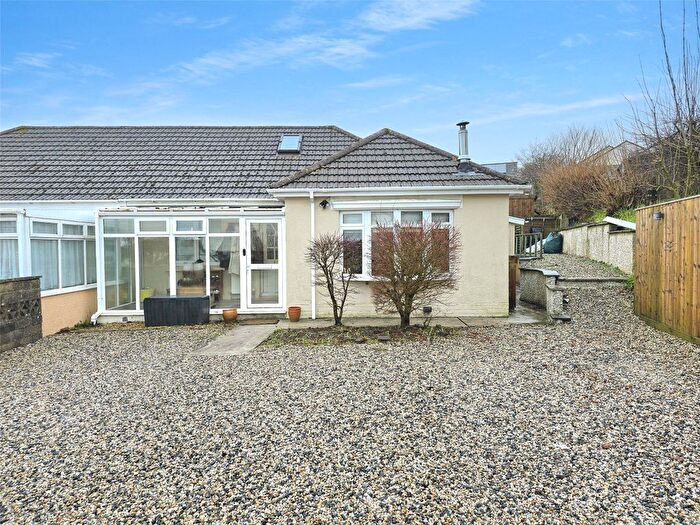
Houses for sale & to rent in Milton & Tamarside, Holsworthy
House Prices in Milton & Tamarside
Properties in Milton & Tamarside have an average house price of £466,714.00 and had 7 Property Transactions within the last 3 years¹.
Milton & Tamarside is an area in Holsworthy, Devon with 156 households², where the most expensive property was sold for £615,000.00.
Properties for sale in Milton & Tamarside
Roads and Postcodes in Milton & Tamarside
Navigate through our locations to find the location of your next house in Milton & Tamarside, Holsworthy for sale or to rent.
| Streets | Postcodes |
|---|---|
| Brandis Corner | EX22 7XY |
| Holsworthy Agri Business Park | EX22 7FA |
| Littlebridge Cross | EX22 7EU |
| Meadow View | EX22 7FN |
| Moore Crescent | EX22 7FE |
| EX22 6JN EX22 6JP EX22 6JS EX22 6LA EX22 6LF EX22 6LL EX22 6NB EX22 6ND EX22 6NJ EX22 6NL EX22 6NS EX22 6NU EX22 6NW EX22 6SL EX22 7AH EX22 7AL EX22 7AR EX22 7AT EX22 7AU EX22 7AZ EX22 7BJ EX22 7BP EX22 7BS EX22 7BW EX22 7BX EX22 7DB EX22 7DE EX22 7DG EX22 7DJ EX22 7DS EX22 7DT EX22 7EG EX22 7EH EX22 7FL EX22 7HF EX22 7HH EX22 7JD EX22 7JE EX22 7JF EX22 7JG EX22 7JL EX22 7JR EX22 7JW EX22 7JY EX22 7LA EX22 7LF EX22 7LJ EX22 7LX EX22 7NF EX22 7NG EX22 7NJ EX22 7NQ EX22 7PB EX22 7YJ |
Transport near Milton & Tamarside
-
Okehampton Station
-
Sampford Courtenay Station
-
Chapelton Station
-
Portsmouth Arms Station
-
Umberleigh Station
- FAQ
- Price Paid By Year
- Property Type Price
Frequently asked questions about Milton & Tamarside
What is the average price for a property for sale in Milton & Tamarside?
The average price for a property for sale in Milton & Tamarside is £466,714. This amount is 42% higher than the average price in Holsworthy. There are 2,196 property listings for sale in Milton & Tamarside.
Which train stations are available in or near Milton & Tamarside?
Some of the train stations available in or near Milton & Tamarside are Okehampton, Sampford Courtenay and Chapelton.
Property Price Paid in Milton & Tamarside by Year
The average sold property price by year was:
| Year | Average Sold Price | Price Change |
Sold Properties
|
|---|---|---|---|
| 2025 | £395,000 | -21% |
1 Property |
| 2023 | £478,666 | -0,1% |
6 Properties |
| 2022 | £479,333 | -1% |
3 Properties |
| 2021 | £484,250 | 35% |
8 Properties |
| 2020 | £313,875 | 15% |
4 Properties |
| 2019 | £268,000 | -51% |
3 Properties |
| 2018 | £404,500 | 21% |
5 Properties |
| 2016 | £321,150 | -29% |
2 Properties |
| 2015 | £414,250 | 24% |
4 Properties |
| 2012 | £315,000 | 25% |
1 Property |
| 2010 | £235,000 | 94% |
1 Property |
| 2001 | £14,000 | - |
1 Property |
Property Price per Property Type in Milton & Tamarside
Here you can find historic sold price data in order to help with your property search.
The average Property Paid Price for specific property types in the last three years are:
| Property Type | Average Sold Price | Sold Properties |
|---|---|---|
| Detached House | £407,500.00 | 4 Detached Houses |
| Terraced House | £545,666.00 | 3 Terraced Houses |

