
Houses for sale in Ilfracombe, Devon
House Prices in Ilfracombe
Properties in Ilfracombe have an average house price of £278k and had 746 Property Transactions within the last 3 years.¹
Ilfracombe is an area in Devon with 6,888 households², where the most expensive property was sold for £2.5M.
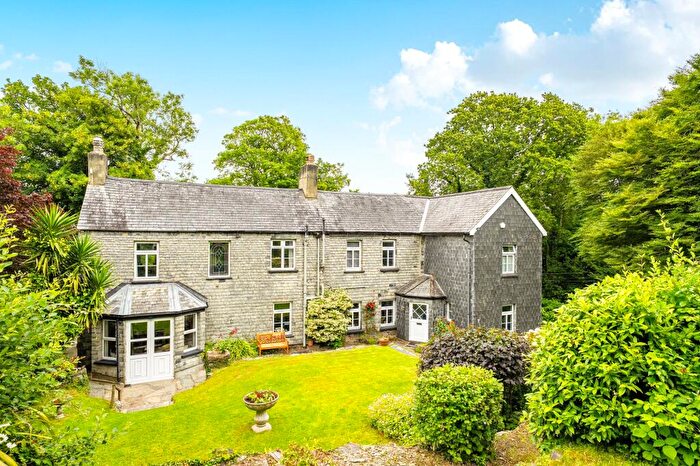
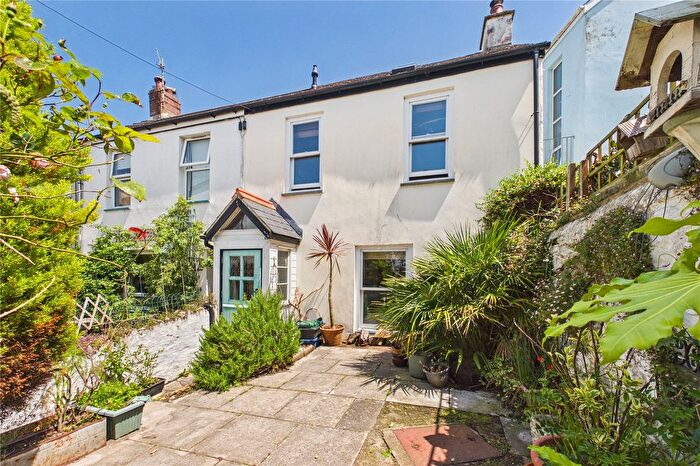
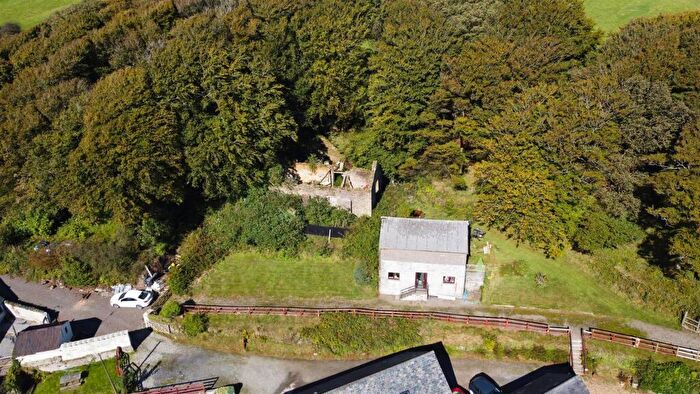
Properties for sale in Ilfracombe
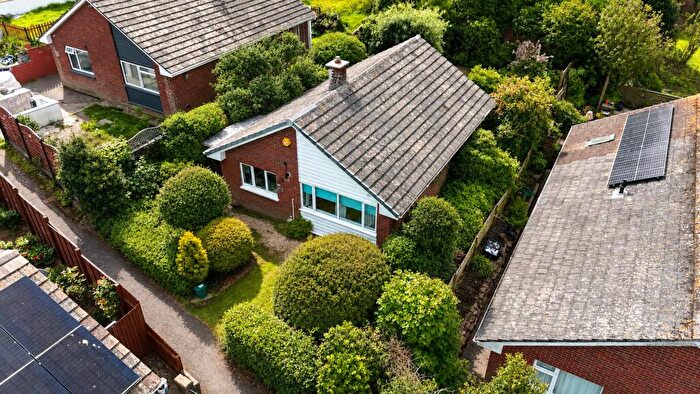
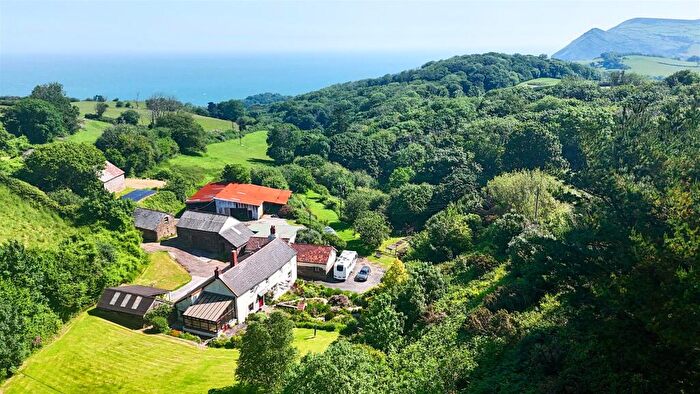
![]()
If you are looking to sell your house, let it out, or receive a property valuation, an expert can help you.
Click the button below to get started.

Neighbourhoods in Ilfracombe
Navigate through our locations to find the location of your next house in Ilfracombe, Devon for sale or to rent.
Property price trends in Ilfracombe
According to the latest Land Registry data, the average home in Ilfracombe sold for £292,840 in 2026. That figure comes from a substantial record of 9,900 sales logged over the past 31 years.
Prices have moved up over the last three years. Compared with 2023, when the typical sale came in around £278,075, that's a rise of roughly 5.3%.
Looking back five years, average prices are up about 2.7% since 2021, a gain of around £7,759 in cash terms.
Zoom out to the past decade for the fuller picture. Back in 2016, homes here averaged £215,477, so the typical sold price has climbed about 35.9% since then, roughly 3.1% a year. Stretch the view to fifteen years and that annual pace holds at about 3%.
Frequently asked questions about Ilfracombe
What is the average price for a property for sale in Ilfracombe?
The average price for a property for sale in Ilfracombe is £278,206. This amount is 23% lower than the average price in Devon. There are 3,083 property listings for sale in Ilfracombe.
What locations have the most expensive properties for sale in Ilfracombe?
The locations with the most expensive properties for sale in Ilfracombe are Georgeham And Mortehoe at an average of £415,671, Mortehoe at an average of £397,500 and Combe Martin at an average of £363,668.
What locations have the most affordable properties for sale in Ilfracombe?
The locations with the most affordable properties for sale in Ilfracombe are Ilfracombe Central at an average of £202,659, Ilfracombe West at an average of £276,016 and Ilfracombe East at an average of £294,976.
Which train stations are available in or near Ilfracombe?
Some of the train stations available in or near Ilfracombe are Barnstaple, Chapelton and Umberleigh.
Property Price Paid in Ilfracombe by Year
The average sold property price by year was:
| Year | Average Sold Price | Price Change |
Sold Properties
|
|---|---|---|---|
| 2026 | £292,840 | 4% |
27 Properties |
| 2025 | £280,187 | 2% |
229 Properties |
| 2024 | £274,779 | -1% |
238 Properties |
| 2023 | £278,075 | -7% |
252 Properties |
| 2022 | £298,782 | 5% |
294 Properties |
| 2021 | £285,081 | 14% |
379 Properties |
| 2020 | £246,007 | 12% |
303 Properties |
| 2019 | £217,238 | 14% |
348 Properties |
| 2018 | £186,300 | -17% |
382 Properties |
| 2017 | £217,553 | 1% |
340 Properties |
Property Price per Property Type in Ilfracombe
Here you can find historic sold price data in order to help with your property search.
The average Property Paid Price for specific property types in the last three years are:
| Property Type | Average Sold Price | Sold Properties |
|---|---|---|
| Semi Detached House | £301,385.00 | 106 Semi Detached Houses |
| Detached House | £420,968.00 | 204 Detached Houses |
| Terraced House | £237,658.00 | 262 Terraced Houses |
| Flat | £157,766.00 | 174 Flats |
Transport in Ilfracombe
Please see below transportation links in this area:
